. 2023 Dec 9;24(24):17305.
doi: 10.3390/ijms242417305.

Development of Single-Segment Substitution Lines and Fine-Mapping of qSPP4 for Spikelets Per Panicle and qGW9 for Grain Width Based on Rice Dual-Segment Substitution Line Z783

Affiliations

Development of Single-Segment Substitution Lines and Fine-Mapping of qSPP4 for Spikelets Per Panicle and qGW9 for Grain Width Based on Rice Dual-Segment Substitution Line Z783

Keli Deng et al. Int J Mol Sci. .

Abstract

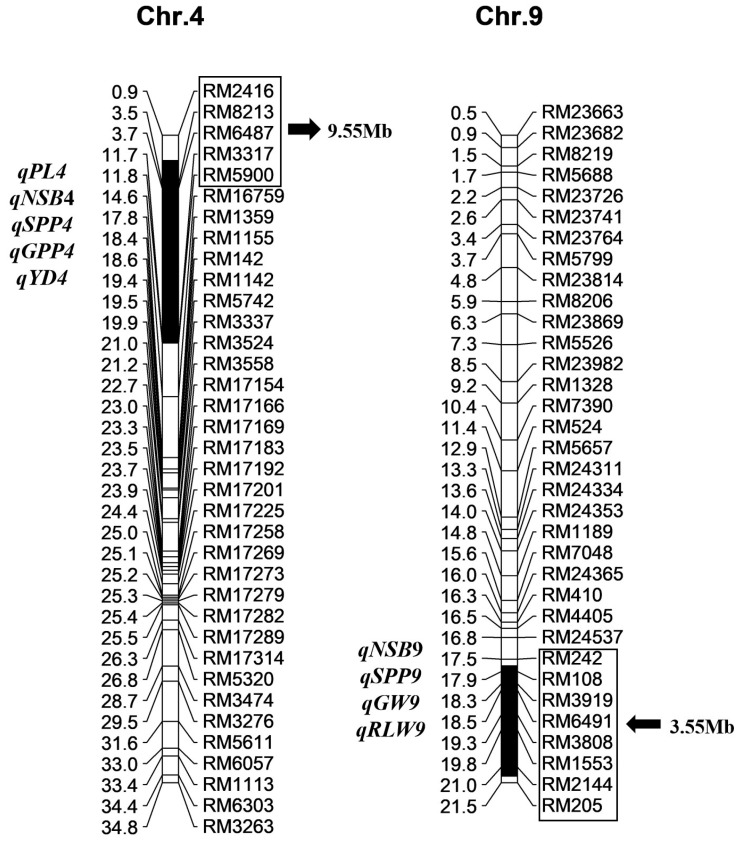
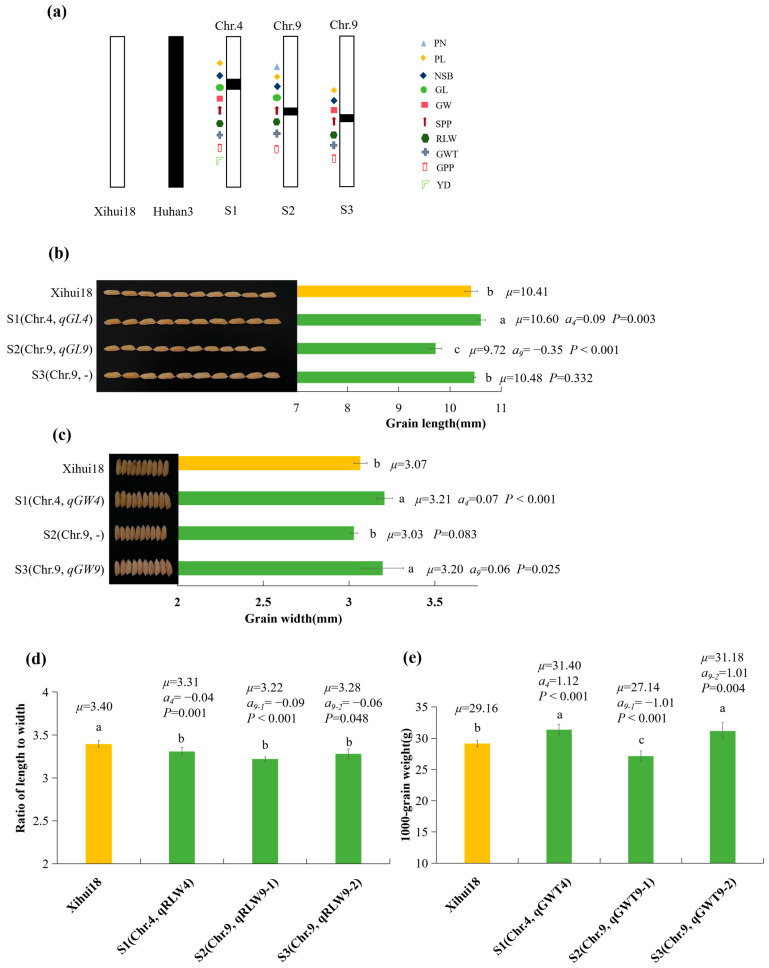
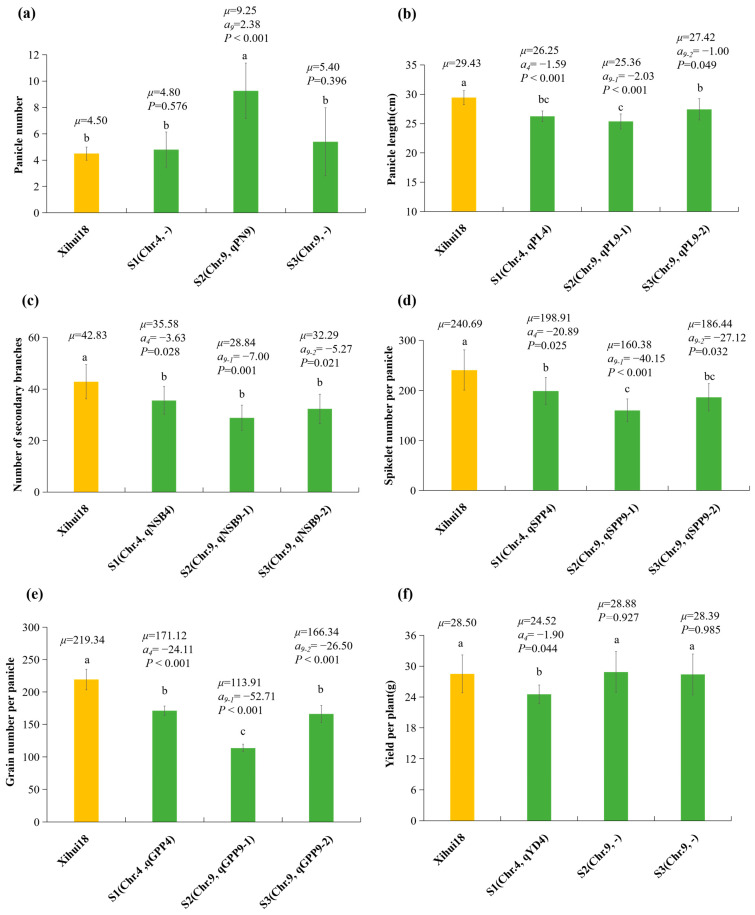
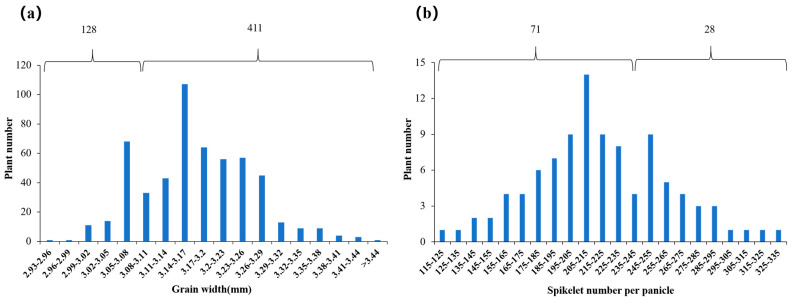
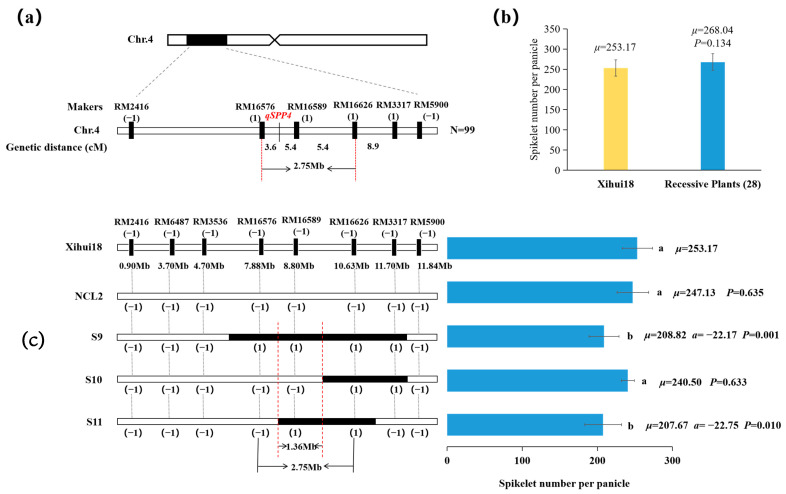
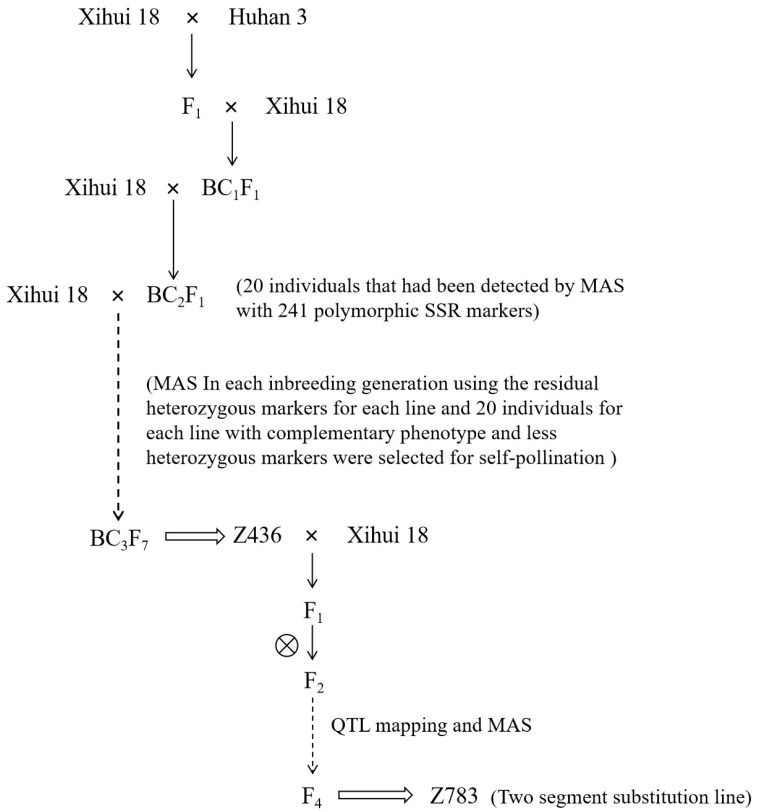
Single segment substitution line (SSSL) libraries are an ideal platform for breeding by design. To develop SSSLs-Xihui18 covering the whole genome, a novel rice chromosome segment substitution line (CSSL), Z783, carrying two substitution segments (average length of 6.55 Mb) on Chr.4 and Chr.9 was identified, which was a gap in the library previously. Z783 was developed from the progeny of recipient "Xihui18" (an indica restorer line) and donor "Huhan3" (a japonica cultivar) by advanced backcross combined molecular marker-assisted selection (MAS). It displayed multiple panicles and less spikelets and wide grains. Then, a F2 population derived from Xihui18/Z783 was used to map quantitative trait loci (QTLs) for yield-related traits by the mixed linear model method. Nine QTLs were detected (p < 0.05). Furthermore, three SSSLs were constructed by MAS, and all 9 QTLs could be validated, and 15 novel QTLs could be detected by these SSSLs by a one-way ANOVA analysis. The genetic analysis showed that qSSP4 for less spikelets and qGW9 for wide grain all displayed dominant gene action in their SSSLs. Finally, qSSP4 and qGW9 were fine-mapped to intervals of 2.75 Mb and 1.84 Mb, on Chromosomes 4 and 9, respectively. The results lay a solid foundation for their map cloning and molecular breeding by design.

Keywords: QTL; additive effect; chromosomal segment substitution line; grain number and size.


Conflict of interest statement

The authors declare no conflict of interest.

Figures

Figure 1
Figure 1
Substitution segments and detected QTLs in Z783 (Indica 9311 as the referred genome). Physical distances (Mb) and mapped QTLs are marked at the left of each chromosome; markers and substitution length (black arrow direction) are displayed to the right of each chromosome. PL, panicle length; NSB, number of secondary branches; GPP, grain number per panicle; GW, grain width; RLW, ratio of length to width; YD, yield per plant.
Figure 2
Figure 2
Phenotype analysis of Xihui18 and Z783. (a) Plant types of Xihui18 and Z783; (b,c) statistic analysis of plant height (b) and panicle numbers (c) between Xihui18 and Z783; (d) panicles of Xihui18 and Z783; (ei) statistic analysis of panicle length (e), number of primary branches (f), number of secondary branches (g), spikelet number per panicle (h), grain number per panicle (i) between Xihiui18 and Z783; (j) grain length of Xihui18 (up) and Z783 (down); (k) statistic analysis between grain length of Xihui18 and Z783; (l) grain width of Xihui18 (up) and Z783 (down); (mo) statistic analysis of grain width (m), 1000 grain weight (n), and ratio of length to width (o) between Xihui18 and Z783. Bars represented 20 cm in (a), 5 cm in (d), 10 mm in (j), and 5 mm in (l). * and ** indicate significant differences at the 0.05 and 0.01 level, respectively by Student-t test.
Figure 3
Figure 3
Substitution segment of the development of SSSLs (S1–S3) and additive effects analysis of QTL for grain size. (a) diagram of the locations of substitution segments and QTL in S1–S3. (be) Parameters of QTL for grain size in different SSSLs. (b) Grain length; (c) grain width; (d) ratio of length to width; (e) 1000 grain weight. Different lowercase letters on each top column indicated significant difference (p < 0.05), as determined by Duncan’s multiple comparison. μ, the average value of each line; ai, additive effect for each QTL controlling the trait, the positive value of which showed allele from substitution segment increasing phenotypic value, while negative value decreased. p < 0.05 in SSSL indicated that a QTL existed in the substitution segment of the SSSL, as determined by one-way ANOVA and LSD multiple comparison with Xihui18. S1 (Chr.4: RM2416 (0.90 Mb)--RM3317 (11.70 Mb)--RM5900 (11.84 Mb)); S2 (Chr.9: RM242 (17.48 Mb)--RM108 (17.93 Mb)--RM2144 (21.02 Mb)); S3 (Chr.9: RM108 (17.93 Mb)--RM2144 (21.02 Mb)--RM205 (21.53 Mb)). The middle markers indicated the substitution segment from the donor, whereas the markers at each end of the substitution segment linked with “--” indicated that segment recombination might have occurred.
Figure 4
Figure 4
Additive effects analysis of QTL for panicle-related traits. (a) Panicle number per plant; (b) panicle length; (c) number of secondary branches per panicle; (d) spikelet number per panicle; (e) grain number per panicle; (f) yield per plant. Different lowercase letters on each top column indicated significant difference (p < 0.05), as determined by Duncan’s multiple comparison. μ, the average value of each line; ai, additive effect for each QTL controlling the trait, the positive value of which showed allele from substitution segment increasing phenotypic value, while negative value decreased one. p < 0.05 in SSSL indicated that a QTL existed in the substitution segment of the SSSL, as determined by one-way ANOVA and LSD multiple comparison with Xihui18. S1 (Chr4: RM2416 (0.90 Mb)--RM3317 (11.70 Mb)--RM5900 (11.84 Mb)); S2 (Chr9: RM242 (17.48 Mb)--RM108 (17.93 Mb)--RM2144 (21.02 Mb)); S3 (Chr9: RM108 (17.93 Mb)--RM2144 (21.02 Mb)--RM205 (21.53 Mb)). The middle markers indicated the substitution segment from the donor, whereas the markers at each end of the substitution segment linked with “--” indicated that segment recombination might have occurred.
Figure 5
Figure 5
Genetic analysis of qGW9 for grain width and qSPP4 for spikelet number per panicle. (a) Grain width distribution in the F3 population consists of 539 individual plants derived from a recombinant plant with qGW9. (b) Spikelet numbers of main panicle distribution in the F3 population consists of 99 individual plants derived from a recombinant plant with qSPP4.
Figure 6
Figure 6
Fine mapping and substitution mapping of qGW9. (a) qGW9 has been fine-mapped to the interval between RM108 and RM24792. (b) Statistic analysis of grain widths for 10 individuals of Xihui18 and 128 recessive individuals. (c) Black regions indicate the estimated length of the substitution segment. NCL, negative control line, the bands of markers in which in corresponding substitution intervals was consistent with those of Xihui18. Different lowercase letters on each top column indicated significant difference (p < 0.05), as determined by Duncan’s multiple comparison.
Figure 7
Figure 7
Fine mapping and overlapping substitution mapping of qSPP4. (a) qSPP4 has been fine-mapped to the interval between RM2416 and RM5900. (b) Statistic analysis of spikelet number per panicle for 10 individuals of Xihui18 and 28 recessive individuals with multiple spikelets. (c) Black regions indicate the estimated length of the substitution segment. NCL, negative control line, the bands of markers of which in corresponding substitution intervals was consistent with those of Xihui18. Different lowercase letters on each top column indicated significant difference (p < 0.05), as determined by Duncan’s multiple comparison.
Figure 8
Figure 8
Development process of Z783 materials.

Similar articles

Cited by

References

    1. Bruinsma J. The Resource Outlook to 2050: By How Much Do Land, Water and Crop Yields Need to Increase by 2050? Food and Agriculture Organization (FAO); Rome, Italy: 2009.
    1. Tilman D., Balzer C., Hill J., Befort B.L. Global food demand and the sustainable intensification of agriculture. Proc. Natl. Acad. Sci. USA. 2011;108:20260–20264. doi: 10.1073/pnas.1116437108. - DOI - PMC - PubMed
    1. Sandhu J., Zhu F., Paul P., Gao T., Dhatt B.K., Ge Y., Staswick P., Yu H., Walia H. PI-Plat: A high-resolution image-based 3D reconstruction method to estimate growth dynamics of rice inflorescence traits. Plant Methods. 2019;15:162. doi: 10.1186/s13007-019-0545-2. - DOI - PMC - PubMed
    1. Tester M., Langridge P. Breeding technologies to increase crop production in a changing world. Science. 2010;327:818–822. doi: 10.1126/science.1183700. - DOI - PubMed
    1. Xing Y.Z., Zhang Q.F. Genetic and molecular bases of rice yield. Annu. Rev. Plant Biol. 2010;61:421–442. doi: 10.1146/annurev-arplant-042809-112209. - DOI - PubMed

LinkOut - more resources