. 2023 Dec 13;24(24):17438.
doi: 10.3390/ijms242417438.

Control of CCR5 Cell-Surface Targeting by the PRAF2 Gatekeeper

Affiliations

Control of CCR5 Cell-Surface Targeting by the PRAF2 Gatekeeper

Elisa Da Silva et al. Int J Mol Sci. .

Abstract

The cell-surface targeting of neo-synthesized G protein-coupled receptors (GPCRs) involves the recruitment of receptors into COPII vesicles budding at endoplasmic reticulum exit sites (ERESs). This process is regulated for some GPCRs by escort proteins, which facilitate their export, or by gatekeepers that retain the receptors in the ER. PRAF2, an ER-resident four trans- membrane domain protein with cytoplasmic extremities, operates as a gatekeeper for the GB1 protomer of the heterodimeric GABAB receptor, interacting with a tandem di-leucine/RXR retention motif in the carboxyterminal tail of GB1. PRAF2 was also reported to interact in a two-hybrid screen with a peptide corresponding to the carboxyterminal tail of the chemokine receptor CCR5 despite the absence of RXR motifs in its sequence. Using a bioluminescence resonance energy transfer (BRET)-based subcellular localization system, we found that PRAF2 inhibits, in a concentration-dependent manner, the plasma membrane export of CCR5. BRET-based proximity assays and Co-IP experiments demonstrated that PRAF2/CCR5 interaction does not require the presence of a receptor carboxyterminal tail and involves instead the transmembrane domains of both proteins. The mutation of the potential di-leucine/RXR motif contained in the third intracellular loop of CCR5 does not affect PRAF2-mediated retention. It instead impairs the cell-surface export of CCR5 by inhibiting CCR5's interaction with its private escort protein, CD4. PRAF2 and CD4 thus display opposite roles on the cell-surface export of CCR5, with PRAF2 inhibiting and CD4 promoting this process, likely operating at the level of CCR5 recruitment into COPII vesicles, which leave the ER.

Keywords: BRET; ERES; G protein-coupled receptor; biosensor; cell trafficking; endoplasmic reticulum; escort protein; gatekeeper.


Conflict of interest statement

The authors declare no conflict of interest.

Figures

Figure 1
Figure 1
Potential PRAF2-interacting motifs in the sequence of human CCR5. (A) Protein sequence of human CCR5; the seven transmembrane domains are in bold. Putative PRAF2 di-leucine (LL) and arginine-based interaction motifs (RXR) present in the CCR5 third intra-cytoplasmic loop and C-terminus are in blue. The sequence of the CCR5 peptide used in the two-hybrid screen, which identified the interaction of CCR5 with PRAF2, is underlined. The red bi-directional arrow follows the last amino acid residue of the CCR5-ΔCter mutant. (B) Nomenclature of CCR5 third intracellular loop (IC3) LL/RXR motif mutants investigated in the study (mutations are in red).
Figure 2
Figure 2
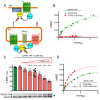
Overexpression of PRAF2 reduces CCR5 export to the cell surface, probably by retaining the receptor in the ER. (A) Diagrams of BRET-based assays. Top: biosensor to measure CCR5 export to the cell surface. Bottom: BRET assay to monitor PRAF2/CCR5 proximity. Wild-type CCR5 is exported to the cell surface, only part of it in proximity to the BRET acceptor fused to PRAF2. CCR5 missing the carboxy-terminal tail (CCR5-ΔCter) is totally retained in the ER and can be fully saturated by PRAF2-YFP. (B) BRET saturation curves (see Methods) obtained by co-expressing CCR5-Rluc or CCR5 ΔCter-Rluc in HEK-293 cells with increasing concentrations of GAP43-YFP BRET acceptor. Mean values ± SEM are shown (data compiled from 3 independent experiments in triplicate). For CCR5-Rluc, the BRETmax (BRET value at saturation) was 825.5 ± 28.5, and the BRET50 (the YFP/Rluc ratio at 50% saturation) was 2.1 ± 0.15. (C) Monitoring cell-surface CCR5 in the presence of increasing concentrations of PRAF2. BRET experiments were conducted with constant amounts of CCR5-Rluc and GAP43-YFP and increasing concentrations of PRAF2-V5 (0–1.4 µg of transfected DNA). Mean values ± SEM are shown (data from 3 independent experiments in triplicate. ****: p ≤ 0.0001). p-values were calculated using one-way ANOVA followed by Dunnett’s multiple comparison test with CCR5-Rluc in the absence of PRAF2-V5. The immunoblot at the bottom shows the actual expression of PRAF2-V5 relative to the endogenous PRAF2. Note that, at the highest concentrations, a fraction of PRAF2-V5 is partially degraded (arrowhead). Since the MW of the cleavage product migrates above the endogenous PRAF2, the cleavage probably occurs within the tag, generating a fragment, which includes an entire functional PRAF2. (D) BRET experiments comparing the proximity of CCR5-Rluc and CCR5 ΔCter-Rluc to PRAF2-YFP. BRETmax values: 498.2 ± 20.7 (R2 = 0.9; 88 dof) for CCR5 and 552.4 ± 14.5 (R2 = 0.99; 88 dof) for CCR5 ΔCter-Rluc, p = 0.16 (ns). BRET50 values: 4.0 ± 0.3 and 1.7 ± 0.1 for CCR5-Rluc and CCR5 ΔCter-Rluc, respectively, p ≤ 0.05 *; dof: degrees of freedom.
Figure 3
Figure 3
Effect of disrupting LL and RXR motifs in the third intracellular loop of CCR5 on surface export and PRAF2 proximity. (A) Comparison of plasma membrane targeting of CCR5 and CCR5 mutants (all HA-tagged and fused to Rluc; see Figure 1B for nomenclature) using the BRET biosensor described in Figure 2. Mean values ± SEM are shown (data from 3 independent experiments in triplicate). Calculated BRETmax values: 966.0 ± 20.5 (R2 = 0.98; 70 dof) for CCR5-RLuc; 668.5 ± 26.9 (R2 = 0.92; 70 dof) for CCR5 I3-1-Rluc; 294.9 ± 5.2 (R2 = 0.97; 70 dof) for CCR5 I3-2-Rluc; 425.3 ± 7.6 (R2 = 0.97; 70 dof) for CCR5 I3-3-Rluc; 397.4 ± 13.8 (R2 = 0.89; 70 dof) for CCR5 I3-1,2-Rluc; 538.0 ± 15.2 (R2 = 0.95; 70 dof) for CCR5 I3-1,3-Rluc and 223.1 ± 12.7 (R2 = 0.93; 70 dof) for CCR5 I3-1,2,3-Rluc (statistical analysis in (B)). BRET50 values (2.4 ± 0.15; 1.3 ± 0.15; 2.1 ± 0.13; 1.4 ± 0.1; 1.7 ± 0.2; 2.3 ± 0.2 and 4.7 ± 0.6, following the same order) were not different. (B) Comparison of BRETmax values calculated with GAP43-YFP (red histograms, curves in (A)) or PRAF2-YFP (blue histograms, curves in C) as BRET acceptors. p-values calculated using one-way ANOVA followed by Tukey’s multiple comparison test between CCR5-Rluc and indicated mutants are summarized as follows: ** p ≤ 0.01; *** p ≤ 0.001; **** p ≤ 0.0001; the absence of asterisks indicates a nonsignificant difference. (C) BRET proximity assays of CCR5 and CCR5 mutants with PRAF2 (as in Figure 2D). Mean values ± SEM are shown (data from 3 independent experiments in triplicate). BRETmax values (same order as in (A)) were not significantly different: 369.1 ± 9.5 (R2 = 0.97; 67 dof); 386.3 ± 9.3 (R2 = 0.97; 67 dof); 489.7 ± 14.2 (R2 = 0.94; 64 dof); 450.4 ± 17.5 (R2 = 0.93; 61 dof); 509.0 ± 13.8 (R2 = 0.94; 70 dof); 434.9 ± 11.9 (R2 = 0.94; 67 dof); 518.3 ± 13.1 (R2 = 0.94; 64 dof). Corresponding BRET50 values were also not different: 2.4 ± 0.2; 1.4 ± 0.1; 1.0 ± 0.1; 1.5 ± 1.2; 1.3 ± 0.1; 0.8 ± 0.1; 1.0 ± 0.1.
Figure 4
Figure 4
Co-immunoprecipitation experiments of wild-type and mutant CCR5 fused to Rluc by PRAF2-V5. HEK-293 cells were co-transfected with plasmids coding for HA-tagged and Rluc-tagged CCR5 or I3 mutants (described in Figure 1 and Figure 3) and a plasmid coding for PRAF2-V5 or an empty vector (n = 3). After immunoprecipitation with the anti-V5 antibody, co-immunoprecipitated material was separated with PAGE, blotted, and probed with the indicated antibodies. Input is shown on the top part of the panel. Band B corresponds to a core-glycosylated receptor in the ER, and Band C corresponds to an additionally glycosylated receptor in the Golgi or on the cell surface.
Figure 5
Figure 5
BRET saturation experiments between CCR5 and CD4. Constant, equivalent amounts of CCR5-Rluc and CCR5 I3-1,2,3-Rluc were co-expressed with increasing concentrations of the CD4-YFP BRET acceptor. Mean values ± SEM are shown; data were compiled from 4 independent experiments, each performed in triplicate. BRETmax values: 445.2 ± 11.1 (R2 = 0.97; 118 dof) for CCR5-Rluc and 451.7 ± 49.7 (R2 = 0.96; 116 dof) for CCR5 I3-1,2,3-Rluc, p = 0.8, ns. BRET50 values: 4.9 ± 0.3 for CCR5-Rluc and 20.5 ± 3.2 for CCR5 I3-1,2,3-Rluc, ** p = 0.0175. p-values were calculated using an unpaired t-test.
Figure 6
Figure 6
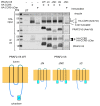
PRAF2 domains interacting with CCR5. HEK-293 cells were transfected with plasmids coding for HA-CCR5 or HA-CCR5-ΔCter in the presence or absence of plasmids coding for wild-type or mutant PRAF2-V5, displaying the indicated deletions (n = 3). After immunoprecipitation with the anti-V5 antibody, co-immunoprecipitated material was separated with PAGE, blotted, and probed with the indicated antibodies. The input is shown on the top part of the panel. Band B corresponds to the core-glycosylated receptor in the ER, and Band C corresponds to an additionally glycosylated receptor in the Golgi or on the cell surface. Bottom cartoon: V5-epitope-tagged wild-type PRAF2 (PRAF2-V5) and V5-tagged PRAF2 mutants deleted from the C-terminus (ΔC), N-terminus (ΔN), or both extremities (ΔNC) used in co-immunoprecipitation experiments.

Similar articles

References

    1. Hanyaloglu A.C., von Zastrow M. Regulation of GPCRs by Membrane Trafficking and Its Potential Implications. Annu. Rev. Pharmacol. Toxicol. 2008;48:537–568. doi: 10.1146/annurev.pharmtox.48.113006.094830. - DOI - PubMed
    1. Barlowe C., Helenius A. Cargo Capture and Bulk Flow in the Early Secretory Pathway. Annu. Rev. Cell Dev. Biol. 2016;32:197–222. doi: 10.1146/annurev-cellbio-111315-125016. - DOI - PubMed
    1. Kurokawa K., Nakano A. The ER exit sites are specialized ER zones for the transport of cargo proteins from the ER to the Golgi apparatus. J. Biochem. 2019;165:109–114. doi: 10.1093/jb/mvy080. - DOI - PubMed
    1. Dong C., Zhou F., Fugetta E.K., Filipeanu C.M., Wu G. Endoplasmic reticulum export of adrenergic and angiotensin II receptors is differentially regulated by Sar1 GTPase. Cell Signal. 2008;20:1035–1043. doi: 10.1016/j.cellsig.2008.01.014. - DOI - PMC - PubMed
    1. Xu X., Lambert N.A., Wu G. Sequence-directed concentration of G protein-coupled receptors in COPII vesicles. iScience. 2023;26:107969. doi: 10.1016/j.isci.2023.107969. - DOI - PMC - PubMed

MeSH terms

LinkOut - more resources