. 2023 Dec 13;24(24):17437.
doi: 10.3390/ijms242417437.

Serum Metabolomic Profiling of Patients with Lipedema

Affiliations

Serum Metabolomic Profiling of Patients with Lipedema

Sally Kempa et al. Int J Mol Sci. .

Abstract

Lipedema is a chronic condition characterized by disproportionate and symmetrical enlargement of adipose tissue, predominantly affecting the lower limbs of women. This study investigated the use of metabolomics in lipedema research, with the objective of identifying complex metabolic disturbances and potential biomarkers for early detection, prognosis, and treatment strategies. The study group (n = 25) comprised women diagnosed with lipedema. The controls were 25 lean women and 25 obese females, both matched for age. In the patients with lipedema, there were notable changes in the metabolite parameters. Specifically, lower levels of histidine and phenylalanine were observed, whereas pyruvic acid was elevated compared with the weight controls. The receiver operating characteristic (ROC) curves for the diagnostic accuracy of histidine, phenylalanine, and pyruvic acid concentrations in distinguishing between patients with lipedema and those with obesity but without lipedema revealed good diagnostic ability for all parameters, with pyruvic acid being the most promising (area under the curve (AUC): 0.9992). Subgroup analysis within matched body mass index (BMI) ranges (30.0 to 39.9 kg/m2) further revealed that differences in pyruvic acid, phenylalanine, and histidine levels are likely linked to lipedema pathology rather than BMI variations. Changes in low-density lipoprotein (LDL)-6 TG levels and significant reductions in various LDL-2-carried lipids of patients with lipedema, compared with the lean controls, were observed. However, these lipids were similar between the lipedema patients and the obese controls, suggesting that these alterations are related to adiposity. Metabolomics is a valuable tool for investigating lipedema, offering a comprehensive view of metabolic changes and insights into lipedema's underlying mechanisms.

Keywords: 1H-NMR; 1H-nuclear magnetic resonance spectroscopy; adipose tissue; lipedema; metabolomics.


Conflict of interest statement

The authors declare no conflict of interest.

Figures

Figure 1
Figure 1
Multivariate statistical analysis of serum metabolic and lipidomic profiles between lipedema patients and nonlipedema controls. (A) Score plots of principal component analysis (PCA) and (C) partial least square discriminant analysis (PLS-DA), showing a distinct separation between lipedema samples (blue triangles), lean controls (green squares), and obese controls (red diamonds). The corresponding loading plots (B,D) display a selection of metabolites and lipoproteins contributing to this clustering. The parameters are color-coded according to their substance classes (metabolites: green, VLDL: orange, LDL: blue, HDL: pink, others: black). PC: principle component; LC: latent variable.
Figure 2
Figure 2
Specific metabolites of lipedema patients compared with weight controls. Significant differences between the groups (lipedema (blue, left), lean controls (green, middle), and obese controls (red, right)) were identified with the Mann–Whitney test (p < 0.05; false discovery rate (FDR): 1%) and labeled with a star (*).
Figure 3
Figure 3
Standard lipid parameters and significantly altered low-density lipoprotein (LDL) subfractions of patients with lipedema compared with lean and obese controls. For classical lipid parameters, no significant differences between lipedema patients (blue, left), lean controls (green, middle), and obese controls (red, right) were observed. For specific subfractions, the Mann–Whitney test (p < 0.05; FDR: 1%) was used to identify differences between the lipedema patients and the lean controls. Significant differences are labeled with a star (*). TG: triglyceride; Chol: Cholesterol; VLDL: very low-density lipoprotein, IDL: intermediate-density lipoprotein; HDL: high-density lipoprotein; Chol: cholesterol; FC: free cholesterol; PL: phospholipid; ApoB: apolipoprotein B.
Figure 4
Figure 4
Matched subgroup analysis of metabolite levels in lipedema patients and obese controls within a BMI range of 30.0 to 39.9 kg/m2 (obesity classes I and II). Significant differences between the groups (lipedema (blue, left) and obese controls (red, right)) were identified with the Mann–Whitney test (p < 0.05; FDR: see legend) and labeled with a star (*). Pyruvic acid, phenylalanine, and histidine levels remained significantly different between the lipedema and obese control groups.
Figure 5
Figure 5
Analysis of correlation between BMI and the relevant metabolites in all overweight subjects. Of the significant parameters (see Figure 2) only pyruvic acid and glucose showed weak correlations with the BMI.
Figure 6
Figure 6
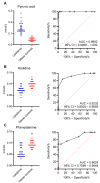
Receiver operating characteristic (ROC) curves used to test the diagnostic performances of the selected metabolites. Differences in the serum levels of pyruvic acid (A), histidine (B), and phenylalanine (C) are shown between lipedema patients (blue, left) and obese controls (red, right). The ROC curves, corresponding areas under the curves (AUCs), and 95% confidence intervals (CIs) indicate diagnostic potential.

References

    1. Herbst K.L., Kahn L.A., Iker E., Ehrlich C., Wright T., McHutchison L., Schwartz J., Sleigh M., Donahue P.M., Lisson K.H., et al. Standard of care for lipedema in the United States. Phlebology. 2021;36:779–796. doi: 10.1177/02683555211015887. - DOI - PMC - PubMed
    1. Ishaq M., Bandara N., Morgan S., Nowell C., Mehdi A.M., Lyu R., McCarthy D., Anderson D., Creek D.J., Achen M.G., et al. Key signaling networks are dysregulated in patients with the adipose tissue disorder, lipedema. Int. J. Obes. 2022;46:502–514. doi: 10.1038/s41366-021-01002-1. - DOI - PMC - PubMed
    1. Child A.H., Gordon K.D., Sharpe P., Brice G., Ostergaard P., Jeffery S., Mortimer P.S. Lipedema: An inherited condition. Am. J. Med. Genet. A. 2010;152a:970–976. doi: 10.1002/ajmg.a.33313. - DOI - PubMed
    1. Katzer K., Hill J.L., McIver K.B., Foster M.T. Lipedema and the Potential Role of Estrogen in Excessive Adipose Tissue Accumulation. Int. J. Mol. Sci. 2021;22:11720. doi: 10.3390/ijms222111720. - DOI - PMC - PubMed
    1. Al-Ghadban S., Cromer W., Allen M., Ussery C., Badowski M., Harris D., Herbst K.L. Dilated Blood and Lymphatic Microvessels, Angiogenesis, Increased Macrophages, and Adipocyte Hypertrophy in Lipedema Thigh Skin and Fat Tissue. J. Obes. 2019;2019:8747461. doi: 10.1155/2019/8747461. - DOI - PMC - PubMed

LinkOut - more resources