

Characterization of Volatile and Particulate Emissions from Desktop 3D Printers
- PMID: 38139506
- PMCID: PMC10747962
- DOI: 10.3390/s23249660
Characterization of Volatile and Particulate Emissions from Desktop 3D Printers
Abstract
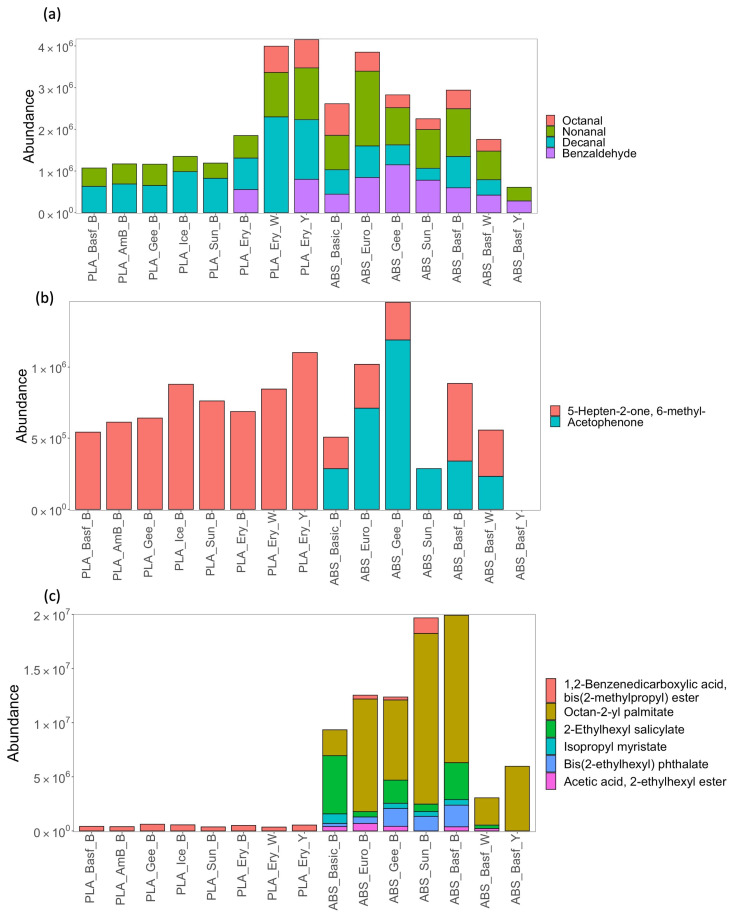
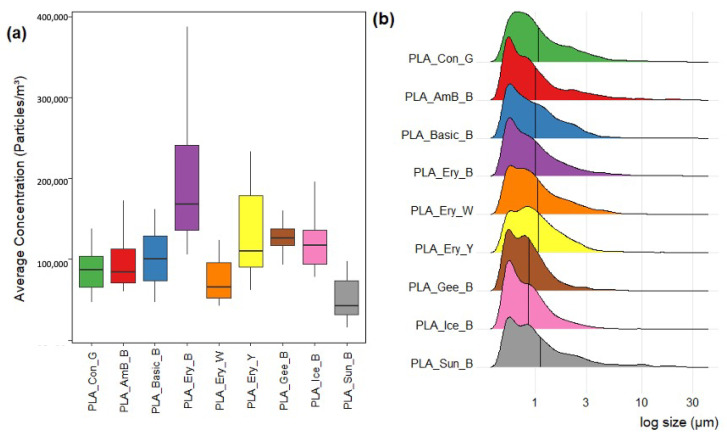
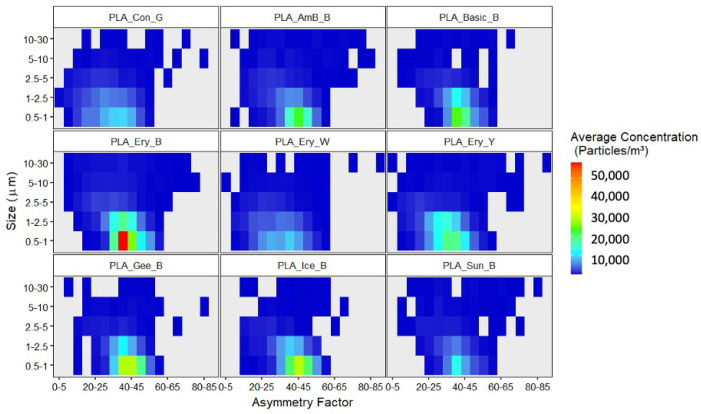
The rapid expansion of 3D printing technologies has led to increased utilization in various industries and has also become pervasive in the home environment. Although the benefits are well acknowledged, concerns have arisen regarding potential health and safety hazards associated with emissions of volatile organic compounds (VOCs) and particulates during the 3D printing process. The home environment is particularly hazardous given the lack of health and safety awareness of the typical home user. This study aims to assess the safety aspects of 3D printing of PLA and ABS filaments by investigating emissions of VOCs and particulates, characterizing their chemical and physical profiles, and evaluating potential health risks. Gas chromatography-mass spectrometry (GC-MS) was employed to profile VOC emissions, while a particle analyzer (WIBS) was used to quantify and characterize particulate emissions. Our research highlights that 3D printing processes release a wide range of VOCs, including straight and branched alkanes, benzenes, and aldehydes. Emission profiles depend on filament type but also, importantly, the brand of filament. The size, shape, and fluorescent characteristics of particle emissions were characterized for PLA-based printing emissions and found to vary depending on the filament employed. This is the first 3D printing study employing WIBS for particulate characterization, and distinct sizes and shape profiles that differ from other ambient WIBS studies were observed. The findings emphasize the importance of implementing safety measures in all 3D printing environments, including the home, such as improved ventilation, thermoplastic material, and brand selection. Additionally, our research highlights the need for further regulatory guidelines to ensure the safe use of 3D printing technologies, particularly in the home setting.
Keywords: 3D printing; additive manufacturing; particulate emissions; volatile organic compounds.
Conflict of interest statement
The authors declare no conflict of interest.
Figures
References
-
- Shahrubudin N., Lee T., Ramlan R. An Overview on 3D Printing Technology: Technological, Materials, and Applications. Procedia Manuf. 2019;35:1286–1296. doi: 10.1016/j.promfg.2019.06.089. - DOI
-
- Kantaros A., Ganetsos T., Piromalis D. 4D Printing: Technology Overview and Smart Materials Utilized. J. Mechatron. Robot. 2023;7:1–14. doi: 10.3844/jmrsp.2023.1.14. - DOI
-
- Lee J.Y., An J., Chua C.K. Fundamentals and applications of 3D printing for novel materials. Appl. Mater. Today. 2017;7:120–133. doi: 10.1016/j.apmt.2017.02.004. - DOI
-
- Kantaros A., Piromalis D. Employing a low-cost desktop 3D printer: Challenges, and how to overcome them by tuning key process parameters. Int. J. Mech. Appl. 2021;10:11–19.
-
- Khosravani M.R., Reinicke T. On the environmental impacts of 3D printing technology. Appl. Mater. Today. 2020;20:100689. doi: 10.1016/j.apmt.2020.100689. - DOI
Grants and funding
LinkOut - more resources
Full Text Sources
Miscellaneous
