. 2023 Dec 8;23(24):9713.
doi: 10.3390/s23249713.

A Compact Monitor for Ethylene and Other Plant-Produced Volatile Organic Compounds for NASA Space Missions

Affiliations

A Compact Monitor for Ethylene and Other Plant-Produced Volatile Organic Compounds for NASA Space Missions

Vladimir Dobrokhotov et al. Sensors (Basel). .

Abstract

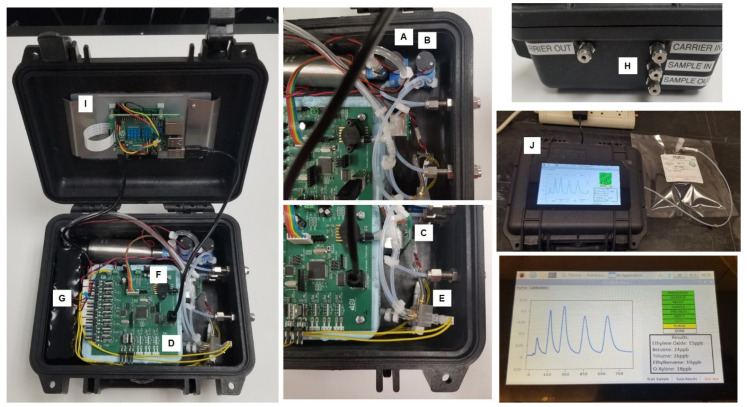
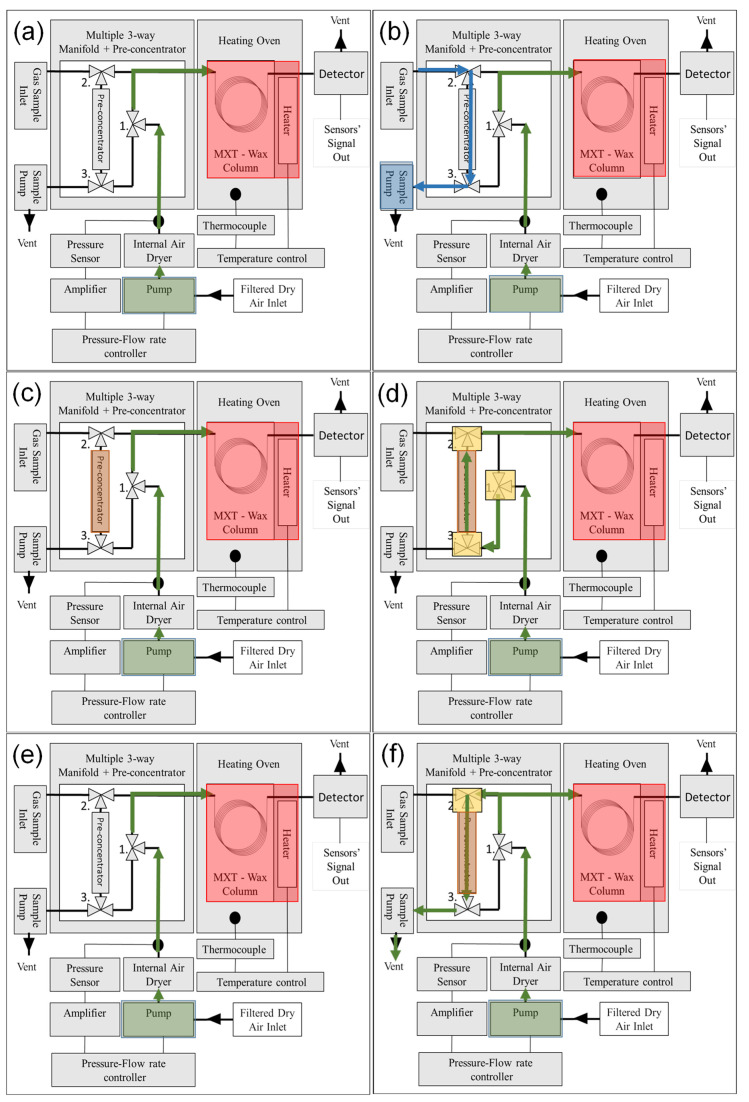
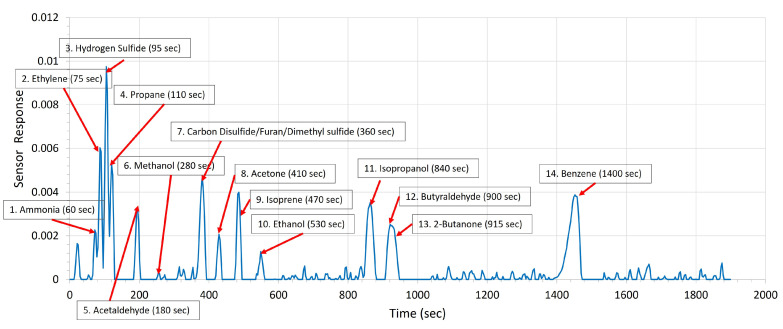
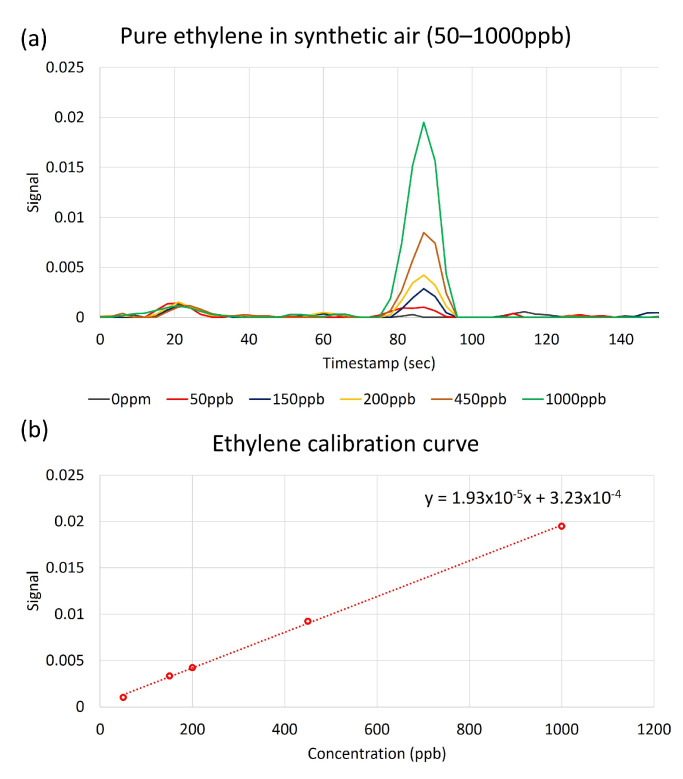
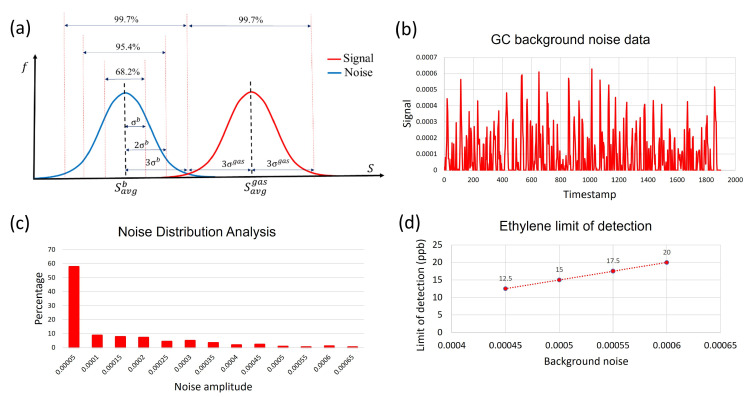
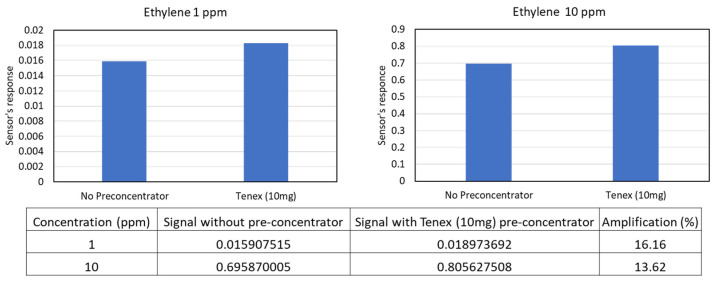
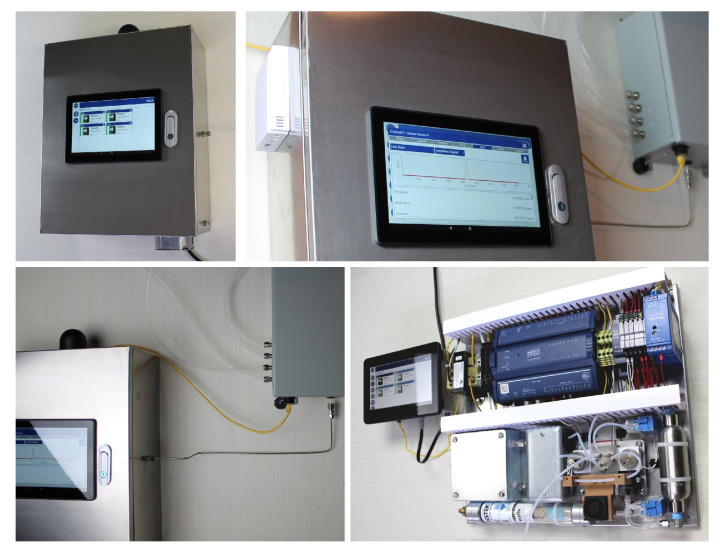
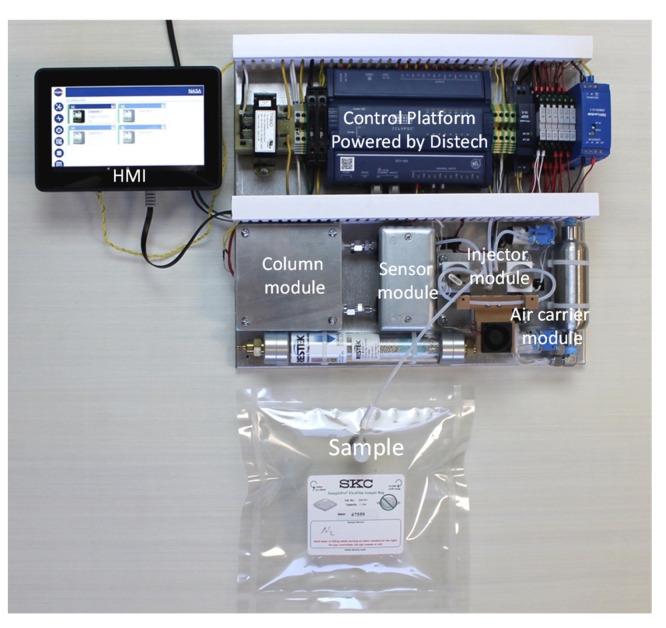
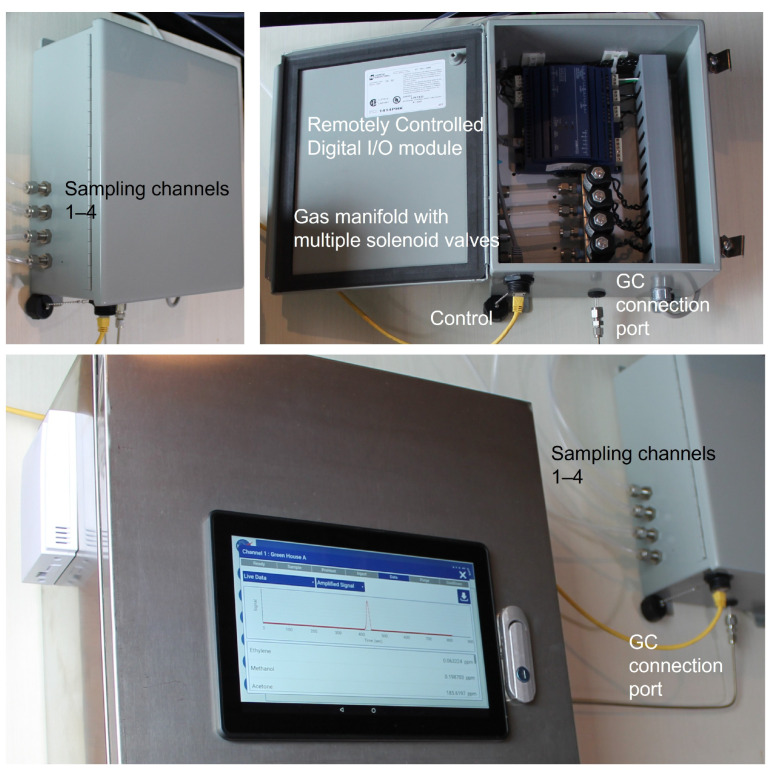
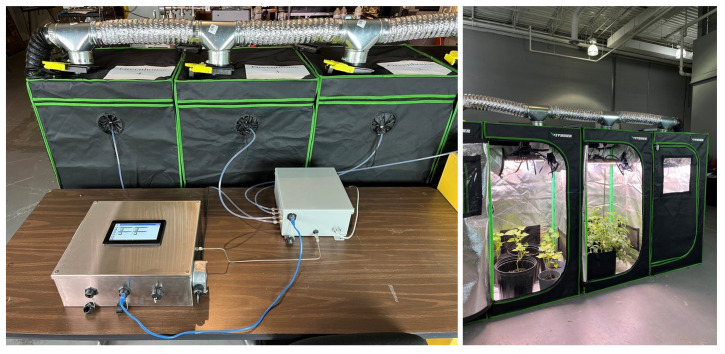
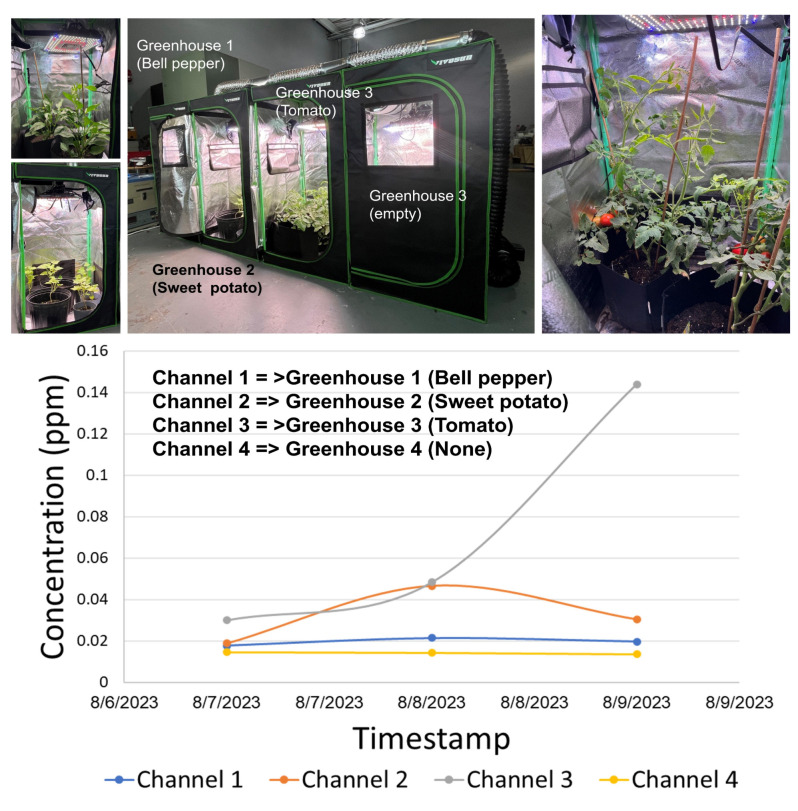
In this work, we discuss the development of a compact analytical instrument for monitoring ethylene in compact greenhouses utilized by NASA to grow fresh vegetables in space. Traditionally, ethylene measurements are conducted by GC-MS systems. However, in space, they are not applicable due to their bulky size, heavy weight, special carrier gas requirement and high maintenance. Our group developed a compact and robust battery-powered ethylene monitor based on the principles of analytical gas chromatography. The device utilizes purified ambient air as a carrier gas and a metal oxide sensor as a GC detector. Implementation of a CarboWax 20 M packed column from Restek together with a Tenax TA pre-concentrator allowed us to achieve a 20 ppb limit of detection for ethylene. Full automation of measurements and reporting of concentrations was accomplished via the implementation of a Raspberry Pi 4 computer and a 7″ 720P LED capacitive touchscreen utilized for data output. Based on a feasibility study, a fully automated, industrial-grade ethylene monitoring and removal system for greenhouses was developed.

Keywords: chemical sensors; ethylene; gas chromatography; volatile organic compounds.


Conflict of interest statement

Authors Alexander Larin and Andrey Livchak were employed by the company Halton Group, and authors Elena Viugina, Jay T. Cremer, Jr. and Charles K. Gary were employed by the company Adelphi Technology LLC. The remaining authors declare that the research was conducted in the absence of any commercial or financial relationships that could be construed as a potential conflict of interest.

Figures

Figure 1
Figure 1
Internal architecture of the VOC analyzer. (A) Carrier gas generation pump, (B) sample pump, (C) detector module, (D) GC column oven assembly, (E) injector module with pre-concentrator and cooling fan, (F) microprocessor control board, (G) internal battery, (H) sample inlet, (I) Raspberry Pi 4 computer, (J) 7″ 720P LED touchscreen.
Figure 2
Figure 2
Assembly of the GC column module: Column is first placed in a metallic oven. Next, a resistive heater cartridge is placed inside the oven via the center opening and secured with thermal adhesive. Then, the oven is placed inside the polystyrene foam thermostat.
Figure 3
Figure 3
Pre-concentrator assembly: (ac) Soldering of inside and outside pads of two positive temperature coefficient (PTC) resistors with red and black wires, respectively. (d) Soldering 12″ segment of red and black wire to the inside and outside pads of PTC resistors, respectively. (e) Thermal epoxy applied to the inner sides of PTC heaters and to the middle of 1/8″ stainless steel tubing. (f,g) Assembly of pre-concentrator using silicone tubing and Teflon tubing. (h,i) Filling the pre-concentrator with sorbent material. (j) Assembly complete.
Figure 4
Figure 4
The side (a) and the top (b) view of the injector module: three-way solenoid valves with the stainless steel manifold.
Figure 5
Figure 5
Operating cycle of the analyzer: (a) turning on, (b) sampling, (c) desorption, (d) injection, (e) analysis, (f) purging.
Figure 6
Figure 6
Separation of plant-produced VOCs by the CarboWAX column at 74 °C.
Figure 7
Figure 7
(a) Chromatograms of pure ethylene diluted in synthetic air. (b) Calibration curve: ethylene peak vs. concentration.
Figure 8
Figure 8
(a) LOD concept. Concentration corresponding to lowest detector response (red curve) that can be distinguished from detector noise (blue curve) is the LOD. (b) A segment of the background noise data. (c) Distribution of various noise amplitudes. A total of 99.7% of the noise spikes have amplitudes below 0.0006. (d) Illustration of the potential sensitivity increase by reducing the noise.
Figure 9
Figure 9
Analysis of signal amplification by the Tenax TA pre-concentrator.
Figure 10
Figure 10
Industrial-grade compact Adelphi ethylene/VOC monitor based on a DISTECH controller.
Figure 11
Figure 11
Structural optimization of GC components.
Figure 12
Figure 12
Multichannel gas sampling system for monitoring multiple greenhouses.
Figure 13
Figure 13
Monitoring of four compact greenhouses with a single chromatograph equipped with a multichannel gas sampling system.
Figure 14
Figure 14
Ethylene accumulation in the greenhouses without venting for three consecutive days.

References

    1. Salisbury F.B., Campbell W.F., Carman J.G., Bingham G.E., Bubenheim D.L., Yendler B., Sytchev V., Levinskikh M.A., Ivanova I., Chernova L., et al. Plant growth during the greenhouse II experiment on the Mir orbital station. Adv. Space Res. 2003;31:221–227. doi: 10.1016/S0273-1177(02)00744-5. - DOI - PubMed
    1. Eckart P. Life Support and Biospherics. Herbert Utz Publishers; Munchen, Germany: 1994.
    1. Perino M.A., Lobascio C., Pastor S., Maffei M. Greenhouse: A strategic element to support humans in space; Proceedings of the Seventh ISU Annual International Symposium; Strasbourg, France. 4–7 June 2002.
    1. Wang Z., Fingas M., Yang C., Christensen J.H. Crude Oil and Refined Product Fingerprinting: Principles. In: Morrison R.D., Murphy B.L., editors. Environmental Forensics. Academic Press; Burlington, MA, USA: 2005. pp. 339–407.
    1. Aguado S., Bergeret G., Daniel C., Farrusseng D. Absolute Molecular Sieve Separation of Ethylene/Ethane Mixtures with Silver Zeolite A. J. Am. Chem. Soc. 2012;134:14635–14637. doi: 10.1021/ja305663k. - DOI - PubMed