

Applying Recurrent Neural Networks for Anomaly Detection in Electrocardiogram Sensor Data
- PMID: 38139724
- PMCID: PMC10747899
- DOI: 10.3390/s23249878
Applying Recurrent Neural Networks for Anomaly Detection in Electrocardiogram Sensor Data
Abstract
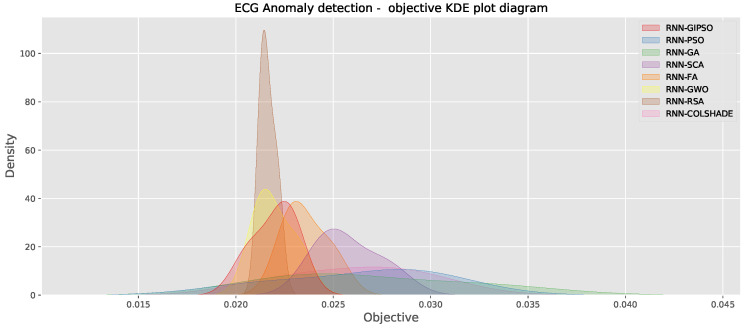
Monitoring heart electrical activity is an effective way of detecting existing and developing conditions. This is usually performed as a non-invasive test using a network of up to 12 sensors (electrodes) on the chest and limbs to create an electrocardiogram (ECG). By visually observing these readings, experienced professionals can make accurate diagnoses and, if needed, request further testing. However, the training and experience needed to make accurate diagnoses are significant. This work explores the potential of recurrent neural networks for anomaly detection in ECG readings. Furthermore, to attain the best possible performance for these networks, training parameters, and network architectures are optimized using a modified version of the well-established particle swarm optimization algorithm. The performance of the optimized models is compared to models created by other contemporary optimizers, and the results show significant potential for real-world applications. Further analyses are carried out on the best-performing models to determine feature importance.
Keywords: diagnosis; electrocardiogram; optimization; particle swarm optimization; recurrent neural networks.
Conflict of interest statement
The authors declare no conflict of interest.
Figures


References
-
- Keeney R.L. Personal decisions are the leading cause of death. Oper. Res. 2008;56:1335–1347. doi: 10.1287/opre.1080.0588. - DOI
-
- Berkaya S.K., Uysal A.K., Gunal E.S., Ergin S., Gunal S., Gulmezoglu M.B. A survey on ECG analysis. Biomed. Signal Process. Control. 2018;43:216–235. doi: 10.1016/j.bspc.2018.03.003. - DOI
-
- Zhang Q., Frick K. All-ECG: A least-number of leads ECG monitor for standard 12-lead ECG Tracking during Motion; Proceedings of the 2019 IEEE Healthcare Innovations and Point of Care Technologies, (HI-POCT); Bethesda, MD, USA. 20–22 November 2019; pp. 103–106.
MeSH terms
Grants and funding
LinkOut - more resources
Full Text Sources
