Role of Pre-Farrow Natural Planned Exposure of Gilts in Shaping the Passive Antibody Response to Rotavirus A in Piglets
- PMID: 38140269
- PMCID: PMC10748143
- DOI: 10.3390/vaccines11121866
Role of Pre-Farrow Natural Planned Exposure of Gilts in Shaping the Passive Antibody Response to Rotavirus A in Piglets
Abstract
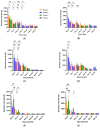
Natural planned exposure (NPE) remains one of the most common methods in swine herds to boost lactogenic immunity against rotaviruses. However, the efficacy of NPE protocols in generating lactogenic immunity has not been investigated before. A longitudinal study was conducted to investigate the dynamics of genotype-specific antibody responses to different doses (3, 2 and 1) of Rotavirus A (RVA) NPE (genotypes G4, G5, P[7] and P[23]) in gilts and the transfer of lactogenic immunity to their piglets. Group 1 gilts received three doses of NPE at 5, 4 and 3 weeks pre-farrow (WPF), group 2 received two doses at 5 and 3 WPF, group 3 received one dose at 5 WPF, and group 4 received no NPE (control group). VP7 (G4 and G5) and truncated VP4* (P[7] and P[23]) antigens of RVA were expressed in mammalian and bacterial expression systems, respectively, and used to optimize indirect ELISAs to determine antibody levels against RVA in gilts and piglets. In day-0 colostrum samples, group 1 had significantly higher IgG titers compared to the control group for all four antigens, and either significantly or numerically higher IgG titers than groups 2 and 3. Group 1 also had significantly higher colostrum IgA levels than the control group for all antigens (except G4), and either significantly or numerically higher IgA levels compared to groups 2 and 3. In piglet serum, group 1 piglets had higher IgG titers for all four antigens at day 0 than the other groups. Importantly, RVA NPE stimulated antibodies in all groups regardless of the treatment doses and prevented G4, G5, P[7] and P[23] RVA fecal shedding prior to weaning in piglets in the absence of viral challenge. The G11 and P[34] RVA genotypes detected from pre-weaning piglets differed at multiple amino acid positions with parent NPE strains. In conclusion, the results of this study suggest that the group 1 NPE regimen (three doses of NPE) resulted in the highest anti-RVA antibody (IgG and IgA) levels in the colostrum/milk, and the highest IgG levels in piglet serum.
Keywords: ELISA; antibody; natural planned exposure; rotavirus A; sequencing; swine.
Conflict of interest statement
Author Douglas G. Marthaler is employed by the company Indical Bioscience. The remaining authors declare that the research was conducted in the absence of any commercial or financial relationships that could be construed as a potential conflict of interest.
Figures


Similar articles
-
Antibody Response to Rotavirus C Pre-Farrow Natural Planned Exposure to Gilts and Their Piglets.Viruses. 2022 Oct 14;14(10):2250. doi: 10.3390/v14102250. Viruses. 2022. PMID: 36298806 Free PMC article.
-
Rotavirus A Inoculation and Oral Vitamin A Supplementation of Vitamin A Deficient Pregnant Sows Enhances Maternal Adaptive Immunity and Passive Protection of Piglets against Virulent Rotavirus A.Viruses. 2022 Oct 26;14(11):2354. doi: 10.3390/v14112354. Viruses. 2022. PMID: 36366453 Free PMC article.
-
Passive immunity to porcine epidemic diarrhea virus following immunization of pregnant gilts with a recombinant orf virus vector expressing the spike protein.Arch Virol. 2018 Sep;163(9):2327-2335. doi: 10.1007/s00705-018-3855-1. Epub 2018 May 3. Arch Virol. 2018. PMID: 29725899 Free PMC article.
-
Porcine group A rotaviruses with heterogeneous VP7 and VP4 genotype combinations can be found together with enteric bacteria on Belgian swine farms.Vet Microbiol. 2014 Aug 6;172(1-2):23-34. doi: 10.1016/j.vetmic.2014.04.002. Epub 2014 Apr 13. Vet Microbiol. 2014. PMID: 24837191 Review.
-
Rotavirus Infection in Swine: Genotypic Diversity, Immune Responses, and Role of Gut Microbiome in Rotavirus Immunity.Pathogens. 2022 Sep 22;11(10):1078. doi: 10.3390/pathogens11101078. Pathogens. 2022. PMID: 36297136 Free PMC article. Review.
Cited by
-
Antibody Response to Rotavirus C Pre-Farrow Natural Planned Exposure to Gilts and Their Piglets.Viruses. 2022 Oct 14;14(10):2250. doi: 10.3390/v14102250. Viruses. 2022. PMID: 36298806 Free PMC article.
References
-
- Estes M., Kapikian A. Fields Virology Wolters Kluwer Health. Lippincott, Wilams and Wilkins; Philadelphia, PA, USA: 2021. Rotaviruses; pp. 1917–1975.
-
- Matthijnssens J., Ciarlet M., Heiman E., Arijs I., Delbeke T., McDonald S.M., Palombo E.A., Iturriza-Gómara M., Maes P., Patton J.T., et al. Full genome-based classification of rotaviruses reveals a common origin between human Wa-like and porcine rotavirus strains and human DS-1-like and bovine rotavirus strains. J. Virol. 2008;2:3204–3219. doi: 10.1128/JVI.02257-07. - DOI - PMC - PubMed
-
- Matthijnssens J., Ciarlet M., Rahman M., Attoui H., Bányai K., Estes M.K., Gentsch J.R., Iturriza-Gómara M., Kirkwood C.D., Martella V., et al. Recommendations for the classification of group A rotaviruses using all 11 genomic RNA segments. Arch. Virol. 2008;153:1621–1629. doi: 10.1007/s00705-008-0155-1. - DOI - PMC - PubMed
Grants and funding
LinkOut - more resources
Full Text Sources
Miscellaneous

