

Influenza A, like Omicron SARS-CoV-2, Is Similarly Detected in Saliva or Nasopharyngeal Samples via RT-qPCR
- PMID: 38140593
- PMCID: PMC10747790
- DOI: 10.3390/v15122352
Influenza A, like Omicron SARS-CoV-2, Is Similarly Detected in Saliva or Nasopharyngeal Samples via RT-qPCR
Abstract
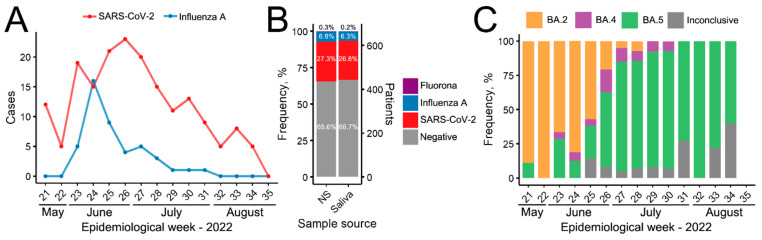
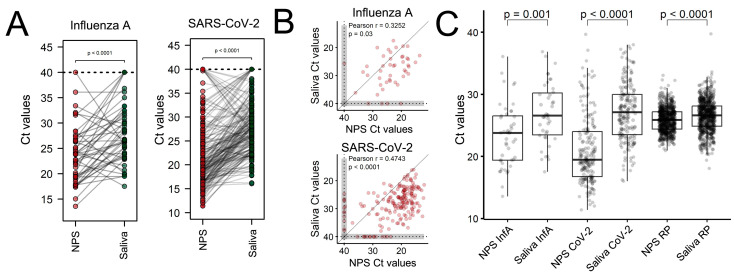
After the Coronavirus pandemic, the importance of virus surveillance was highlighted, reinforcing the constant necessity of discussing and updating the methods for collection and diagnoses, including for other respiratory viruses. Although the nasopharyngeal swab is the gold-standard sample for detecting and genotyping SARS-CoV-2 and Influenza viruses, its collection is uncomfortable and requires specialized teams, which can be costly. During the pandemic, non-invasive saliva samples proved to be a suitable alternative for SARS-CoV-2 diagnosis, but for Influenza virus the use of this sample source is not recognized yet. In addition, most SARS-CoV-2 comparisons were conducted before the Omicron variant emerged. Here, we aimed to compare Influenza A and Omicron RT-qPCR analysis of nasopharyngeal swabs and saliva self-collection in paired samples from 663 individuals. We found that both nasopharyngeal swab and saliva collection are efficient for the diagnosis of Omicron (including sub-lineages) and for Influenza A, with high sensitivity and accuracy (>90%). The kappa index is 0.938 for Influenza A and 0.905 for SARS-CoV-2. These results showed excellent agreement between the two samples reinforcing saliva samples as a reliable source for detecting Omicron and highlighting saliva as a valid sample source for Influenza detection, considering this cheaper and more comfortable alternative.
Keywords: COVID-19; diagnostic techniques and procedures; flu; surveillance; virus detection.
Conflict of interest statement
The authors declare no conflict of interest. The funders had no role in the design of the study; in the collection, analyses, or interpretation of data; in the writing of the manuscript; or in the decision to publish the results.
Figures
Similar articles
-
Highly sensitive extraction-free saliva-based molecular assay for rapid diagnosis of SARS-CoV-2.J Clin Microbiol. 2024 Jun 12;62(6):e0060024. doi: 10.1128/jcm.00600-24. Epub 2024 May 24. J Clin Microbiol. 2024. PMID: 38785448 Free PMC article.
-
Diagnostic Performance of Self-Collected Saliva Versus Nasopharyngeal Swab for the Molecular Detection of SARS-CoV-2 in the Clinical Setting.Microbiol Spectr. 2021 Dec 22;9(3):e0046821. doi: 10.1128/Spectrum.00468-21. Epub 2021 Nov 3. Microbiol Spectr. 2021. PMID: 34730436 Free PMC article.
-
Comparison of Nasopharyngeal and Saliva Swab Nucleic Acid Amplification and Rapid Antigen Testing To Detect Omicron SARS-CoV-2 Variant of Concern: a Prospective Clinical Trial (OMICRON).Microbiol Spectr. 2022 Dec 21;10(6):e0392322. doi: 10.1128/spectrum.03923-22. Epub 2022 Nov 8. Microbiol Spectr. 2022. PMID: 36346225 Free PMC article.
-
The Sensitivity and Costs of Testing for SARS-CoV-2 Infection With Saliva Versus Nasopharyngeal Swabs : A Systematic Review and Meta-analysis.Ann Intern Med. 2021 Apr;174(4):501-510. doi: 10.7326/M20-6569. Epub 2021 Jan 12. Ann Intern Med. 2021. PMID: 33428446 Free PMC article.
-
Diagnostic performance of different sampling approaches for SARS-CoV-2 RT-PCR testing: a systematic review and meta-analysis.Lancet Infect Dis. 2021 Sep;21(9):1233-1245. doi: 10.1016/S1473-3099(21)00146-8. Epub 2021 Apr 12. Lancet Infect Dis. 2021. PMID: 33857405 Free PMC article.
References
-
- Savela E.S., Winnett A.V., Romano A.E., Porter M.K., Shelby N., Akana R., Ji J., Cooper M.M., Schlenker N.W., Reyes J.A., et al. Quantitative SARS-CoV-2 viral-load curves in paired saliva and nasal swabs inform appropriate respiratory sampling site and analytical test sensitivity required for earliest viral detection. J. Clin. Microbiol. 2022;60:e01785-21. doi: 10.1128/jcm.01785-21. - DOI - PMC - PubMed
-
- Genelhoud G., Adamoski D., Spalanzani R.N., Bochnia-Bueno L., de Oliveira J.C., Gradia D.F., Bonatto A.C., Wassem R., Raboni S.M., Nogueira M.B., et al. Comparison of SARS-CoV-2 molecular detection in nasopharyngeal swab, saliva, and gargle samples. Diagn. Microbiol. Infect. Dis. 2022;103:115678. doi: 10.1016/j.diagmicrobio.2022.115678. - DOI - PMC - PubMed
MeSH terms
Supplementary concepts
Grants and funding
LinkOut - more resources
Full Text Sources
Medical
Miscellaneous
