. 2024 Mar 6;112(5):772-785.e9.
doi: 10.1016/j.neuron.2023.11.024. Epub 2023 Dec 22.

Restoration of a paraventricular thalamo-accumbal behavioral suppression circuit prevents reinstatement of heroin seeking

Affiliations

Restoration of a paraventricular thalamo-accumbal behavioral suppression circuit prevents reinstatement of heroin seeking

Jacqueline E Paniccia et al. Neuron. .

Abstract

Lack of behavioral suppression typifies substance use disorders, yet the neural circuit underpinnings of drug-induced behavioral disinhibition remain unclear. Here, we employ deep-brain two-photon calcium imaging in heroin self-administering mice, longitudinally tracking adaptations within a paraventricular thalamus to nucleus accumbens behavioral inhibition circuit from the onset of heroin use to reinstatement. We find that select thalamo-accumbal neuronal ensembles become profoundly hypoactive across the development of heroin seeking and use. Electrophysiological experiments further reveal persistent adaptations at thalamo-accumbal parvalbumin interneuronal synapses, whereas functional rescue of these synapses prevents multiple triggers from initiating reinstatement of heroin seeking. Finally, we find an enrichment of μ-opioid receptors in output- and cell-type-specific paraventricular thalamic neurons, which provide a mechanism for heroin-induced synaptic plasticity and behavioral disinhibition. These findings reveal key circuit adaptations that underlie behavioral disinhibition in opioid dependence and further suggest that recovery of this system would reduce relapse susceptibility.

Keywords: addiction; behavioral disinhibition; multiphoton calcium imaging; opioid use disorder; paraventricular thalamus; parvalbumin interneurons.


Conflict of interest statement

Declaration of interests The authors have no competing interests to declare.

Figures

Figure 1.
Figure 1.. Inhibitory PVT→NAc neuronal ensemble dynamics predict heroin self-administration.
A,B, Apparatus design (A) and behavioral schematic (B) for intravenous heroin self-administration in head-fixed mice. C, Grouped data for acquisition of heroin self-administration. Mice learn to press the active, but not inactive, lever for heroin (n=27 mice; lever: F1,52=122.30, P<0.001). D, Surgical strategy allowed two-photon calcium imaging of PVT→NAc neurons in heroin self-administering mice. (E) Example field of view (FOV; top) and extracted signals (bottom) from a two-photon calcium imaging session. F,G, Example waveforms (F) and grouped data (G) depict reductions in PVT→NAc GCaMP6m-mediated fluorescence from the start (first 3-minutes) to the end (last 3-minutes) of each session during early (days 1–2), middle (days 7–8), and late (days 13–14) acquisition, but not during baseline (No-SA) sessions (session length dependent on infusion cap, to normalize we analyzed the first and last 3-minutes; n=3–7 mice; 105–355 neurons/session; interaction: F3,2194=12.85, P<0.001). H-J, Averaged traces (top) and single-cell heatmaps (bottom) reveal PVT→NAc neuronal encoding of active lever pressing behavior during early (H; n=312 cells; 7 mice), middle (I; n=329 cells; 7 mice), and late (J; n=355 cells; 7 mice) self-administration sessions. K, Spectral clustering revealed three emergent PVT→NAc neuronal ensembles during heroin self-administration: excitatory responders (n=113 cells), somewhat-inhibited responders (n=119 cells), and greatly inhibited responders (n=123 cells). L, Decoding analyses show each neuronal ensemble predicts active lever pressing, with ensemble 3 having the most accuracy (interaction: F2,704=17.21, P<0.001). Red line indicates the average of shuffled data. M, Example FOVs for PVT→NAc neurons tracked across heroin self-administration (n=6 mice, 66 neurons). N,O, Correlation plots showing mean responses between early vs. late (N; P=0.11) and middle vs. late (O; P<0.01) sessions for all tracked neurons (Pearson-R value displayed in graph). P, auROC z-scores for each ensemble reveal ensemble 3, but not 1 or 2, developed new inhibitory responses across acquisition (interaction: F2,189=5.09, P<0.001, ensemble 3 post-hoc: P<0.01). Q, Pie charts for each ensemble show a larger proportion of tracked neurons with significant responses in ensemble 3 during late self-administration (ensemble 3: χ22 =19.2, P<0.001). See also Figure S1. auROC, area under the receiver operating characteristic; CDF, cumulative distribution frequency; FOV, field of view; Mid, Middle; SA, self-administration; Rein, reinstatement. Group comparisons: *P<0.05, **P<0.01, ****P<0.001.
Figure 2.
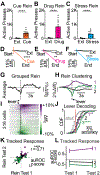
Figure 2.. PVT→NAc neuronal ensemble dynamics stably predict reinstatement of heroin seeking regardless of trigger modality.
A-C, Cue- (A), drug- (B), and stress-induced (C) reinstatement tests wherein active lever pressing increased versus previous extinction tests (n=12–13 mice/test; Cue: t12=7.66, P<0.001; Drug: t11=5.04, P<0.001; Stress (yohimbine): t11=5.38, P<0.001). D-F, Grouped data reveal that PVT→NAc GCaMP6m-mediated fluorescence was significantly reduced from the start to end of cue- (D), drug- (E), and stress- (F) induced reinstatement sessions, versus the last day of extinction (averages of first and last 3-minutes of each session; n=84–125 cells, 4–6 mice/session; interaction F3,840=58.80, P<0.001). G,I, Averaged trace (G) and single-cell heatmap (I) revealing grouped data for PVT→NAc neuronal responses across all three reinstatement sessions (n=4–6 mice/session, 316 neurons). H, Spectral clustering reveals three emergent PVT→NAc neuronal ensembles during reinstatement sessions: excitatory responders (n=106 cells), mildly inhibited responders (n=129 cells), and greatly inhibited responders (n=81 cells). J, Decoding analyses show each neuronal ensemble predicts an active lever press, with ensembles 1 and 3 having the most accurate decoding (interaction: F2,626=7.84, P<0.001). Red line indicates the average of shuffled data. K, Scatter plots for all reinstatement tests showing correlated mean responses for neurons tracked between tests (see Fig. S2 for each test; n= 20–38 cells; 3–4 mice/group; Pearson-R value on graph; P<0.001). L, auROC z-scores for each ensemble tracked across two reinstatement tests confirm stable responses (F-values<0.57, Ps>0.56). See also Figure S2. Ext, extinction; Rein, reinstatement. Group comparisons: **P<0.01, ****P<0.001.
Figure 3.
Figure 3.. PVT→NAc neuronal activation does not prevent heroin seeking.
A,B, Surgical strategy (A) and example viral expression (B) for optogenetic manipulation of PVT→NAc neurons during heroin self-administration. C-E, In heroin-experienced mice, neither optogenetic activation nor inhibition of PVT→NAc neurons prevented cue- (D), drug- (E), or stress-induced (F) reinstatement (n=7–8 mice/group; Cue, day: F1,19=37.39, P<0.001; group comparisons: eYFP: P<0.05, eNpHR: P<0.01, ChR2: P<0.01; Drug, day: F1,19=59.52, P<0.001, group comparisons: eYFP: P<0.001, eNpHR: P<0.001, ChR2: P<0.01; Stress (yohimbine), day: F1,19=29.40, P<0.001, group comparisons: eYFP: P<0.05, eNpHR: P<0.05, ChR2: P<0.01). See also Figure S3. Ext, extinction; Opto, optogenetic manipulation (represented by yellow bars); Rein, reinstatement. Group comparisons: *P<0.05, **P<0.01, ****P<0.001.
Figure 4.
Figure 4.. PVT synaptic innervation of NAc PV-INs is weakened following heroin self-administration and extinction.
A,B, Surgical strategy (A) and experimental timeline (B) for patch-clamp electrophysiology. C, Example DIC images (left), fluorescence expression (middle), and action potential traces (right) for identification of NAc cell types. D, Example oeEPSC waveforms (left) and grouped data (right) show no oeEPSC amplitude changes in NAc D1-MSNs following heroin self-administration or extinction (n=18–21 cells; 8–9 mice/group; F2,54=0.461, P=0.633). E, Example oeEPSC waveforms (left) and grouped data (right) show elevated oeEPSC amplitudes in NAc D2-MSNs following heroin self-administration, but not extinction (n=19–27 cells; 8–11 mice/group; F2,64=7.53, P=0.001, group comparisons: D2 control vs D2 heroin: P<0.001, D2 control vs D2 heroin ext: P=0.292). F, Example oeEPSC waveforms (left) and grouped data (right) reveal persistent, decreased oeEPSC amplitudes in NAc PV-INs following heroin self-administration and extinction (n=20–24 cells; 5–9 mice/group; F2,62=13.53, P<0.001, group comparisons: PV control vs PV heroin: P<0.001, PV control vs PV heroin ext: P<0.001). G, Example AMPAr and NMDAr currents (left) and grouped data (right) for D1-MSNs reveal no change in AMPAr/NMDAr ratio (n=11 cells; 5–6 mice/group; F2,30=0.714, P=0.498). H, Example AMPAr and NMDAr currents (left) and grouped data (right) for D2-MSNs reveal a trending, transient change in AMPAr/NMDAr ratio (n=10–11 cells; 5 mice/group; F2,29=2.98, P=0.066, group comparisons: D2 control vs D2 heroin: P<0.05, D2 control vs D2 heroin ext: P=0.716). I, Example AMPAr and NMDAr currents (left) and grouped data (right) reveal no change in PV-IN AMPAr/NMDAr ratio following heroin self-administration but exhibit a significant decrease following extinction (n=11–17 cells; 5–8 mice/group; F2,42=6.12, P<0.01, group comparisons: PV control vs PV heroin: P=0.063, PV control vs PV heroin ext: P<0.01). J, Example AMPAr rectification waveforms (left) and grouped data (right) show significantly increased rectification in D1-MSNs following heroin self-administration plus extinction, but not self-administration alone (I-70/I+50; n=11–12 cells; 5–6 mice/group; F2,31=4.12; P<0.05, group comparisons: D1 control vs D1 heroin: P=0.992, D1 control vs D1 heroin ext: P<0.05). K, Example AMPAr rectification waveforms (left) and grouped data (right) show no significant changes in rectification in D2-MSNs following heroin self-administration or extinction (n=10–11 cells; 5 mice/group; F2,29=2.48; P=0.101). L, Example AMPAr rectification waveforms (left) and grouped data (right) reveal no significant changes in rectification index in PV-INs following heroin self-administration or extinction (n=13–18 cells; 5–7 mice/group; F2,43=0.054; P=0.948). See also Figure S4. Acq, acquisition; ChR, ChrimsonR; DIC, diffusion interference contrast; Ext, extinction; Habit, habituation; oeEPSC, optically evoked excitatory postsynaptic current. Group comparisons: *P<0.05, **P<0.01, ****P<0.001; ns, not significant.
Figure 5.
Figure 5.. Rescuing activity in the PVT→NAcPV-IN circuit prevents reinstatement of heroin seeking.
A, Surgical strategy for chemogenetic activation of NAc PV-INs. B, Electrophysiological recordings confirmed CNO wash-on increased NAc PV-IN neuronal activity. C-E, Chemogenetic activation of PV-INs through intra-NAc CNO infusions did not prevent cue- (C), drug- (D), or stress-induced (E) reinstatement (n=6–8 mice/group; Cue, day: F1,14=37.98, P<0.001; Drug, day: F1,11=14.39, P<0.01; Stress, day: F1,12=14.37, P<0.01). F,G, Surgical strategy (F) and example viral expression (G) for simultaneous optogenetic stimulation of PVT→NAc neurons and chemogenetic activation of PV-INs. H-J, Optogenetic activation of PVT→NAc neurons combined with chemogenetic activation of PV-INs prevented cue- (H), drug- (I), and stress-induced (J) reinstatement in PV-Cre, but not WT, mice (n=6–8 mice/group; Cue, interaction: F1,14=13.86, P<0.01, Ext: P>0.999, Rein: P<0.001; Drug: interaction: F1,12=8.90, P<0.05, Ext: P=0.998, Rein: P<0.001; Stress: interaction: F1,11=11.31, P<0.01, Ext: P=0.986, Rein: P<0.001. See also Figure S5. WT, wild-type; Ext, extinction; Rein, reinstatement; Opto, optogenetic manipulation (represented by yellow bars). Group comparisons: ****P<0.001; ns, not significant.
Figure 6.
Figure 6.. Quantification of circuit- and cell type-specific expression of Oprm1 in posterior PVT.
A, Surgical strategy for Red Retrobead experiments. B, Representative heatmap of NAc Retrobead placement. C, Percentage of Retrobead-positive neurons detected in PVT, i.e., percentage of PVT→NAc projection neurons, independent of gene expression profiles (n=6 mice, 10–11 optical datasets/RNAscope® staining batch: e.g., Oprm1 + Col12a1, Oprm1 + Drd3, Oprm1 + Drd2 or Oprm1 + Esr1). D, Representative 10x confocal z-stack of PVT Retrobead fluorescence (red) and Oprm1 gene expression (green). Inserts (right) illustrate high colocalization of Oprm1 in Retrobead-positive PVT→NAc neurons. E, Percentage of Oprm1-positive Retrobead-positive (+) or -negative (−) cells detected in PVT. (n=6 mice, 10–11 optical datasets per RNAscope® batch: Oprm1 + Col12a1, Drd3, Drd2 or Esr1). F, Correlation of PVT→NAc Retrobead and PVT Oprm1 3D volume. Expression of PVT Oprm1 was significantly correlated with density of Retrobead signal in PVT→NAc neurons (n=6 mice, 30–80 cells/optical dataset; Pearson-R value displayed on graph; P<0.001). G, Representative 10x confocal z-stacks of Oprm1 fluorescent signal (green) and Drd2, Drd3, Col12a1, or Esr1 fluorescence (blue). Inserts (right) depict colocalization of PVT Oprm1 fluorescence with expression of each of the four genes. H, Cell type-specific expression of Oprm1 signal volume in Drd2-, Col12a1-, Drd3-, and Esr1-positive PVT cells. Oprm1 expression is highest in Drd2-positive cells, followed by Col12a1-positive cells (Kruskal-Wallis H3,2354=352.9, P<0.001, group comparisons shown on graph). I, Representative images of Retrobead-positive (top rows) or Retrobead-negative (bottom rows) defined cells (dashed circles), expressing Oprm1 and Drd2, Drd3, Col12a1 or Esr1. Scale bar represents 10 μm. J, Levels of Oprm1 volume were significantly higher in Retrobead-positive versus Retrobead-negative Drd2-positive neurons, but not Drd3-, Col12a1-, and Esr1-expressing neurons (interaction: F3,2303=7.438, P<0.001, group comparisons: Drd2: P<0.001; Col12a1: P=0.554; Drd3: P=0.066; Esr1: P=0.606). See also Figure S6. Group comparisons **** P<0.001; ns, not significant.
Figure 7.
Figure 7.. PVT μ-ORs knockout attenuates heroin-induced synaptic alterations and enables PVT→NAc-dependent suppression of motivated behavior in heroin-experienced mice.
A, Example confocal images depicting Oprm1 (blue) and Oprk1 (red) gene expression in eYFP-expressing PVT→NAc neurons (green). Data reveal selective μ-OR knockout in PVT of Oprm1fl/fl, but not wild-type control, mice. B, Example waveforms (left) and grouped data (right) of PVT somatic recordings in Oprm1fl/fl mice before and after application of μ-OR agonist DAMGO for control (top) and μ-OR KO (bottom) mice. DAMGO significantly reduced spiking in control but not μ-OR KO neurons (n=7–17 cells; 5–9 mice/group; F1,22=42.27, P<0.001, group comparisons: Control heroin P<0.001; μ-OR KO: P=0.724). C, Surgical strategy for electrophysiology experiments. D, Example oeEPSC waveforms (left) and grouped data (right) for PV-INs confirmed significant decreases in oeEPSC amplitude following heroin self-administration and extinction, an effect that was blocked by PVT μ-OR knockout (n=10–17 cells; 5–6 mice/group; F2,37=4.61, P<0.05, group comparisons: Control saline vs Control heroin: P<0.05, Control saline vs μ-OR KO heroin: P=0.989). E, Example waveforms (left) and grouped data (right) confirmed significant decreases in AMPAr/NMDAr ratios following heroin self-administration and extinction, an effect that was blocked by PVT μ-OR knockout (n=10–17 cells; 5–6 mice/group; F2,37=4.13, P<0.05, group comparisons: Control saline vs Control heroin: P<0.05, Control saline vs μ-OR KO heroin: P=0.922). F, Surgical strategy for behavioral experiments. G, H, In mice with a history of heroin self-administration and extinction, knockout of PVT μ-ORs enabled optogenetic activation of PVT→NAc neurons to suppress active lever pressing in both cue- (G) and heroin-primed (H) reinstatement tests relative to control heroin mice (n=5–7 mice/group; Cue Rein: interaction: F1,10=8.17, P<0.05, group comparisons: Ext: P>0.999, Rein: P<0.01; Drug Rein: interaction: F1,9=14.87, P<0.01, group comparisons: Ext: P=0.994, Rein: P<0.001). I, In mice with a history of heroin self-administration or saline control sessions, there were no significant differences in active lever pressing for sucrose during the laser off test. Optogenetic activation of PVT→NAc neurons significantly reduced active lever presses for sucrose in control saline mice compared to the control heroin group. Knockout of thalamic μ-ORs in heroin-experienced mice enabled PVT→NAc photoactivation to suppress active lever pressing for sucrose to levels comparable to control saline mice (interaction: F2,15=5.00, P<0.05; group comparisons: Laser Off: Control saline vs Control heroin: P=0.904, Control saline vs μ-OR KO heroin: P=0.918; Laser On: Control saline vs Control heroin: P<0.01, Control saline vs μ-OR KO heroin: P=0.944). See also Figure S7. Base, baseline; KO, knockout; Ext, extinction; Opto, optogenetic manipulation (represented by yellow bars); OR, opioid receptor; Rein, reinstatement. Group comparisons *P<0.05, **P<0.01, ****P<0.001; ns, not significant.

References

    1. Chen BT, Yau H-J, Hatch C, Kusumoto-Yoshida I, Cho SL, Hopf FW, and Bonci A (2013). Rescuing cocaine-induced prefrontal cortex hypoactivity prevents compulsive cocaine seeking. Nature 496, 359–362. 10.1038/nature12024. - DOI - PubMed
    1. Kalivas PW, and Volkow ND (2005). The Neural Basis of Addiction: A Pathology of Motivation and Choice. Am. J. Psychiatry 162, 1403–1413. 10.1176/appi.ajp.162.8.1403. - DOI - PubMed
    1. Koob GF, and Le Moal M (2008). Addiction and the Brain Antireward System. Annu. Rev. Psychol 59, 29–53. 10.1146/annurev.psych.59.103006.093548. - DOI - PubMed
    1. Webster LR (2017). Risk Factors for Opioid-Use Disorder and Overdose. Anesth. Analg 125. - PubMed
    1. Zilverstand A, Huang AS, Alia-Klein N, and Goldstein RZ (2018). Neuroimaging Impaired Response Inhibition and Salience Attribution in Human Drug Addiction: A Systematic Review. Neuron 98, 886–903. 10.1016/j.neuron.2018.03.048. - DOI - PMC - PubMed