. 2024 Nov:65:73-87.
doi: 10.1016/j.jare.2023.12.013. Epub 2023 Dec 21.

Targeting acid ceramidase enhances antitumor immune response in colorectal cancer

Affiliations

Targeting acid ceramidase enhances antitumor immune response in colorectal cancer

Yadu Vijayan et al. J Adv Res. 2024 Nov.

Abstract

Introduction: Acid ceramidase (hereafter referred as ASAH1) is an enzyme in sphingolipid metabolism that converts pro-survival ceramide into sphingosine. ASAH1 has been shown to be overexpressed in certain cancers. However, the role of ASAH1 in colorectal cancer still remain elusive.

Objective: The present study is aimed to understand how ASAH1 regulates colorectal cancer (CRC) progression and resistance to checkpoint inhibitor therapy.

Methods: Both pharmacological and genetic silencing of ASAH1 was used in the study. In vitro experiments were done on human and mouse CRC cell lines. The in vivo studies were conducted in NOD-SCID and BALB/c mice models. The combination of ASAH1 inhibitor and checkpoint inhibitor was tested using a syngeneic tumor model of CRC. Transcriptomic and metabolomic analyses were done to understand the effect of ASAH1 silencing.

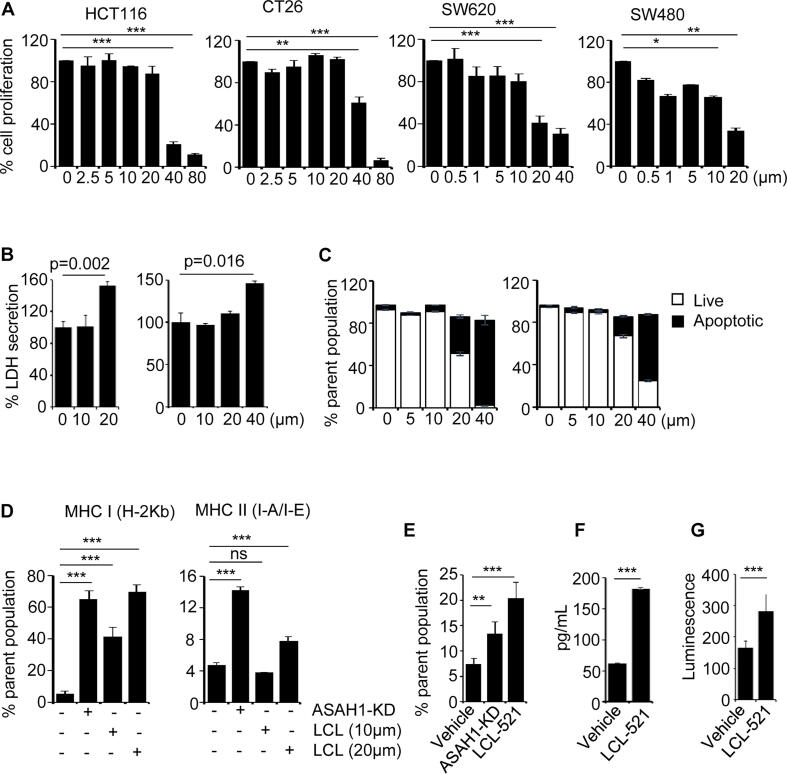
Results: ASAH1 is overexpressed in human CRC cases, and silencing the expression resulted in the induction of immunological cell death (ICD) and mitochondrial stress. The ASAH1 inhibitor (LCL-521), either as monotherapy or in combination with an anti-PD-1 antibody, resulted in reduction of tumors and, through induction of type I and II interferon response, activation of M1 macrophages and T cells, leading to enhanced infiltration of cytotoxic T cells. Our findings supported that the combination of LCL-521 and ICIs, which enhances the antitumor responses, and ASAH1 can be a druggable target in CRC.

Keywords: Acid ceramidase; Checkpoint inhibitor; Colorectal cancer; Immunological cell death; LCL-521; T cells.


Conflict of interest statement

Declaration of competing interest The authors declare that they have no known competing financial interests or personal relationships that could have appeared to influence the work reported in this paper.

Figures

None
Graphical abstract
Fig. 1
Fig. 1
ASAH1 is overexpressed in colorectal cancer. A: Representative images from immunohistochemistry analysis for ASAH1 in human colorectal cancer tissue microarray 20X magnification. B: IHC score and ASAH1 percentage expression in human colorectal cancer tissue microarray C: ASAH1 gene expression analysis in colorectal adenocarcinoma (COAD) using Gene Expression Profiling Interactive Analysis (GEPIA) based on the TCGA and GTEx database. Each box plot represents the gene expression level in terms of log2 (TPM + 1) in the tumor (red, n = 275) and normal (blue, n = 349) samples, respectively. Normal tissues were matched TCGA adjacent tissue and GTEx data. p value cutoff = 0.01. D: ASAH1 mRNA levels (fold change, left panel) and immunohistochemical analysis of ASAH1 (right panel) in colon samples from untreated, colitis models, azoxymethane induced colon cancer, and azoxymethane induced DSS promoted colitis-associated cancer models. Chi-squared tests examine the association between ASAH1 expression and clinical parameters. All reported p-values are two-sided and significance level was set at < 0.05 (for A). Statistical significance was calculated using ANOVA ***p < 0.001. (For interpretation of the references to color in this figure legend, the reader is referred to the web version of this article.)
Fig. 2
Fig. 2
Pharmacological or genetic silencing of ASAH1 inhibited colorectal cancer in syngeneic mouse models and not in immunodeficient mouse strains. A-C: NOD-SCID mice were injected with HCT116 (A) or CT26 (B), and BALB/c were injected with CT26 (C) (vector or ASAH1-KD cells), and one group of vector transfected cells injected group was treated with LCL-521. After sacrifice, tumor volume (left panel) and final tumor weight (right panel) were measured. Data expressed as mean ± S.D D: Representative images from hematoxylin-eosin stained sections and immunohistochemistry analysis for PCNA and Cyclin D1. E: Flow cytometric analysis of the indicated cell populations from tumor samples obtained from different treatment groups. Data expressed as mean ± S.D. Statistical significance was calculated using t-test **p < 0.005, ***p < 0.001.
Fig. 3
Fig. 3
Silencing of ASAH1 induces immunological cell death and MHC activation in colorectal cancer cell lines. A: Different mouse and human CRC cell lines were treated with LCL-521, and cytotoxicity was analyzed for 24 hrs. B: The secretion of LDH was measured in cell supernatants after 24 h in CT 26 (left panel) and HCT116 (right panel) cell lines after treatment with LCL-521. C: The cells, after treatment with LCL-521, were stained with Annexin V FITC and PI, and live and apoptotic populations were analyzed using FACS. D: Flowcytometric analysis of MHCI and MHCII positive cell population in CT26 wild type cells treated with indicated doses of LCL-521 for 24 hr, and CT26-ASAH1-KD cells E: The surface level expression of calreticulin was analyzed by flow cytometry in CT26 cell lines and expressed as % of the parent population. F: The secretion of HMBG1 (pg/ml) was assayed in CT26 cell lines by ELISA. G: The release of ATP was assayed using a luminescence based method. Data expressed as mean ± S.D. Statistical significance was calculated using ANOVA *p < 0.05, **p < 0.005, ***p < 0.001.
Fig. 4
Fig. 4
ASAH1 inhibition resulted in mitochondrial stress, a decrease in the glutathione system, and ROS production. A: Metabolomic analysis of CT26 (left panel) and HCT116 (right panel). Heat map of differential metabolites (upregulated and downregulated) identified through metabolomics analysis and metabolic pathway analysis. In the heat map, the row displays metabolite, and the column represents the samples (in triplicate). B-C: Analysis of total GSH and GPx levels in CT26 cell lines (B) and in tumor samples (C) from the BALB/c model. D: The ROS production was assayed using flow cytometry in the presence of LCL-521 or in combination with NAC after 24hr of treatment. E-I: Oxygen Consumption Rate (OCR) measurements were calculated over a period of time (min) using a Seahorse analyzer in the CT26 cell line. E: oxygen consumption rate (OCR), F: basal respiration; G: maximal respiration; H: ATP production; I: spare respiratory capacity, calculated as the difference between maximal and basal OCR. Data expressed as mean ± S.D. Statistical significance was calculated using ANOVA *p < 0.05, **p < 0.005, ***p < 0.001.
Fig. 5
Fig. 5
LCL-521 sensitizes colorectal cancer to PD-1 antibody therapy in syngeneic mouse tumor model. A: BALB/c mice were injected with CT26 and treated with either LCL-521 or PD-1 antibody or in combination. The final tumor volume in mm3 (left panel) and tumor weight in grams (right panel). B: Representative images of H&E-stained sections. Proliferative markers such as c-Myc, PCNA, and Cyclin D1 expression were evaluated using immunohistochemistry. C-F: Single cell suspensions from tumors obtained from the experimental groups were stained with the indicated antibodies and analyzed by flowcytometry. The left panels show a representative contour plot per experimental group. The bar graph on the right panel is the average of 3–4 mice in each group. CD11b levels are shown in C. and CD8 + T cell infiltration in D. The intracellular cytokine staining of cytotoxic T-cell effector molecules IFN-γ (E) and granzyme B (GZB) (F) levels in tumor samples from the experimental groups were analyzed using flowcytometry and expressed in percentage population of CD8 + T cells. Data expressed as mean ± S.D. Statistical significance was calculated using ANOVA *p < 0.05, **p < 0.005, ***p < 0.001.
Fig. 6
Fig. 6
LCL-521 inhibited the expression of MDSCs and Tregs and activates macrophage recruitment and the expression of genes involved in antigen presentation. A-B: MDSCs (A) and Tregs (B) expression were analyzed in tumor samples using flow cytometry. C: The macrophage recruitment was assessed based on the staining with CD11b + F4/80 + markers. D: The expression of genes was analyzed in the tumor samples from the experimental groups by q-RT PCR. GAPDH served as the housekeeping gene. Data expressed as mean ± S.D (A, B, C) and mean ± SEM (D). Statistical significance was calculated using ANOVA *p < 0.05, **p < 0.005, ***p < 0.001.
Fig. 7
Fig. 7
LCL-521 treatment induces type I and II interferon response in the tumor microenvironment. A: Venn diagram and a table summarizing the differentially expressed genes and overlap of significantly differentially expressed genes in different treatment groups. B: The top upregulated functional pathways determined by Gene Ontology analysis in the LCL-521 monotherapy and LCL-521 + PD1 combination groups. C: Heatmap showing expression of type I and II interferon (IFN) response genes, which were significantly upregulated. D: GSEA of IFN α and γ in LCL-521 monotherapy group. E: GSEA of IFN α and γ in LCL-521 + PD-1 combination group (NES, normalized enrichment score; FDR, false discovery rate).

References

    1. Anderson N.M., Simon M.C. The tumor microenvironment. Curr Biol. 2020;30:R921–R925. - PMC - PubMed
    1. Hinshaw D.C., Shevde L.A. The tumor microenvironment innately modulates cancer progression. Cancer Res. 2019;79:4557–4566. - PMC - PubMed
    1. Aldea M., Andre F., Marabelle A., Dogan S., Barlesi F., Soria J.C. Overcoming resistance to tumor-targeted and immune-targeted therapies. Cancer Discov. 2021;11:874–899. - PubMed
    1. Coulie P.G., Van den Eynde B.J., van der Bruggen P., Boon T. Tumour antigens recognized by T lymphocytes: At the core of cancer immunotherapy. Nat Rev Cancer. 2014;14:135–146. - PubMed
    1. Brochier W., Bricard O., Coulie P.G. Facts and hopes in cancer antigens recognized by T cells. Clin Cancer Res. 2023;29:309–315. - PubMed

LinkOut - more resources