Meta-Analysis
. 2024 Mar 8;133(1):17-28.
doi: 10.1093/aob/mcad167.

Temperature sensitivity of detrital photosynthesis

Affiliations
Meta-Analysis

Temperature sensitivity of detrital photosynthesis

Luka Seamus Wright et al. Ann Bot. .

Erratum in

Abstract

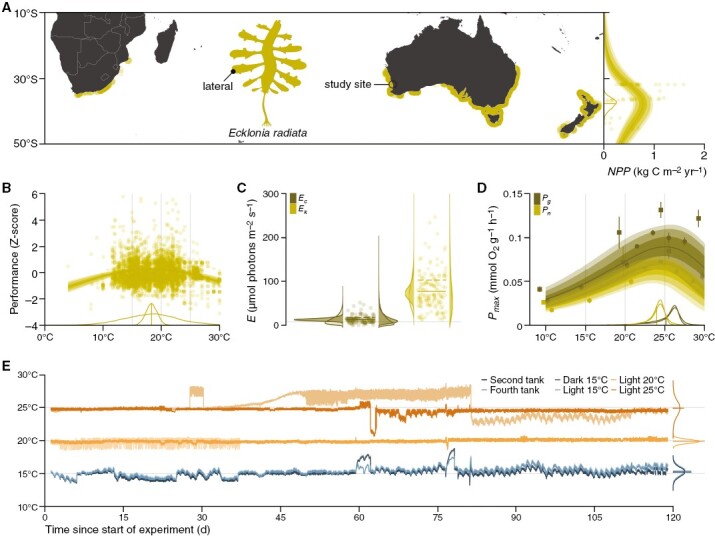
Background and aims: Kelp forests are increasingly considered blue carbon habitats for ocean-based biological carbon dioxide removal, but knowledge gaps remain in our understanding of their carbon cycle. Of particular interest is the remineralization of detritus, which can remain photosynthetically active. Here, we study a widespread, thermotolerant kelp (Ecklonia radiata) to explore detrital photosynthesis as a mechanism underlying temperature and light as two key drivers of remineralization.

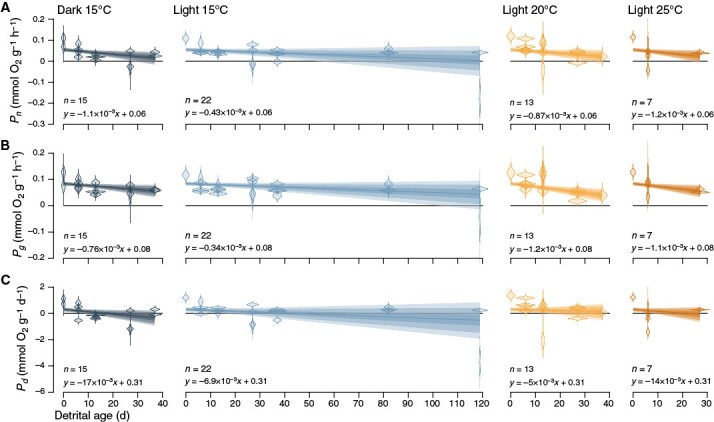
Methods: We used meta-analysis to constrain the thermal optimum (Topt) of E. radiata. Temperature and light were subsequently controlled over a 119-day ex situ decomposition experiment. Flow-through experimental tanks were kept in darkness at 15 °C or under a subcompensating maximal irradiance of 8 µmol photons m-2 s-1 at 15, 20 or 25 °C. Photosynthesis of laterals (analogues to leaves) was estimated using closed-chamber oxygen evolution in darkness and under a saturating irradiance of 420 µmol photons m-2 s-1.

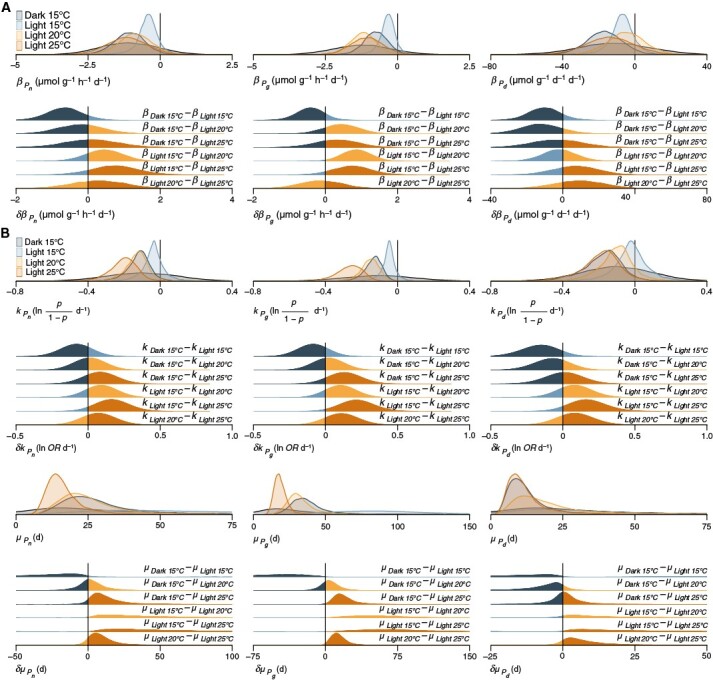
Key results: T opt of E. radiata is 18 °C across performance variables (photosynthesis, growth, abundance, size, mass and fertility), life stages (gametophyte and sporophyte) and populations. Our models predict that a temperature of >15 °C reduces the potential for E. radiata detritus to be photosynthetically viable, hence detrital Topt ≤ 15 °C. Detritus is viable under subcompensating irradiance, where it performs better than in darkness. Comparison of net and gross photosynthesis indicates that elevated temperature primarily decreases detrital photosynthesis, whereas darkness primarily increases detrital respiration compared with optimal experimental conditions, in which detrital photosynthesis can persist for ≥119 days.

Conclusions: T opt of kelp detritus is ≥3 °C colder than that of the intact plant. Given that E. radiata is one of the most temperature-tolerant kelps, this suggests that photosynthesis is generally more thermosensitive in the detrital phase, which partly explains the enhancing effect of temperature on remineralization. In contrast to darkness, even subcompensating irradiance maintains detrital viability, elucidating the accelerating effect of depth and its concomitant light reduction on remineralization to some extent. Detrital photosynthesis is a meaningful mechanism underlying at least two drivers of remineralization, even below the photoenvironment inhabited by the attached alga.

Keywords: Brown algae; CO2; Laminariales; Phaeophyceae; climate change mitigation; detrital dynamics; macroalgae; macroalgal carbon dioxide removal; ocean warming; photoacclimation; photophysiology; temperature tolerance.


Figures

Fig. 1.
Fig. 1.
Experimental treatments in the context of Ecklonia radiata temperature and light tolerance. (A) Geography of the study site, species distribution (GBIF, 2023; OBIS, 2023) and net primary production (Pessarrodona et al., 2022a). The map is oriented north, based on the WGS 84 coordinate reference system and rendered according to the equirectangular projection. Net primary production (NPP) is modelled with the peaked Arrhenius equation (Medlyn et al., 2002; Terada et al., 2016). Lines and intervals are means and 50, 80 and 90 % posterior probability intervals for the mean prediction. The posterior probability distribution of Topt and its mean are plotted below the curve. Note that one data point (36°S, 5.5 kg C m−2 year−1) is excluded from the plot, but not from the model. (B) Temperature response of standardized performance (photosynthesis, growth, abundance, size, mass and fertility) across life stages (gametophyte and sporophyte) and populations (Wright, 2023). Performance is modelled with the Gaussian function. Lines and intervals are means and 50, 80 and 90 % posterior probability intervals for the mean prediction. Posterior probability distributions of Topt and their mean are plotted for the given data (narrow) and predicting the outcome of a new study (wide) and rescaled relative to one another. Note that several data points above a z-score of 6 are excluded from the plot, but not from the model. Vertical grey lines mark experimental treatment targets. (C) Compensation (Ec) and saturation (Ek) points for sporophyte photosynthesis (Fairhead and Cheshire, 2004; Miller et al., 2006; Staehr and Wernberg, 2009; Rodgers et al., 2015; Rodgers and Shears, 2016; Blain and Shears, 2019, 2020; Randall et al., 2019; Blain et al., 2020). Given that irradiance cannot attain negative values, Ec and Ek were modelled using the gamma distribution. Posterior probability distributions of Ec and Ek delimit their means (dark) or full range of observations (light) and predict given data (left) or the outcome of a new study (right). Lines across data points are means for the left (solid) and right (dashed) distributions. The horizontal grey line marks the experimental treatment target. (D) Temperature response of net (Pn) and gross (Pg) light-saturated sporophyte photosynthesis at our study site (A, 31.789367°S, 115.679017°E) stratified by study (■: Staehr and Wernberg, 2009; ● : Wernberg et al., 2016). Photosynthesis is modelled using the peaked Arrhenius equation (Medlyn et al., 2002; Terada et al., 2016). Lines and intervals are means and 50, 80 and 90 % posterior probability intervals for the mean prediction. Posterior probability distributions of Topt and their mean are plotted for the given data (narrow) and predicting the outcome of a new study (wide). Point ranges denote mean ± frequentist standard error of the mean (comparable to Bayesian standard deviation of the posterior probability distribution of the mean). Note that point ranges are x-shifted relative to one another to avoid overplotting. Vertical grey lines mark experimental treatment targets. (E) Experimental temperature in the second and fourth tank of each treatment. Probability distributions across the second and fourth tanks delimit the means (narrow) or full range of observations (wide) and are rescaled relative to one another. Horizontal grey lines mark the temperature treatment target (cf. BD). For details on meta-analyses, see github.com/lukaseamus/detrital-tolerance.
Fig. 2.
Fig. 2.
Probability distributions of relevant model parameters and their pairwise differences between treatments. Posterior probability distributions of βTr + βTa, the slope of each treatment over detrital age including the variability across tanks (A, Supplementary Data Equation S5; B, Supplementary Data Equation S6) are coloured by treatment, and prior probability distributions for βTr are shown in black. In the case of the binomial generalized linear model with a logit link function (Supplementary Data Equation S6), βTr + βTa is termed k, because it corresponds to the logistic rate, i.e. log odds per day. The difference of log odds corresponds to the log odds ratio (OR). Derived prior and posterior quotient probability distributions of the sigmoid inflection point where P = 0.5 ( μ = αk) are also shown in B. For prior and posterior probability distributions of the intercept ɑ (Supplementary Data Equations S5 and S6), see Supplementary Data Figs S5A and S6.
Fig. 3.
Fig. 3.
Effect of light and temperature on maximal (light-saturated) net (A), gross (B) and daily (24-h) net (C) detrital photosynthesis of Ecklonia radiata, given per gram of dry mass. Violins are posterior probability distributions for each of n observations, derived from β, the slope of O2 concentration over incubation time (Supplementary Data Equation S1) via conversion (Supplementary Data Equation S3). They give an indication of the measurement error that was incorporated into the final models as sP, the standard deviation of the posterior distribution of the slope (Supplementary Data Equation S5). Lines and intervals are means and 50, 80 and 90 % posterior probability intervals for µ, the mean prediction in relation to detrital age (Supplementary Data Equation S5). The intervals also incorporate variability between experimental tanks as τ, the standard deviation of the slope of photosynthesis over detrital age across tanks (Supplementary Data Equation S5). This means that given the priors and data, there is a 50, 80 and 90 % probability that the posterior prediction for a new experimental tank lies within the respective interval.
Fig. 4.
Fig. 4.
Effect of light and temperature on the probability of Ecklonia radiata detritus being autotrophic (A), photosynthetically active (B) and autotrophic over a 24-h period (C) under saturating irradiance. Lines and intervals are means and 50, 80 and 90 % posterior probability intervals for µ, the mean prediction in relation to detrital age (Supplementary Data Equation S6). The intervals also incorporate variability between experimental tanks as τ, the standard deviation of the slope of log odds over detrital age across tanks (Supplementary Data Equation S6). This means that given the priors and data, there is a 50, 80 and 90 % probability that the posterior prediction for a new experimental tank lies within the respective interval.

References

    1. Andersen GS, Pedersen MF, Nielsen SL.. 2013. Temperature acclimation and heat tolerance of photosynthesis in Norwegian Saccharina latissima (Laminariales, Phaeophyceae). Journal of Phycology 49: 689–700. - PubMed
    1. Arnosti C. 2011. Microbial extracellular enzymes and the marine carbon cycle. Annual Review of Marine Science 3: 401–425. - PubMed
    1. de Bettignies F, Dauby P, Thomas F, et al. . 2020. Degradation dynamics and processes associated with the accumulation of Laminaria hyperborea (Phaeophyceae) kelp fragments: an in situ experimental approach. Journal of Phycology 56: 1481–1492. - PubMed
    1. Birch PB, Gabrielson JO, Hamel KS.. 1983. Decomposition of Cladophora. I. Field studies in the Peel-Harvey estuarine system, Western Australia. Botanica Marina 26: 165–172.
    1. Blain CO, Shears NT.. 2019. Seasonal and spatial variation in photosynthetic response of the kelp Ecklonia radiata across a turbidity gradient. Photosynthesis Research 140: 21–38. - PubMed

Publication types