. 2024 Mar 28;143(13):1293-1309.
doi: 10.1182/blood.2023021583.

Clearance of VWF by hepatic macrophages is critical for the protective effect of ADAMTS13 in sickle cell anemia mice

Affiliations

Clearance of VWF by hepatic macrophages is critical for the protective effect of ADAMTS13 in sickle cell anemia mice

Huiping Shi et al. Blood. .

Abstract

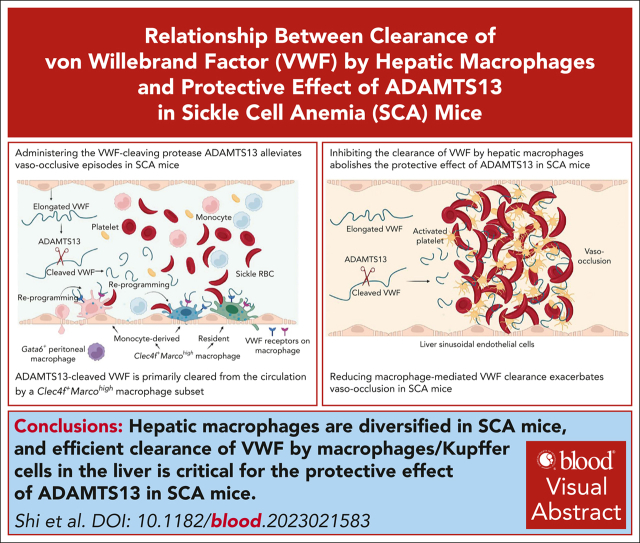
Although it is caused by a single-nucleotide mutation in the β-globin gene, sickle cell anemia (SCA) is a systemic disease with complex, incompletely elucidated pathologies. The mononuclear phagocyte system plays critical roles in SCA pathophysiology. However, how heterogeneous populations of hepatic macrophages contribute to SCA remains unclear. Using a combination of single-cell RNA sequencing and spatial transcriptomics via multiplexed error-robust fluorescence in situ hybridization, we identified distinct macrophage populations with diversified origins and biological functions in SCA mouse liver. We previously found that administering the von Willebrand factor (VWF)-cleaving protease ADAMTS13 alleviated vaso-occlusive episode in mice with SCA. Here, we discovered that the ADAMTS13-cleaved VWF was cleared from the circulation by a Clec4f+Marcohigh macrophage subset in a desialylation-dependent manner in the liver. In addition, sickle erythrocytes were phagocytized predominantly by Clec4f+Marcohigh macrophages. Depletion of macrophages not only abolished the protective effect of ADAMTS13 but exacerbated vaso-occlusive episode in mice with SCA. Furthermore, promoting macrophage-mediated VWF clearance reduced vaso-occlusion in SCA mice. Our study demonstrates that hepatic macrophages are important in the pathogenesis of SCA, and efficient clearance of VWF by hepatic macrophages is critical for the protective effect of ADAMTS13 in SCA mice.


Conflict of interest statement

Conflict-of-interest disclosure: The authors declare no competing financial interests.

The current affiliation for B.S. is Lindsley F. Kimball Research Institute of New York Blood Center, New York, NY.

Figures

None
Graphical abstract
Figure 1.
Figure 1.
Increased inflammatory infiltrates and altered macrophages in the liver of S/S mice. (A) Representative images of hematoxylin and eosin staining and immunofluorescence staining of liver sections from A/A mice, S/S mice, and S/S mice during VOEs. There were increased vaso-occlusion, inflammatory infiltrates, and hepatocyte death in the liver of S/S mice, which were further aggravated during TNF-induced VOE. Histological scores and inflammatory infiltrate quantification are shown on the right. Cryosections were stained with primary antibodies to CD31 (endothelial cell marker) and CD45 (leukocyte common antigen). 4′,6-diamidino-2-phenylindole (DAPI) cell nuclear staining (n = 4 mice per group). Data represent mean ± standard deviation. ∗P < .05; ∗∗∗P < .001; ∗∗∗∗P < .0001, 1-way analysis of variance (ANOVA). (B) Representative confocal microscopic images of liver cryosections of A/A mice, S/S mice, and S/S mice during VOEs. There were increased macrophages in the S/S mouse liver, which were hypertrophied when compared with those in the liver of A/A mice. During VOE, there was an increase of macrophage accumulation around the vessels in the liver of S/S mice, indicating increased infiltration of circulating monocyte-derived macrophages. Macrophage quantification is shown on the right. Cryosections were stained with primary antibody to F4/80 (macrophage marker). DAPI cell nuclear staining (n = 4 mice per group). Data represent mean ± standard deviation. ∗P < .05; ∗∗∗P < .001, 1-way ANOVA. AU, arbitrary unit.
Figure 2.
Figure 2.
scRNA-seq reveals transcriptionally distinct monocyte or macrophage populations in the liver of A/A and S/S mice. (A) Dot plot showing the expression of monocyte or macrophage makers in different cell clusters identified using liver single cells from 4 groups of mice (2-month-old): A/A and S/S mice at baseline (n = 2 mice per genotype), and A/A and S/S mice after TNF challenge (n = 2 mice per genotype). (B) Uniform Manifold Approximation and Projection (UMAP) showing the monocyte and macrophage populations from panel A. (C) Comparison of the monocyte or macrophage numbers between baseline A/A and S/S mice (top), and between baseline S/S and TNF-challenged S/S mice (bottom). (D) UMAP showing a total of 19 cell clusters (0-18) derived from the livers of TNF-challenged 2-month-old A/A (n = 2) and S/S mice (n = 2). (E) Heat map showing the differentially expressed genes across subsets of macrophages in the liver. Seven groups of transcriptionally distinct macrophages were identified in the liver of TNF-challenged A/A and S/S mice. The color key to the right of the heat map indicates the gene expression levels (high-to-low expression corresponding to yellow to cyan). (F) Trajectory analysis of the different macrophage subsets. The differences in cell distribution between TNF-challenged A/A (blue) and S/S (orange) mice are shown in the t-distributed stochastic neighbor embedding (t-SNE) map, and the cell cluster exhibiting the most different transcriptomic profile is circled in red, which corresponds to Kupffer cells (cluster 2). (G) Bubble plots showing functional annotations of the upregulated biological processes (top) and KEGG pathways (bottom) in Kupffer cells from the livers of TNF-challenged S/S mice when compared with those from the livers of TNF-challenged A/A mice. In the bubble plots, the bubble size represents the number of enriched genes whereas the bubble color represents the P-value. Mono/mac, monocytes/macrophages; pMac, peritoneal macrophages.
Figure 2.
Figure 2.
scRNA-seq reveals transcriptionally distinct monocyte or macrophage populations in the liver of A/A and S/S mice. (A) Dot plot showing the expression of monocyte or macrophage makers in different cell clusters identified using liver single cells from 4 groups of mice (2-month-old): A/A and S/S mice at baseline (n = 2 mice per genotype), and A/A and S/S mice after TNF challenge (n = 2 mice per genotype). (B) Uniform Manifold Approximation and Projection (UMAP) showing the monocyte and macrophage populations from panel A. (C) Comparison of the monocyte or macrophage numbers between baseline A/A and S/S mice (top), and between baseline S/S and TNF-challenged S/S mice (bottom). (D) UMAP showing a total of 19 cell clusters (0-18) derived from the livers of TNF-challenged 2-month-old A/A (n = 2) and S/S mice (n = 2). (E) Heat map showing the differentially expressed genes across subsets of macrophages in the liver. Seven groups of transcriptionally distinct macrophages were identified in the liver of TNF-challenged A/A and S/S mice. The color key to the right of the heat map indicates the gene expression levels (high-to-low expression corresponding to yellow to cyan). (F) Trajectory analysis of the different macrophage subsets. The differences in cell distribution between TNF-challenged A/A (blue) and S/S (orange) mice are shown in the t-distributed stochastic neighbor embedding (t-SNE) map, and the cell cluster exhibiting the most different transcriptomic profile is circled in red, which corresponds to Kupffer cells (cluster 2). (G) Bubble plots showing functional annotations of the upregulated biological processes (top) and KEGG pathways (bottom) in Kupffer cells from the livers of TNF-challenged S/S mice when compared with those from the livers of TNF-challenged A/A mice. In the bubble plots, the bubble size represents the number of enriched genes whereas the bubble color represents the P-value. Mono/mac, monocytes/macrophages; pMac, peritoneal macrophages.
Figure 3.
Figure 3.
Macrophage transcriptomic profiling shows enhanced macrophage scavenging activity in the liver of S/S mice. (A) Five macrophage subsets identified by MERFISH of liver tissues from 1.5-month-old A/A and S/S mice at baseline, visualized in UMAP (white-line boxed inset) and liver tissues in situ. Each color represents 1 macrophage subtype. Each dot represents 1 cell. These images show significantly increased monocytes or macrophages in the liver of S/S mouse, with remarkable accumulation around the vessels. (B) Comparisons of hepatic spatial transcriptomic profiles between 1.5-month-old A/A and S/S mice using the 300-general inflammation and thrombosis MERFISH gene panel. Each color and its corresponding RNA species are shown in the gene color key box on the right. Each dot represents 1 RNA molecule. (C) Comparisons of hepatic macrophage transcriptomic profiles between 4 groups of mice, 2-month-old A/A and S/S mice at baseline and 2-month-old A/A and S/S mice after TNF challenge using the 140-monocyte or macrophage MERFISH gene panel. Each color and its corresponding RNA species are shown on the right in the gene color key box. Each dot represents 1 RNA molecule. (D) Quantifications of transcript numbers per cell for Csf1, Marco, Mrc1, and Hmox1 genes between the livers of A/A and S/S mice in (C). Welch 2-sample t test. (E) Three-dimensional (3D) rendering of confocal images showing the clearance of VWF and erythrocytes by macrophages in the liver of A/A and S/S mice. Side views are shown on the right and bottom. DAPI cell nuclear staining (n = 3 mice per group). (F) Quantification of the colocalization of F4/80+ macrophages with VWF (bottom) and erythrocytes (top). These images demonstrate the increased clearance of VWF and erythrocytes by macrophages in the liver of S/S mice. Data represent mean ± standard deviation. ∗∗P < .01; ∗∗∗∗P < .0001, 2-tailed, unpaired Student t test. F4/80, macrophage marker; RBC, red blood cell; Ter119, erythrocyte marker.
Figure 3.
Figure 3.
Macrophage transcriptomic profiling shows enhanced macrophage scavenging activity in the liver of S/S mice. (A) Five macrophage subsets identified by MERFISH of liver tissues from 1.5-month-old A/A and S/S mice at baseline, visualized in UMAP (white-line boxed inset) and liver tissues in situ. Each color represents 1 macrophage subtype. Each dot represents 1 cell. These images show significantly increased monocytes or macrophages in the liver of S/S mouse, with remarkable accumulation around the vessels. (B) Comparisons of hepatic spatial transcriptomic profiles between 1.5-month-old A/A and S/S mice using the 300-general inflammation and thrombosis MERFISH gene panel. Each color and its corresponding RNA species are shown in the gene color key box on the right. Each dot represents 1 RNA molecule. (C) Comparisons of hepatic macrophage transcriptomic profiles between 4 groups of mice, 2-month-old A/A and S/S mice at baseline and 2-month-old A/A and S/S mice after TNF challenge using the 140-monocyte or macrophage MERFISH gene panel. Each color and its corresponding RNA species are shown on the right in the gene color key box. Each dot represents 1 RNA molecule. (D) Quantifications of transcript numbers per cell for Csf1, Marco, Mrc1, and Hmox1 genes between the livers of A/A and S/S mice in (C). Welch 2-sample t test. (E) Three-dimensional (3D) rendering of confocal images showing the clearance of VWF and erythrocytes by macrophages in the liver of A/A and S/S mice. Side views are shown on the right and bottom. DAPI cell nuclear staining (n = 3 mice per group). (F) Quantification of the colocalization of F4/80+ macrophages with VWF (bottom) and erythrocytes (top). These images demonstrate the increased clearance of VWF and erythrocytes by macrophages in the liver of S/S mice. Data represent mean ± standard deviation. ∗∗P < .01; ∗∗∗∗P < .0001, 2-tailed, unpaired Student t test. F4/80, macrophage marker; RBC, red blood cell; Ter119, erythrocyte marker.
Figure 4.
Figure 4.
Clec4f+Marcohigh macrophages are important for erythrocyte clearance. (A) Comparisons of the expression levels of proinflammatory and anti-inflammatory markers in 7 distinct macrophage subsets identified by scRNA-seq of liver cells from TNF-challenged 2-month-old A/A (n = 2) and S/S mice (n = 2). Among them, the Clec4f+ Kupffer cells expressed higher levels of Mrc1 and Marco than of other groups, identifying them as restorative macrophages. (B) Representative transmission electron microscopic images showing increased erythrophagocytosis in hepatic macrophages of S/S mice than those in A/A mice. There were dramatically increased interactions between erythrocytes (red) and macrophages (blue) and phagocytosis of erythrocytes by macrophages in the liver of S/S mice. (C) 3D rendering of confocal images showing the clearance of erythrocytes by macrophages in the liver of A/A and S/S mice. Side views are shown on the left and bottom. The sections were stained with primary antibodies to MARCO (a scavenger receptor), macrophages (F4/80), and erythrocytes (Ter119). There was a dramatic increase of Marcohigh macrophages in the liver of S/S mice and these Marcohigh macrophages showed increased clearance of erythrocytes in the liver of S/S mice. DAPI cell nuclear staining (n = 3 mice per group). (D) Quantification of MARCO fluorescence intensity (left) and the colocalization of MARCO+ macrophages with erythrocytes (right). Data represent mean ± standard deviation. ∗∗∗P < .001; ∗∗∗∗P < .0001, 2-tailed, unpaired Student t test.
Figure 5.
Figure 5.
Macrophages are required for the protective effect of ADAMTS13. (A) Plasma VWF multimeric compositions from 4 groups of S/S mice at basal level and at different time points after VOE induction (1, 2, and 3 hours). Control + saline, S/S mice treated with saline and control liposomes; control + ADAMTS13, S/S mice treated with ADAMTS13 and control liposomes; clodronate + ADAMTS13, S/S mice treated with ADAMTS13 after clodronate-mediated macrophage depletion; and clodronate + saline, S/S mice treated with saline after clodronate-mediated macrophage depletion. Data represent at least 4 independent experiments. HMWM, IMWM, or LMWM represents high, intermediate, or low molecular weight VWF multimers, respectively (denoted by red lines). (B) The percentage of LMWM among total VWF at each time point was quantified based on densitometry. Data represent at least 4 independent experiments. (C) Plasma levels of lactate dehydrogenase (LDH) and aspartate transaminase (AST) at 3 hours after VOE induction in different groups of S/S mice treated as described in panel A. Each dot represents 1 mouse. Data represent mean ± standard deviation. ∗P < .05; ∗∗P < .01; ∗∗∗P < .001, 1-way ANOVA. (D) Representative confocal microscopic images of liver cryosections from different groups of S/S mice. These sections were stained with primary antibodies to VWF, macrophages (F4/80), and erythrocytes (Ter119). DAPI cell nuclear staining. The top panel shows efficient depletion of F4/80-positive macrophages in clodronate-treated mice. Bottom panel highlights that ADAMTS13 reduced VWF-positive vaso-occlusion and colocalization (yellow) of VWF with sickle erythrocytes (Ter119), which was abolished by clodronate-mediated depletion of macrophages. Data represent at least 4 independent experiments. (E) Quantification of VWF-positive vaso-occlusions in (D). Data represent at least 4 independent experiments. Data represent mean ± standard deviation. ∗∗∗∗P < .0001, 1-way ANOVA.
Figure 6.
Figure 6.
Clec4f+ Kupffer cells are an important restorative macrophage subset with increased VWF clearance activity. (A) Representative confocal microscopic images and (B) 3D rendering of confocal images of liver cryosections from TNF-challenged A/A mice, S/S mice, and S/S mice with ADAMTS13 (ATS) treatment. The sections were stained with primary antibodies to VWF, CLEC4F (Kupffer cell marker), and F4/80 (macrophage marker) (n = 5 mice per group). DAPI cell nuclear staining. (C) Quantification of the amount of VWF in CLEC4F+ macrophages of the 3D rendering confocal images in (B) (ie, cells stained positive for both VWF and CLEC4F). There was increased clearance of VWF in CLEC4F+ macrophages in the S/S mouse liver, which further increased after ATS treatment. Data represent mean ± standard deviation. ∗∗P < .01; ∗∗∗∗P < .0001, 1-way ANOVA. (D) Representative differentially expressed genes related to scavenging and anti-inflammatory functions between Kupffer cells from A/A and S/S mice challenged with TNF. For scRNA-seq, n = 2 mice per group.
Figure 7.
Figure 7.
Shorter forms of VWF are adhesive to erythrocytes and cleared in a desialylation-dependent manner. (A) Representative confocal microscopic images comparing VWF clearance (left) and vaso-occlusion (middle and right) in the liver of ADAMTS13-treated S/S mice with fetuin or asialofetuin coinjection. White arrow indicates shorter forms of VWF. The sections were stained with primary antibodies to erythrocytes (Ter119), macrophages (F4/80), and VWF. Data represent at least 4 independent experiments. DAPI, cell nuclear staining. (B) Quantification of VWF clearance and VWF-positive vaso-occlusion in panel A, showing that asialofetuin injection reduced colocalization of VWF with macrophages and abolished the ADAMTS13-mediated reduction of VWF-rich vaso-occlusions. ∗∗P < .01; ∗∗∗P < .001, 2-tailed, unpaired Student t test. (C) Multimer analysis of purified mouse VWF with or without ADAMTS13 cleavage. Lanes 1 and 2 represent reaction mix without ADAMTS13 before and after overnight incubation at 37 °C, respectively. Lanes 3 and 4 represent reaction mix with ADAMTS13 before and after overnight incubation at 37°C, respectively. (D) Comparison of erythrocyte adhesion to flow chambers coated with ADAMTS13 (ATS)-treated or untreated VWF. Some sickle erythrocytes were preincubated with integrin blockers (20 μg/mL bocking antibody to mouse β2 [clone GAME-46], 20 μg/mL arginylglycylaspartic acid (RGD) peptide, or 20 μg/mL bocking antibody to mouse β1 [clone HM β1-1]). Data represent 3 independent experiments. (E) Quantification of adherent sickle erythrocytes per field of view (FOV). ∗∗∗∗P < .0001; 1-way ANOVA. mAb, monoclonal antibody; ns, nonsignificant.

Comment in

References

    1. Rees DC, Williams TN, Gladwin MT. Sickle-cell disease. Lancet. 2010;376(9757):2018–2031. - PubMed
    1. Redinus K, Baek JH, Yalamanoglu A, et al. An Hb-mediated circulating macrophage contributing to pulmonary vascular remodeling in sickle cell disease. JCI Insight. 2019;4(15) - PMC - PubMed
    1. Liu Y, Jing F, Yi W, et al. HO-1(hi) patrolling monocytes protect against vaso-occlusion in sickle cell disease. Blood. 2018;131(14):1600–1610. - PMC - PubMed
    1. Sharma R, Antypiuk A, Vance SZ, et al. Macrophage metabolic rewiring improves heme-suppressed efferocytosis and tissue damage in sickle cell disease. Blood. 2023;141(25):3091–3108. - PMC - PubMed
    1. Liu Y, Zhong H, Bao W, et al. Patrolling monocytes scavenge endothelial-adherent sickle RBCs: a novel mechanism of inhibition of vaso-occlusion in SCD. Blood. 2019;134(7):579–590. - PMC - PubMed

Publication types