. 2024 Mar 21;143(12):1167-1180.
doi: 10.1182/blood.2023022276.

Targeting the tissue factor coagulation initiation complex prevents antiphospholipid antibody development

Affiliations

Targeting the tissue factor coagulation initiation complex prevents antiphospholipid antibody development

Nadine Müller-Calleja et al. Blood. .

Abstract

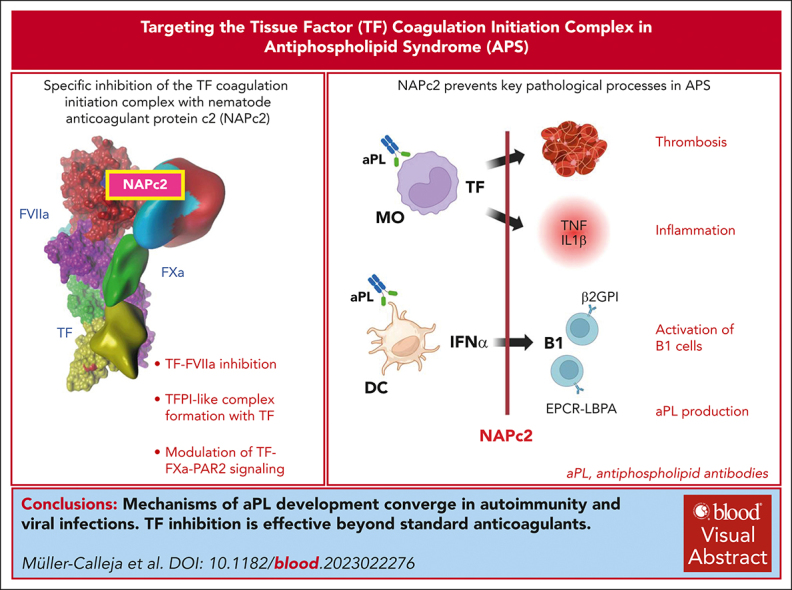
Antiphospholipid antibodies (aPL) in primary or secondary antiphospholipid syndrome (APS) are a major cause for acquired thrombophilia, but specific interventions preventing autoimmune aPL development are an unmet clinical need. Although autoimmune aPL cross react with various coagulation regulatory proteins, lipid-reactive aPL, including those derived from patients with COVID-19, recognize the endolysosomal phospholipid lysobisphosphatidic acid presented by the cell surface-expressed endothelial protein C receptor. This specific recognition leads to complement-mediated activation of tissue factor (TF)-dependent proinflammatory signaling and thrombosis. Here, we show that specific inhibition of the TF coagulation initiation complex with nematode anticoagulant protein c2 (NAPc2) prevents the prothrombotic effects of aPL derived from patients with COVID-19 in mice and the aPL-induced proinflammatory and prothrombotic activation of monocytes. The induction of experimental APS is dependent on the nicotinamide adenine dinucleotide phosphate (NADPH) oxidase complex, and NAPc2 suppresses monocyte endosomal reactive oxygen species production requiring the TF cytoplasmic domain and interferon-α secretion from dendritic cells. Latent infection with murine cytomegalovirus causes TF cytoplasmic domain-dependent development of persistent aPL and circulating phospholipid-reactive B1 cells, which is prevented by short-term intervention with NAPc2 during acute viral infection. In addition, treatment of lupus prone MRL-lpr mice with NAPc2, but not with heparin, suppresses dendritic-cell activation in the spleen, aPL production and circulating phospholipid-reactive B1 cells, and attenuates lupus pathology. These data demonstrate a convergent TF-dependent mechanism of aPL development in latent viral infection and autoimmune disease and provide initial evidence that specific targeting of the TF initiation complex has therapeutic benefits beyond currently used clinical anticoagulant strategies.


Conflict of interest statement

Conflict-of-interest disclosure: W.R. is a consultant for ARCA Biopharma. W.R., N.M.-C., K.L., and J.W.-M. are listed as inventors on intellectual properties for the therapeutic use of NAPc2. The remaining authors declare no competing financial interests.

Figures

None
Graphical abstract
Figure 1.
Figure 1.
Inhibition of aPL prothrombotic and proinflammatory response by NAPc2. (A) Thrombus formation in mice treated with immunoglobulin (10 μg) fractions either alone or together with NAPc2; platelets are shown in red, and leukocytes are shown in green. Quantification of thrombus size in the vena cava inferior 3 hours after injection of immunoglobulin isolated from healthy controls (n = 4) or patients with COVID-19 (n = 6) and flow restriction. Mean ± standard deviation (SD), ∗∗∗∗P < .0001, t test following Shapiro-Wilk test for normal distribution. (B) MM1 cells were cultured in human serum or plasma and then stimulated for 1 hour with HL5B or HL7G (400 ng/mL each), rJGG9 or IgG (1 μg/mL each), LPS (10 ng/mL) or IgG from patients with COVID-19 (10 μg/mL). (C) Suppression of TF, TNF, GBP6 and IRF8 mRNA induction by NAPc2 (200 nM) and NAP5 (200 nM) after 1 hour of stimulation with immunoglobulin (10 μg/mL) isolated from patients with COVID-19 (n = 10), ∗P < .0001; 1-way analysis of variance (ANOVA).
Figure 2.
Figure 2.
NAPc2 treatment inhibits aPL induced thromboinflammatory signaling without affecting aPL induced IFN response in monocytes. (A) Principal component analysis of aPL or NAPc2–treated monocytes and their respective controls reveals distinct clustering of stimulated and treatment groups (n = 4 per group). (B-C) Volcano plots of differentially expressed genes of HL5B and HL7G aPL–stimulated monocytes compared with IgG stimulated controls. Both aPL induce a highly similar proinflammatory phenotype involving NF-κB and IFN signaling. (D) Heatmaps showing z-scaled count values between the different treatment groups of the top 100 differentially expressed genes (P-adjusted <.001 and log2-fold change ± 2.5) from the comparison between HL5B- and IgG-treated monocytes. (E-H) Volcano plots revealed that NAPc2 treatment inhibited aPL induced NF-κB signaling, but not aPL induced IFN responses. Thresholds were set at a log2-fold change of ±2.5 and a P-adjust <.05.
Figure 2.
Figure 2.
NAPc2 treatment inhibits aPL induced thromboinflammatory signaling without affecting aPL induced IFN response in monocytes. (A) Principal component analysis of aPL or NAPc2–treated monocytes and their respective controls reveals distinct clustering of stimulated and treatment groups (n = 4 per group). (B-C) Volcano plots of differentially expressed genes of HL5B and HL7G aPL–stimulated monocytes compared with IgG stimulated controls. Both aPL induce a highly similar proinflammatory phenotype involving NF-κB and IFN signaling. (D) Heatmaps showing z-scaled count values between the different treatment groups of the top 100 differentially expressed genes (P-adjusted <.001 and log2-fold change ± 2.5) from the comparison between HL5B- and IgG-treated monocytes. (E-H) Volcano plots revealed that NAPc2 treatment inhibited aPL induced NF-κB signaling, but not aPL induced IFN responses. Thresholds were set at a log2-fold change of ±2.5 and a P-adjust <.05.
Figure 3.
Figure 3.
TF cytoplasmic domains signaling coupling to the NAPDH oxidase is required for aPL development. (A) Flow cytometric analysis of endosomal ROS production in MM1 cells stimulated with aPL HL5B and the effect of inhibitors. Cells were loaded with H2DCFDA before stimulation with HL5B without or with NAPc2, anti-TF 5G9 (aPL signaling noninhibitory) and 10H10 (aPL signaling inhibitory), or anti-PAR1 ATAP/WEDE; n = 5, means ± SD of mean fluorescence intensity; ∗P ≤ .001; 2-way ANOVA, Sidak multiple comparisons test. (B-C) Serum anticardiolipin (CL) (B) or anti-β2GPI (C) titers in mice of the indicated genotypes immunized with aPL HL5B; n = 5 mice, ∗P ≤ .03; 2-way ANOVA, Sidak multiple comparisons test. (D-E) The indicated mouse strains mice were infected with mCMV and serum anti-LBPA (D) or anti-β2GPI (E) titers were measured 5 and 12 weeks after infection; n = 6 mice, ∗P ≤ .0001; 2-way ANOVA, Sidak multiple comparisons test. (F) Representative example of flow cytometric detection of peripheral blood B cells reactive with fluorescently labeled PL vesicles or fluorescently labeled β2GPI. Seven weeks after CMV infection, circulating lipid-reactive as well as β2GPI-reactive B1 cells are found in C57BL/6J WT mice but not in TFΔCT mice.
Figure 4.
Figure 4.
NAPc2 prevents the development of aPL in mCMV infection. (A) Blood cytokine levels of WT animals infected with 2 × 105 plaque-forming unit mCMV and treated with 0.5 mg/kg NAPc2 (red) or saline (blue) every second day. In contrast to the depicted significantly reduced cytokine levels 42 hours after infection, NAPc2 treatment had no effect on TNF, IL6, IL1β, IL10, and CCL5 expression measured in the same multiplex assay; ∗P< .05, ∗∗P< .01, 2-way ANOVA, Sidak comparison. (B) Viral loads determined by quantification of genomic viral DNA in the indicated organs 21 days after infection in mice treated from day 2 after viral infection. (C) Serum anti-CL titers were determined at the indicated times; n = 8 mice, ∗P ≤ .001; 2-way ANOVA, Sidak multiple comparisons test. (D) Fluorescent PL vesicles staining of circulating B cells at day 10 after infection. PL-positive B cells were identified as CD5+CD19+CD27+CD43+ memory type B1a cells in peripheral blood and absent in NAPc2-treated mice. (E) Quantification of blood PL+ CD19+ B cells in mice treated with NAPc2 or saline control at day 10. Mean ± SD, n = 8 mice, ∗P < .0001, t test following Shapiro-Wilk test for normal distribution (F) serum anti-LBPA and anti-β2GPI titers were determined 12 weeks after infection and NAPc2 treatment for 20 days. n = 6 to 7 mice, ∗P ≤ .0001; 2-way ANOVA, Sidak multiple comparisons test.
Figure 5.
Figure 5.
Prevention of SLE-like syndrome by NAPc2 treatment. (A) Anti-CL titers in MRL-lpr mice treated with 0.5 mg/kg NAPc2 every second day starting at an age of 11 weeks; n = 6, P ≤ .0007; 2-way ANOVA, Sidak multiple comparisons test. (B) Anti-CL and β2GPI titers in an independent cohort with the same randomization and treatment scheme; n = 6, P ≤ .0001; 2-way ANOVA, Sidak multiple comparisons test. (C) Lymphadenopathy score for NAPc2- or saline-treated MRL-lpr mice; n = 6 per group, ∗P ≤ .05; 2-way ANOVA, Sidak multiple comparisons test. (D) Heatmap of the top 500 most significantly differentially expressed genes in splenic DCs from MRL-lpr mice isolated at the end of the treatment experiment; counts are z-scale normalized. Gene set enrichment analysis (GSEA) confirmed that NAPc2 suppresses inflammatory responses in DCs sorted from spleen; P-adjust threshold <.05 was used in GSEA (n = 4 per group). (E) Renal pathology scores and glomerular immune cell infiltration of NAPc2- or saline-treated MRL-lpr mice; n = 12 mice per group, ∗P < .025; Mann-Whitney U test. Scale bars, 50 mm. (F) Albuminuria in NAPc2- or saline-treated MRL-lpr mice determined at the end of the experiment. Combined data from the cohorts shown in panels A and B; P = .0768, unpaired t test with Welch correction.
Figure 6.
Figure 6.
Clinically used heparin does not suppress aPL development in SLE–like autoimmune disease. (A) Anti-CL titers observed over 1 year in a single-center cohort of 46 patients without antithrombotic therapy and under heparin (n = 8) or vitamin K antagonist (VKA) (n = 16) therapy. (B) Serum anti-CL or anti-β2GPI titers in MRL-lpr mice treated for 19 days with NAPc2 or heparin; n = 4 per group, ∗P < .002; 1-way ANOVA. (C) Representative flow cytometry analysis of B1 cells reactive with PL vesicles in the blood of mice treated for 19 days with NAPc2 or heparin. (D) Quantification of CD19+CD43+CD27+ B1 cells reactive with PL vesicle+ or β2GPI+ at day 19 of treatment. Specificity of B1-cell reactivity was demonstrated by competition with the pathogenic target for aPL, sEPCR-LBPA, vs nonmodified sEPCR-PC. Note that PL vesicle and β2GPI staining was also inhibited by the addition of unlabeled alternative antigen (β2GPI or PL, respectively), in line with dual reactive B1 cells (n = 6-9 per group), ∗P < .0001; 1-way ANOVA, compared with saline-treated animals.

Comment in

References

    1. Garcia D, Erkan D. Diagnosis and management of the antiphospholipid syndrome. N Engl J Med. 2018;378(21):2010–2021. - PubMed
    1. Schreiber K, Sciascia S, de Groot PG, et al. Antiphospholipid syndrome. Nat Rev Dis Primers. 2018;4 - PubMed
    1. Knight JS, Branch DW, Ortel TL. Antiphospholipid syndrome: advances in diagnosis, pathogenesis, and management. BMJ. 2023;380 - PubMed
    1. Shi T, Iverson GM, Qi JC, et al. Beta 2-glycoprotein I binds factor XI and inhibits its activation by thrombin and factor XIIa: loss of inhibition by clipped beta 2-glycoprotein I. Proc Natl Acad Sci U S A. 2004;101(11):3939–3944. - PMC - PubMed
    1. Passam FH, Chen G, Chen VM, Qi M, Krilis SA, Giannakopoulos B. Betaeta-2-glycoprotein I exerts antithrombotic function through its domain V in mice. J Autoimmun. 2022;126 - PubMed

Publication types