Review
. 2023 Dec 4;8(50):47340-47366.
doi: 10.1021/acsomega.3c05465. eCollection 2023 Dec 19.

Study of Drug Delivery Using Purely Organic Macrocyclic Containers-Cucurbit[7]uril and Pillararene

Affiliations
Review

Study of Drug Delivery Using Purely Organic Macrocyclic Containers-Cucurbit[7]uril and Pillararene

Arnab Roy Chowdhury et al. ACS Omega. .

Abstract

An impaired immune system is the root of various human ailments provoking the urge to find vehicle-mediated quick delivery of small drug molecules and other vital metabolites to specific tissues and organs. Thus, drug delivery strategies are in need of improvement in therapeutic efficacy. It can be achieved only by increasing the drug-loading capacity, increasing the sustained release of a drug to its target site, easy relocation of drug molecules associated with facile complexation-induced properties of molecular vehicles, and high stimuli-responsive drug administration. Supramolecular drug delivery systems (SDDS) provide a much needed robust yet facile platform for fabricating innovative drug nanocarriers assembled by thermodynamically noncovalent interaction with the tunable framework and above-mentioned properties. Measures of cytotoxicity and biocompatibility are the two main criteria that lie at the root of any promising medicinal applications. This Review features significant advancements in (i) supramolecular host-guest complexation using cucurbit[7]uril (CB[7]), (ii) encapsulation of the drug and its delivery application tailored for CB[7], (iii) self-assembly of supramolecular amphiphiles, (iv) supramolecular guest relay using host-protein nanocavities, (v) pillararene (a unique macrocyclic host)-mediated SDDS for the delivery of smart nanodrugs for siRNA, fluorescent molecules, and insulin for juvenile diabetes. Furthermore, fundamental questions and future hurdles related to smart SDDS based on CB[7] and pillararenes and their future promising breakthrough implementations are also distinctly outlined in this Review.


Conflict of interest statement

The authors declare no competing financial interest.

Figures

Figure 1
Figure 1
Illustration showing the chemical structure of cucurbit[7]uril (CB[7], 1).
Scheme 1
Scheme 1. Chemical Structures of the Benzimidazole Molecule and Its Derivatives
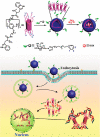
Figure 2
Figure 2
pH titration plots of the BZ drugs, tracked by UV in the absence (filled circles) and presence of CB[7] (2.5 mmol L–1, empty circles). Reprinted with permission from ref (68). Copyright 2022, Canadian Science Publishing.
Figure 3
Figure 3
1H NMR-based spectral plot of 0.25 mmol L–1 FBZ (a) in the absence of CB[7] and (b) in the presence of 2.5 mmol L–1 CB[7] in D2O at pD 2.4. Reprinted with permission from ref (68). Copyright 2011, Canadian Science Publishing.
Figure 4
Figure 4
At pH 7.2, absorption spectra measured for the BZ drugs in the absence (dashed lines) and presence of CB[7] (2.0 mmol L–1, solid lines). The arrows show the enhancement of the solubility factors. Note that the solution taken for UV spectroscopic analysis is 30 times diluted in order to obtain an OD value inside the instrumental range. Reprinted with permission from ref (68). Copyright 2011, Canadian Science Publishing.
Figure 5
Figure 5
(A) Diagram showing chemical structure of serotonin (SRT, 7) (B) Prototropic equilibrium of SRT with different pH values.
Figure 6
Figure 6
(A) UV–vis-based pH titration graph showing the surge of the 333 nm absorption peak with increasing pH, (B) fluorescence-based pH titration graph illustrating the quenching of the fluorescence peak at 335 nm with pH, and (C) determination of the pKa value from UV–vis and fluorescence titration. The normalized optical density at 333 nm and the fluorescence intensity at 335 nm are plotted against the pH of the solution. Reprinted from ref (79). Copyright 2020, Frontiers.
Figure 7
Figure 7
(A) Fluorescence titration of SRT with CB[7] at pH 3.0; encapsulation leading to a gradual decrease of the intensity peak, and (B) time-resolved anisotropy decay plot of SRT in the presence and absence of CB[7] at pH 3. Reprinted from ref (79). Copyright 2020, Frontiers.
Figure 8
Figure 8
(A) NMR titration plot of 0.5 mM SRT with increasing concentration of CB[7] up to 4.0 mM at pD 2.8; the aromatic region and the aliphatic region are illustrated in the left zone and the right zone of the NMR titration plot, respectively, (B) fitted plot of the variation in complexation-induced shift (CIS) against the concentration of CB[7], and (C) pictorial representation of the feasible SRTH+·CB[7] complex. Reprinted from ref (79). Copyright 2020, Frontiers.
Figure 9
Figure 9
(A) NMR titration plot of the SRT·CB[7] (0.5 mM SRT) complex with increasing concentration of CsCl up to 10 mM at pD 2.5; left portion shows the aromatic region and the right portion shows the aliphatic region of the NMR spectra. (B) A fitted plot illustrating the difference in chemical shift values (in ppm) against the concentration of CsCl. (C) Diagrammatic illustration of the SRT·CB[7]·Cs+ complex. Reprinted from ref (79). Copyright 2020, Frontiers.
Figure 10
Figure 10
Structure of norharmane (NHM, 8) and the protolytic equilibrium between its neutral and protonated forms (NHMH+).
Figure 11
Figure 11
Excited-state pH titration plot of NHM. Reprinted with permission from ref (89). Copyright 2018, Elsevier.
Figure 12
Figure 12
Absorption spectra plot of free NHM in the absence of CB[7] (dashed lines) and the presence of 4.0 mM CB[7] (solid line) at (a) pH 3.0, (b) pH 6.8, and (c) pH 12.1. (d) Bar-diagram illustrating the following solubility enhancement factor with CB[7]. The error bar shows the standard deviation from triplicated measurements. Reprinted with permission from ref (89). Copyright 2018, Elsevier.
Scheme 2
Scheme 2. Lansoprazole (9a) and Omeprazole (9b)
Figure 13
Figure 13
Upon dissolving 9a (50 mm) in aqueous solution at pH 2.9, the active form evolved followed by UV spectroscopy (λmax = 340 nm) in the absence (dashed line) and presence (solid) of 0.2 mm CB[7]. The inset plot shows the UV spectra of 9a (dashed line, straightaway after dissolution in the absence of CB[7], λmax = 287 nm) and of the complex 9c·CB[7] (solid line, with 1 mm CB[7] after 3 min, λmax = 340 nm). Reprinted with permission from ref (66). Copyright 2008, Wiley-VCH.
Figure 14
Figure 14
1H NMR-based spectra of the aromatic region recorded in D2O of (a) the 9a·CB[7] complex (2 mm 1a, 5 mm CB7) at pD 3.3 and (b) the disulfide adduct 3a obtained in situ from the 9a·CB[7] complex (0.75 mm 1a, 3 mm CB[7]) upon adding 2.0 mm cysteine. Reprinted with permission from ref (66). Copyright 2008. Wiley-VCH.
Figure 15
Figure 15
Structures elucidating cisplatin (a), a common multinuclear platinum-based complex conjoined with a ligand, BBR3464 (b), di-Pt (c), and tri-Pt (d).
Figure 16
Figure 16
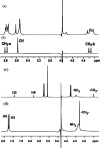
1H NMR spectra elucidating (a) CB[7] added with cisplatin at R = 1 at 25 °C in D2O solvent, (b) CB[7], (c) di-Pt, and (d) di-Pt encapsulated with CB[7] at R = 1. Reprinted with permission from ref (101). Copyright 2006. The Royal Society of Chemistry.
Figure 17
Figure 17
Molecular model illustrating the perfect host–guest encapsulation between di-Pt and CB[7]: (a) top view and (b) side view. Reprinted with permission from ref (101). Copyright 2006. The Royal Society of Chemistry.
Figure 18
Figure 18
(a) Structure of monoprotonated ranitidine (Z isomer) along with the CIS value of its protons at pD = 2 denoted in red and (b) equilibria showing host–guest encapsulation and acid dissociation of ranitidine complexed with CB[7] in aqueous environment. (c) 1H NMR graph showing the resonances of deprotonated ranitidine without (bottom) and with 0.7 equiv (middle) and 1.4 equiv (top) of CB[7] at pD = 2 in D2O. The prime numbers shown in the top spectrum indicate the proton resonances for the E isomer. Reprinted with permission from ref (104). Copyright 2008. The Royal Society of Chemistry.
Figure 19
Figure 19
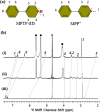
(a) Molecular diagram of MPTP (12) and MPP+; (b) 1H NMR spectral graph showing the resonances of MPTP when encapsulated by (i) 1.2 equiv of CB[7], (ii) 0.5 equiv of CB[7], and (iii) free MPTP. The CB[7] and D2O protons are indicated by (●) and (○), respectively, in D2O. Reprinted with permission from ref (116). Copyright 2015. The American Chemical Society.
Figure 20
Figure 20
Lateral view of supramolecular encapsulated (a) MPTPH+·CB[7] and (b) MPP+·CB[7] based on DFT calculation. Reprinted with permission from ref (116). Copyright 2015. The American Chemical Society.
Figure 21
Figure 21
Structure of PRO.
Figure 22
Figure 22
(a) Fluorescence titration plot of 10 mM PRO with increasing CB[7] concentration up to 2.5 μM; (b) guest relocation assay based on fluorescence titration upon addition of 1,6-diaminohexane in the predeveloped PRO·CB[7] complex. Reprinted with permission from ref (120). Copyright 2016. The Royal Society of Chemistry.
Figure 23
Figure 23
Fluorescence lifetime decay for (a) free and (b) PRO encapsulated CB[7]; bold lines represent the curves of best fitting. Time-resolved anisotropy decay measurement of (c) free PRO molecule and (d) CB[7]·PRO complex. Reprinted with permission from ref (120). Copyright 2016. The Royal Society of Chemistry.
Figure 24
Figure 24
(a) Relocation mechanism of guest molecule PRO by competitor HSA/BSA from the CB[7] cavity; (b) fluorescence-based titration of PRO with increasing concentration of CB[7] up to 36 μM followed by subsequent incorporation of HSA in the predeveloped PRO·CB[7] complex showing a gradual increase in fluorescence intensity reaching a plateau at λex = 340 nm; (c) plot representing the fluorescence intensity against the increasing concentration of CB[7] or HSA at 520 nm for CB[7] and 470 nm for HSA, respectively. Reprinted with permission from ref (120). Copyright 2016. The Royal Society of Chemistry.
Figure 25
Figure 25
Relative cell viability of CHO-K1 cells in the presence of CB[7] of concentration (0–1 mM) at different incubation times, (a) 48 h and (b) 3 h, measured using the MTT assay by examining formazan absorbance at 570 nm. Reprinted with permission from ref (121). Copyright 2010. The Royal Society of Chemistry.
Figure 26
Figure 26
Schematic pictogram of the chemical structure and host–guest complexation between CP[5] and NHM. Reprinted with permission from ref (126). Copyright 2018. The Royal Society of Chemistry.
Figure 27
Figure 27
Schematic representation of chemotherapy based on supramolecular host–guest encapsulation between OxPt (14) and CP6. Reprinted with permission from ref (123). Copyright 2018. The American Chemical Society.
Figure 28
Figure 28
Schematic diagram representing the formation of the supramolecular photosensitizer based on the host–guest complexation between CP[6] and methylene blue (15) for PDT. Reprinted with permission from ref (125). Copyright 2018. The Royal Society of Chemistry.
Figure 29
Figure 29
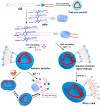
Representation of the fabrication of an amphiphilic PA[5] capped by ferrocene, formation of cationic vesicles, and their redox-responsive drug/siRNA release. Reprinted with permission from ref (127). Copyright 2014. Wiley-VCH.
Figure 30
Figure 30
Schematic illustration of pH-sensitive SDDS constructed by complexing CP[6] and FcA (16) to form MTZ (17)-loaded supra-amphiphilic CP[6]·FcA. Reprinted with permission from ref (129). Copyright 2013. The American Chemical Society.
Figure 31
Figure 31
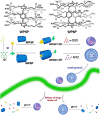
Schematic representation of the construction of the amphiphilic host–guest complex developed from WP[5]P as a host and pyridinium bromide as a guest; hollow SVs can be prepared from WP[6]P and pyridinium bromide guest. Reprinted with permission from ref (133). Copyright 2016. The American Chemical Society.
Figure 32
Figure 32
Schematic representation of the formation of multistimuli-responsive SVs fabricated from WP[6] and Saint molecule. Reprinted with permission from ref (134). Copyright 2014. The American Chemical Society.
Figure 33
Figure 33
Schematic diagram of the assembly of supramolecular pro-drug nanoparticles based on CP[6] and DOX-based pro-drugs. Reprinted with permission from ref (139). Copyright 2015. The American Chemical Society.
Figure 34
Figure 34
Schematic representation of the formation and drug-loading procedure of a vesicle based on Trp-modified PA[5] and a galactose derivative. Reprinted with permission from ref (143). Copyright 2016. The American Chemical Society.
Figure 35
Figure 35
Schematic representation of a glucose-triggered supramolecular insulin transport system. (a) Chemical structure and mechanism of multiresponsiveness of diphenylboronic acid guest molecules. (b) Vesicles formed out of supramolecular self-assembly of the host–guest complex and its efficient insulin release. Reprinted with permission from ref (144). Copyright 2018. Wiley-VCH.

References

    1. Challa R.; Ahuja A.; Ali J.; Khar R. Cyclodextrins in drug delivery: An updated review. Aaps Pharmscitech 2005, 6, E329–E357. 10.1208/pt060243. - DOI - PMC - PubMed
    1. Da Silva E.; Lazar A.; Coleman A. Biopharmaceutical applications of calixarenes. J. Drug Deliv Sci. Technol. 2004, 14, 3–20. 10.1016/S1773-2247(04)50001-1. - DOI
    1. Gillan R.Modelling molecules for drug delivery; Royal Society of Chemistry, Thomas Graham House: Science Park, Milton Road, Cambridge, 2006.
    1. Hirayama F.; Uekama K. Cyclodextrin-based controlled drug release system. Adv. Drug Delivery Rev. 1999, 36, 125–141. 10.1016/S0169-409X(98)00058-1. - DOI - PubMed
    1. Jeon Y. J.; Kim S.; Ko Y. H.; Sakamoto S.; Yamaguchi K.; Kim K. Novel molecular drug carrier: encapsulation of oxaliplatin in cucurbit[7]uril and its effects on stability and reactivity of the drug. Org. Biomol. Chem. 2005, 3, 2122–2125. 10.1039/b504487a. - DOI - PubMed