. 2023 Nov 28;9(12):e22876.
doi: 10.1016/j.heliyon.2023.e22876. eCollection 2023 Dec.

Magnetic properties of Fe-doped NiO nanoparticles

Affiliations

Magnetic properties of Fe-doped NiO nanoparticles

Alex Soares de Brito et al. Heliyon. .

Abstract

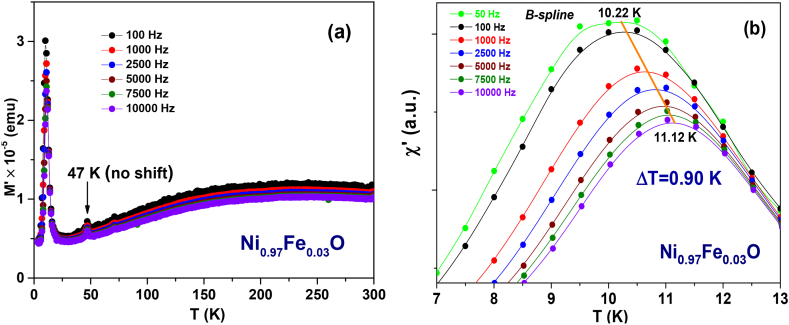
Undoped and Fe-doped NiO nanoparticles were successfully synthesized using a lyophilization method and systematically characterized through magnetization techniques over a wide temperature range, with varying intensity and frequency of the applied magnetic fields. The Ni1-xFexO nanoparticles can be described by a core-shell model, which reveals that Fe doping enhances exchange interactions in correlation with nanoparticle size reduction. The nanoparticles exhibit a superparamagnetic blocking transition, primarily attributed to their cores, at temperatures ranging from above room temperature to low temperatures, depending on the Fe-doping level and sample synthesis temperature. The nanoparticle shells also exhibit a transition at low temperatures, in this case to a cluster-glass-like state, caused by the dipolar magnetic interactions between the net magnetic moments of the clusters. Their freezing temperature shifts to higher temperatures as the Fe-doping level increases. The existence of an exchange bias interaction was observed, thus validating the core-shell model proposed.

Keywords: Cluster-glass; Core-shell model; Fe-doped; Nanoparticles; Nickel oxide; Spin-glass.


Conflict of interest statement

The authors declare that they have no known competing financial interests or personal relationships that could have appeared to influence the work reported in this paper.

Figures

Fig. 1
Fig. 1
M(T) curves of the undoped NiO sample (ZFC (blue) and FC (red) protocols) obtained for different probe fields: (a) H = 50 Oe; the insert shows an expanded view of the 2–40 K range; (b) H = 500 Oe; and (c) H = 5000 Oe.
Fig. 2
Fig. 2
χ(T) curves of the undoped NiO sample obtained for different frequencies fAC (a); expanded view of the 4–16 K range where the continuous solid lines are spline fits (b).
Fig. 3
Fig. 3
ln τ vs. the reciprocal of TBF for the undoped NiO sample. The solid line corresponds to a fit with the Arrhenius law.
Fig. 4
Fig. 4
Dynamic scaling law fit of the AC susceptibility peaks for the NiO sample.
Fig. 5
Fig. 5
M(H) curves obtained at RT and 2 K for the NiO sample. The insert is the derivative of the descending magnetization 2 K curve.
Fig. 6
Fig. 6
M(T) curves (ZFC (blue) and FC (red) protocols) obtained with H = 50 Oe for the Ni0.98Fe0.02O (the insert shows an expanded view of the 80–300 K range) (a) and Ni0.96Fe0.04O (the insert shows an expanded view of the 2–25 K range) (b) samples.
Fig. 7
Fig. 7
χ(T) curves of the Ni0.97Fe0.03O sample obtained for different frequencies, fAC (a); expanded view of the 7–13 K range where the continuous solid lines are splines fits (b). The red dashed line connects the maxima (TBF) of the 50 Hz and 10 kHz curves.
Fig. 8
Fig. 8
ln τ vs. the reciprocal of TBF (f), for the Ni0.97Fe0.03O sample. The solid line corresponds to a fit using the Arrhenius law.
Fig. 9
Fig. 9
Dynamic scaling law fit of the AC susceptibility peaks for the Ni0.97Fe0.03O sample.
Fig. 10
Fig. 10
M(H) curves obtained at RT and 2 K for the Ni0.98Fe0.02O (a) and Ni0.96Fe0.04O (b) samples. The inserts are expanded views of the hysteresis central parts.
Fig. 11
Fig. 11
M(T) curves - ZFC (blue) and FC (red) protocols obtained with H = 50 Oe for the Ni0.97Fe0.03O sample. The inserts show expanded views of the 35–300 K range (right-hand side) and the 2–45 K range (left-hand side).
Fig. 12
Fig. 12
M(T) curves - ZFC (blue) and FC (red) protocols obtained with H = 50 Oe for the Ni0.97Fe0.03O sample annealed at 500 °C. The insert shows an expanded view of the 150–300 K range.
Fig. 13
Fig. 13
M(H) curves obtained at 2 K for the Ni0.97Fe0.03O sample annealed at 400 °C, in ZFC (blue curve) and FC (black curve) conditions. The insert is an expanded view of the hysteresis central parts.

References

    1. Rinaldi-Montes N., Gorria P., Martínez-Blanco D., Fuertes A.B., Barquín L.F., Puente-Orench I., Blanco J.A. Scrutinizing the role of size reduction on the exchange bias and dynamic magnetic behavior in NiO nanoparticles. Nanotechnology. 2015;26 doi: 10.1088/0957-4484/26/30/305705. - DOI - PubMed
    1. Tadic M., Nikolic D., Panjan M., Blake G.R. Magnetic properties of NiO (nickel oxide) nanoparticles: blocking temperature and Neel temperature. J. Alloys Compd. 2015;647:1061–1068. doi: 10.1016/j.jallcom.2015.06.027. - DOI
    1. Nikolić D., Panjan M., Blake G.R., Tadić M. Annealing-dependent structural and magnetic properties of nickel oxide (NiO) nanoparticles in a silica matrix. J. Eur. Ceram. Soc. 2015;35:3843–3852. doi: 10.1016/j.jeurceramsoc.2015.06.024. - DOI
    1. Winkler E., Zysler R.D., Mansilla M.V., Fiorani D. Surface anisotropy effects in NiO nanoparticles. Phys. Rev. B. 2005;72 doi: 10.1103/PhysRevB.72.132409. - DOI
    1. L. Néel, Théorie du traînage magnétique des ferromagnétiques en grains fins avec application aux terres cuites, Ann. Geophys.(149AD) 99–136. https://hal.science/hal-03070532 (accessed February 6, 2023).

LinkOut - more resources