. 2023 Dec 8:17:1321277.
doi: 10.3389/fnbeh.2023.1321277. eCollection 2023.

Mice prone to tinnitus after acoustic trauma show increased pre-exposure sensitivity to background noise

Affiliations

Mice prone to tinnitus after acoustic trauma show increased pre-exposure sensitivity to background noise

Natalia Rybalko et al. Front Behav Neurosci. .

Abstract

Noise-induced tinnitus is generally associated with hearing impairment caused by traumatic acoustic overexposure. Previous studies in laboratory animals and human subjects, however, have observed differences in tinnitus susceptibility, even among individuals with similar hearing loss. The mechanisms underlying increased sensitivity or, conversely, resistance to tinnitus are still incompletely understood. Here, we used behavioral tests and ABR audiometry to compare the sound-evoked responses of mice that differed in the presence of noise-induced tinnitus. The aim was to find a specific pre-exposure neurophysiological marker that would predict the development of tinnitus after acoustic trauma. Noise-exposed mice were screened for tinnitus-like behavior with the GPIAS paradigm and subsequently divided into tinnitus (+T) and non-tinnitus (-T) groups. Both groups showed hearing loss after exposure, manifested by elevated audiometric thresholds along with reduced amplitudes and prolonged latencies of ABR waves. Prior to exposure, except for a slightly increased slope of growth function for ABR amplitudes in +T mice, the two groups did not show significant audiometric differences. Behavioral measures, such as the magnitude of the acoustic startle response and its inhibition by gap pre-pulse, were also similar before exposure in both groups. However, +T mice showed significantly increased suppression of the acoustic startle response in the presence of background noise of moderate intensity. Thus, increased modulation of startle by background sounds may represent a behavioral correlate of susceptibility to noise-induced tinnitus, and its measurement may form the basis of a simple non-invasive method for predicting tinnitus development in laboratory rodents.

Keywords: acoustic startle reflex; background noise; hearing loss; noise exposure; tinnitus.


Conflict of interest statement

The authors declare that the research was conducted in the absence of any commercial or financial relationships that could be construed as a potential conflict of interest.

Figures

Figure 1
Figure 1
Two groups of mice differing in behavioral symptoms of noise-induced tinnitus. (A) Behavioral paradigms used to assess baseline raw ASR (a), ASR inhibition in the presence of BGN (b), and inhibition of ASR by gap pre-pulse in BGN (c). (B) Magnitudes of ASR inhibition by a gap embedded in 75 dB BGN (GPIAS) in 61 mice before and after noise exposure (NE). White and red filled symbols indicate post-exposure GPIAS values in mice in which there was (−T, n = 24) or was not (+T, n = 37) a significant difference between ASRgap and ASRno gap after NE (see Methods for calculation). (C) The bar graph compares the mean GPIAS values for −T and +T groups before and after NE (p = 0.060 and p < 0.001; two-way ANOVA with SMCT). Note that after NE, GPIAS did not change significantly in −T mice (p = 0.999) whereas it decreased dramatically in +T mice (p < 0.001; two-way RM ANOVA with SMCT). (D) Differences in pre- and post-exposure GPIAS between −T and +T mice are similar at three different BGN levels (***p < 0.001; mixed-effects model with SMCT).
Figure 2
Figure 2
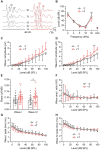
Comparison of ABRs in −T and +T mice before noise exposure. (A) Representative ABR recordings elicited by clicks of different intensities in mice from the −T and +T group before NE. Roman numerals indicate consecutive ABR waves. Responses evoked by threshold stimuli are shown in bold. (B) Thresholds of ABRs evoked by tones (2–32 kHz) or clicks in 24 mice from the −T group and 34 mice from the +T group. Except for those elicited by 32 kHz stimuli (p = 0.001), ABR thresholds were not significantly different in −T and +T mice (two-way ANOVA with SMCT). (C,D) Average amplitude-level functions for click-evoked ABR waves I and IV in 21 and 34 mice from the −T and +T groups, respectively. Growth functions for both waves were significantly different in −T and +T mice (p < 0.001, two-way ANOVA; ***p < 0.001, SMCT). (E) The bar graph compares the slope of the growth functions of ABR waves in −T (black) and +T (red) mice (*p < 0.05, two-way ANOVA with SMCT). (F) Similar ABR wave IV/I amplitude ratio in −T and +T mice (p = 0.547; two-way ANOVA with SMCT). (G,H) Dependence of latency of ABR waves I and IV on stimulation intensity in −T and +T mice. No significant difference was found between mouse groups at any click stimulus level (two-way ANOVA with SMCT).
Figure 3
Figure 3
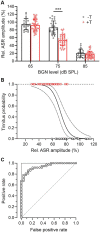
Mice more susceptible to tinnitus induction show increased ASR inhibition in the presence of BGN. (A) The bar graph summarizes the inhibitory effect of BGN at three levels on ASR in −T and +T mice. Relative ASR was quantified as the ratio between ASR amplitudes in the presence and absence of BGN x 100%. Note that in the presence of BGN at 65 and 85 dB, inhibition was similar in both groups of mice, whereas BGN at 75 dB suppressed ASR significantly more in +T than in −T mice (two-way ANOVA with SMCT). (B) Logistic regression analysis of the probability of tinnitus in mice according to their relative ASR in the presence of 75 dB BGN. The solid line indicates the logistic function modeling the association between a binary outcome (presence of tinnitus in +T mice, red symbols, or absence of tinnitus in −T mice, black symbols) based on a continuous variable (relative ASR amplitude). The dotted lines show the 95% confidence interval for the logistic regression curve. The logistic regression was statistically significant (b0 = 10.57 ± 2.74, b1 = −0.148 ± 0.039, p < 0.001, likelihood ratio test), indicating that the sigmoidal function described the observed data significantly better than the constant function. (C) ROC curve (open symbols) reflecting the predictive ability of the logistic regression shown in B. To construct the ROC curve, for each point on the logistic curve that was taken as a threshold for prediction, the number of correctly predicted positive outcomes was plotted against the number of incorrectly predicted positive outcomes (i.e., outcomes predicted as positive that are in fact negative). Note that the shape of the ROC curve is close to the shape of the ideal classifier, represented by the two lines forming a right angle in the upper left corner (solid line). For comparison, the dashed diagonal line shows the ROC curve of a classifier that has no better predictive ability than chance.
Figure 4
Figure 4
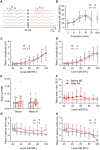
Comparison of post-exposure ABRs in −T and +T mice. (A) Representative ABR recordings elicited by clicks of different intensities in mice from the −T and +T group after NE. (B) Average increase in thresholds of ABRs to tones and clicks in −T and +T mice. For both groups, the threshold shift was significant at all frequencies of the sound stimuli (p < 0.001; −T: mixed-effects model with SMCT, n = 24; +T: two-way RM ANOVA with SMCT, n = 34). Differences in the shift between −T and +T mice were not significant at any frequency (two-way ANOVA with SMCT). (C,D) Amplitude-level functions for click-evoked ABR waves I and IV from the −T and +T groups, respectively. Acoustic trauma led to a significant reduction in amplitudes to values that were not significantly different in +T and −T mice (two-way ANOVA with SMCT). (E) Similar slope of ABR growth functions in −T (black) and +T (red) mice after NE (p = 0.820 and 0.915 for waves I and IV, respectively; two-way ANOVA with SMCT). (F) Increased ratio of wave IV and I amplitudes after NE in +T mice (p = 0.004, mixed-effects model; **p < 0.01, *p < 0.05, SMCT, n = 29). (G,H) Plots show prolongation of ABR wave I and IV latency in −T and +T mice after NE. The changes were greater in +T mice, so that the latency vs. stimulus intensity curves were significantly different in the mouse groups after exposure (p < 0.001 and p = 0.014, two-way ANOVA; *p < 0.05, SMCT).

References

    1. Ahlf S., Tziridis K., Korn S., Strohmeyer I., Schulze H. (2012). Predisposition for and prevention of subjective tinnitus development. PLoS One 7:e44519. doi: 10.1371/journal.pone.0044519, PMID: - DOI - PMC - PubMed
    1. Bhatt I. S., Wilson N., Dias R., Torkamani A. (2022). A genome-wide association study of tinnitus reveals shared genetic links to neuropsychiatric disorders. Sci. Rep. 12:22511. doi: 10.1038/s41598-022-26413-6, PMID: - DOI - PMC - PubMed
    1. Burghard A. L., Lee C. M., Fabrizio-Stover E. M., Oliver D. L. (2022). Long-duration sound-induced facilitation changes population activity in the inferior colliculus. Front. Syst. Neurosci. 16:920642. doi: 10.3389/fnsys.2022.920642, PMID: - DOI - PMC - PubMed
    1. Deng D., Masri S., Yao L., Ma X., Cao X., Yang S., et al. (2020). Increasing endogenous activity of NMDARs on GABAergic neurons increases inhibition, alters sensory processing and prevents noise-induced tinnitus. Sci. Rep. 10:11969. doi: 10.1038/s41598-020-68652-5, PMID: - DOI - PMC - PubMed
    1. Eggermont J. J., Roberts L. E. (2015). Tinnitus: animal models and findings in humans. Cell Tissue Res. 361, 311–336. doi: 10.1007/s00441-014-1992-8, PMID: - DOI - PMC - PubMed