. 2023 Dec 22;7(4):1266-1301.
doi: 10.1162/netn_a_00325. eCollection 2023.

Static and dynamic fMRI-derived functional connectomes represent largely similar information

Affiliations

Static and dynamic fMRI-derived functional connectomes represent largely similar information

Andraž Matkovič et al. Netw Neurosci. .

Abstract

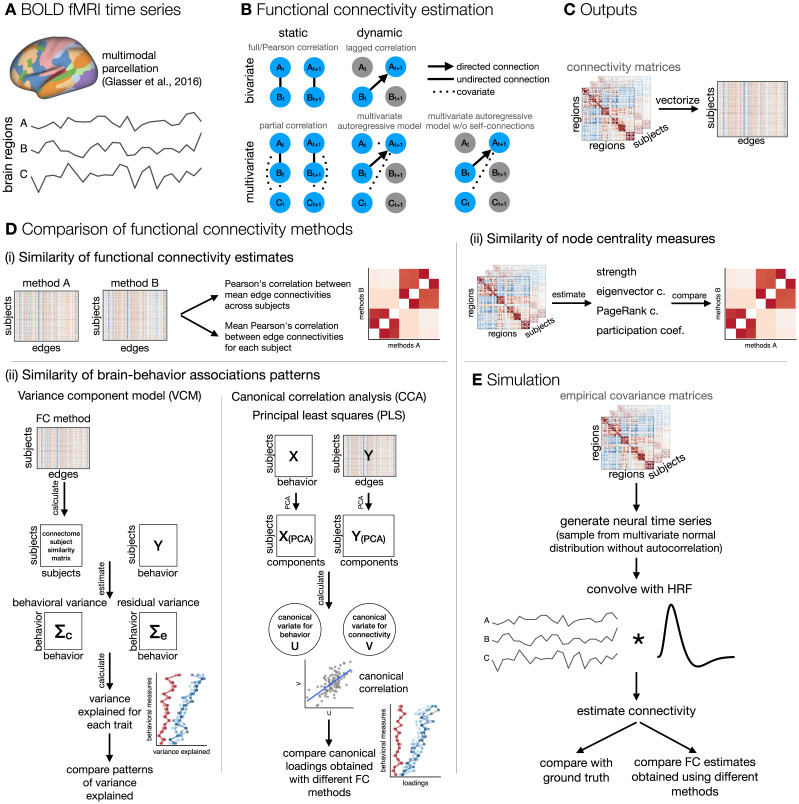
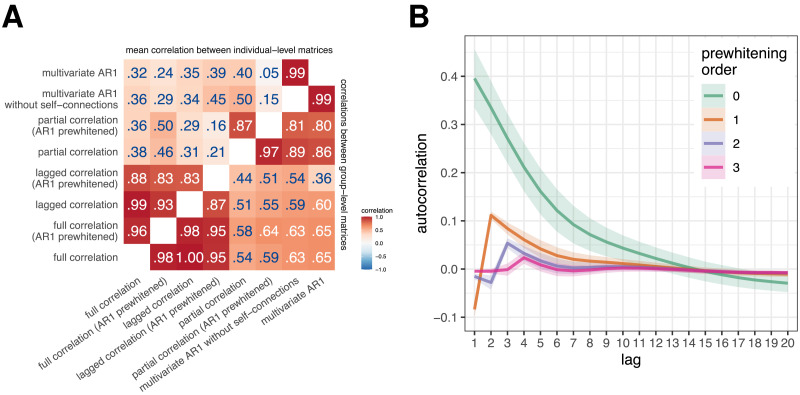
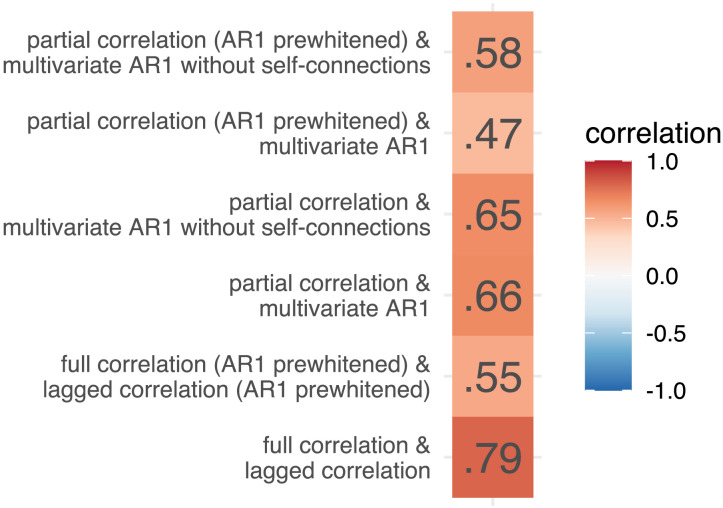
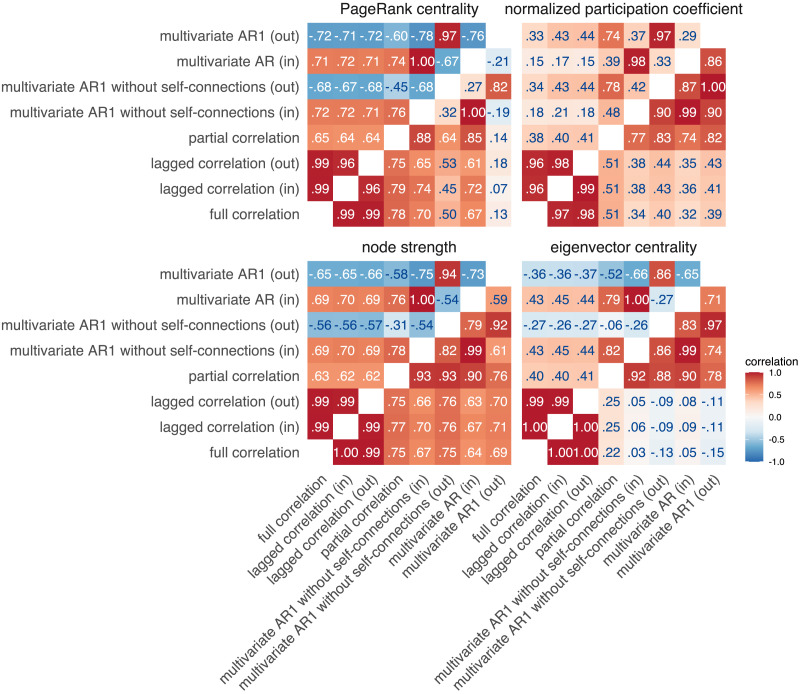
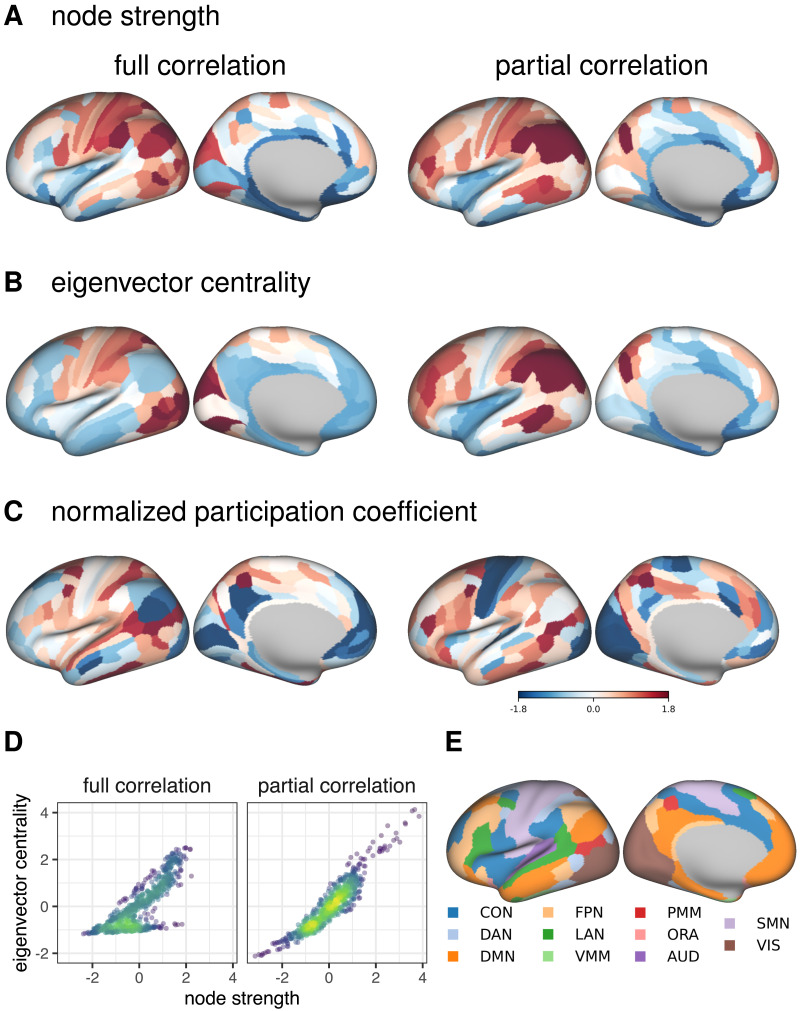
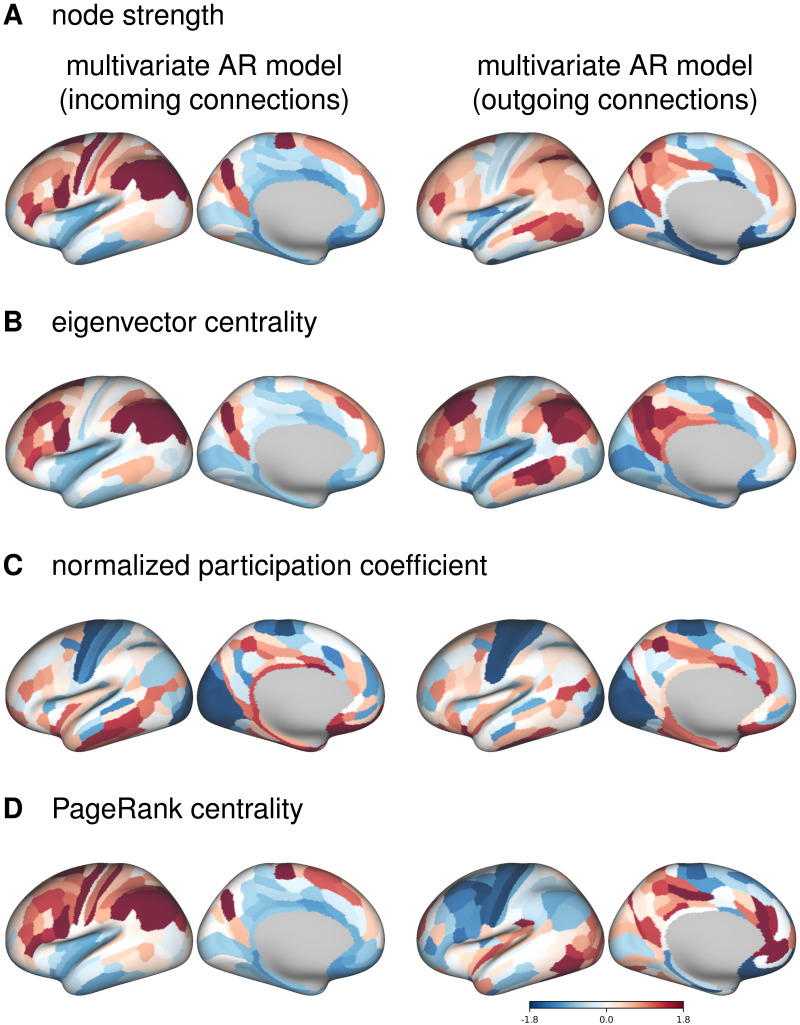
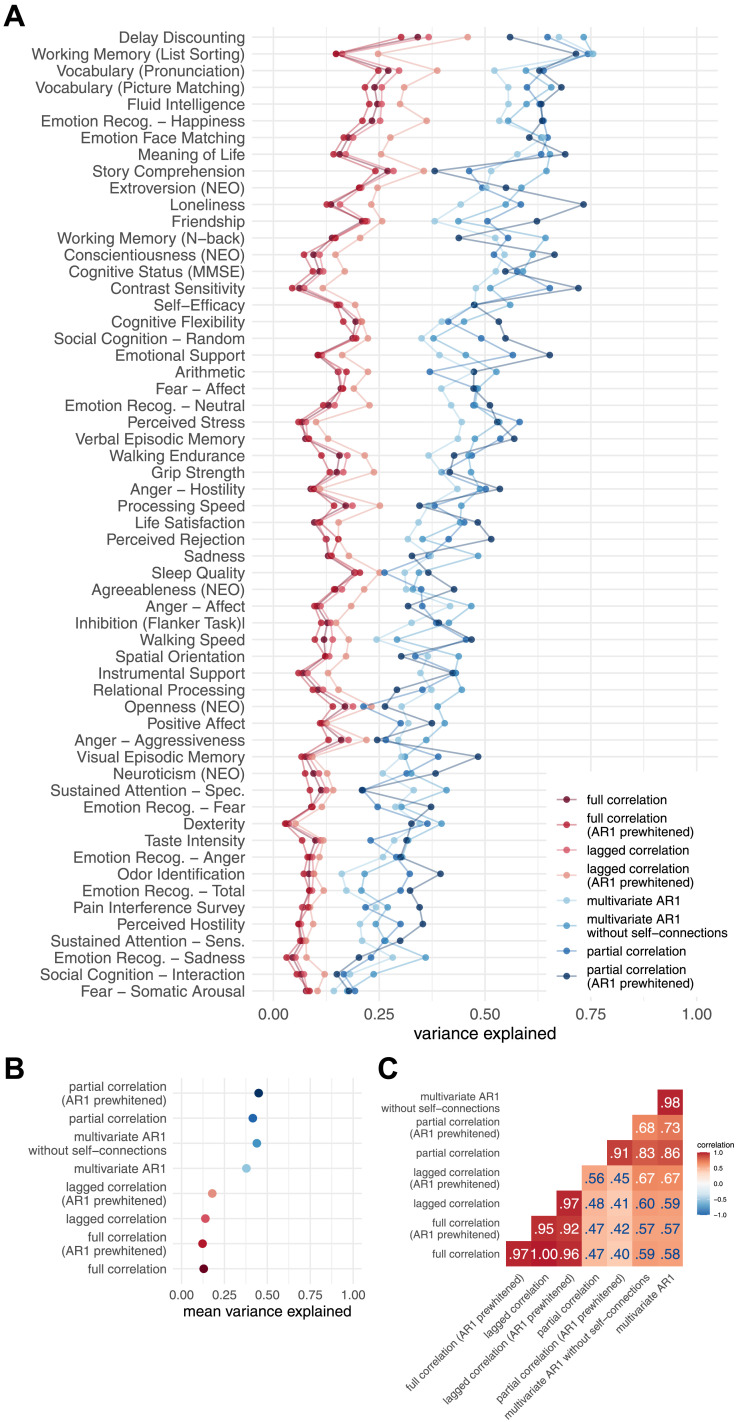
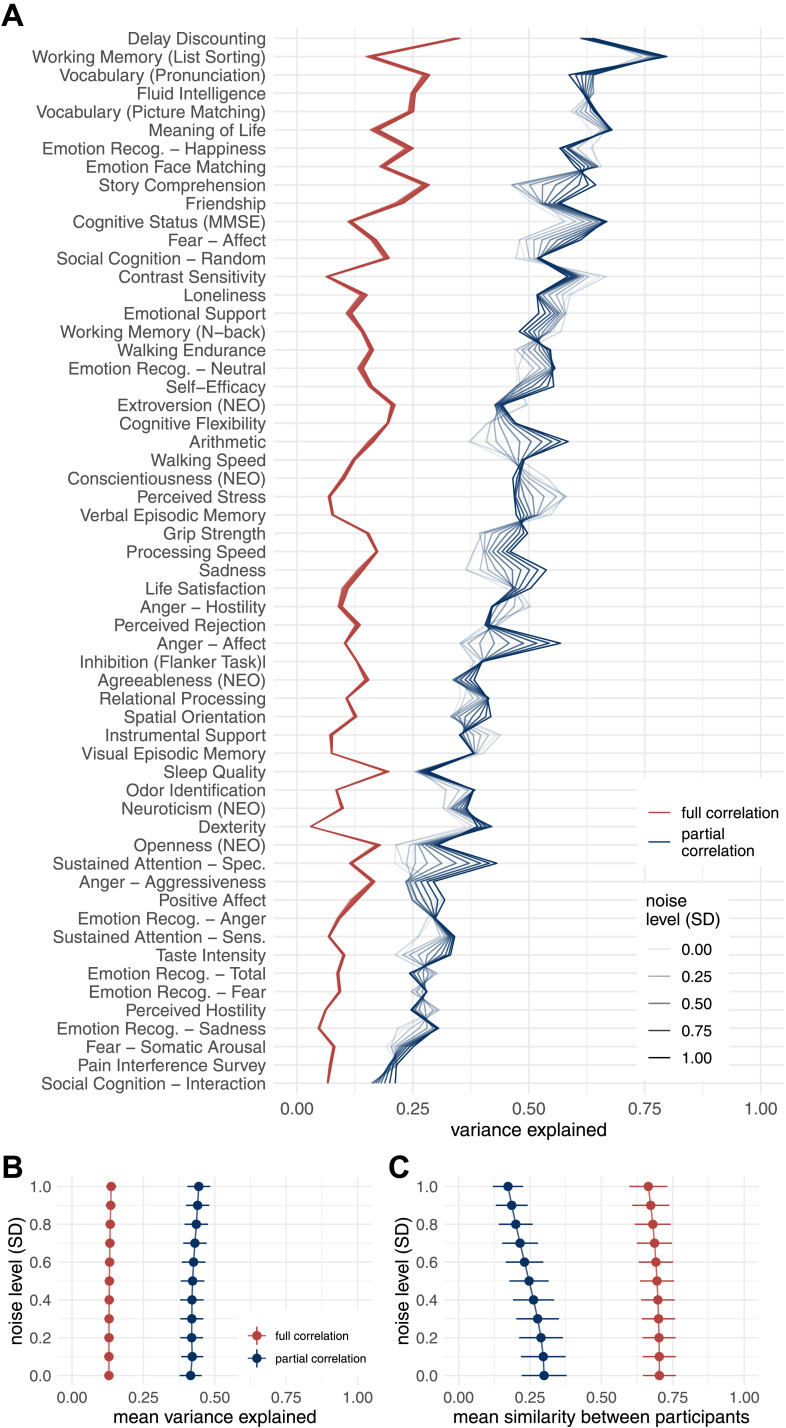
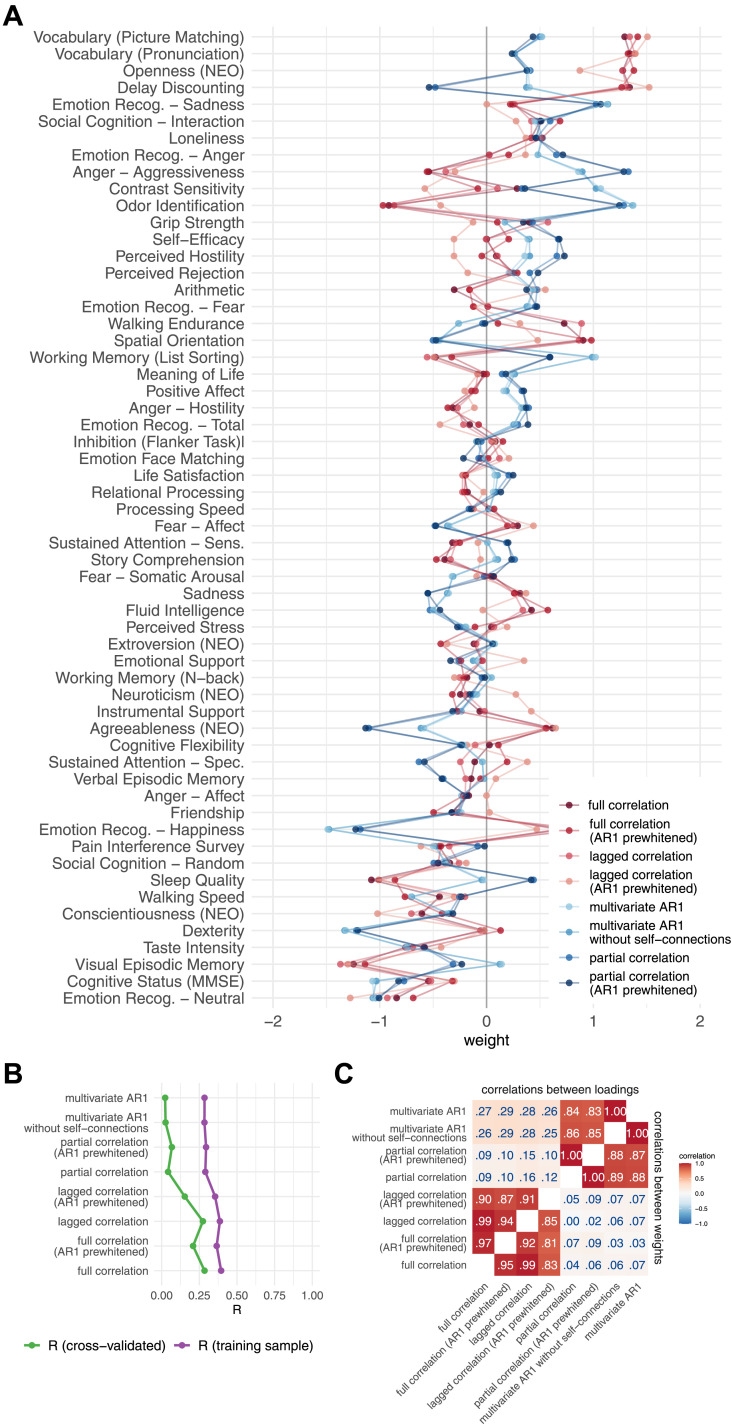
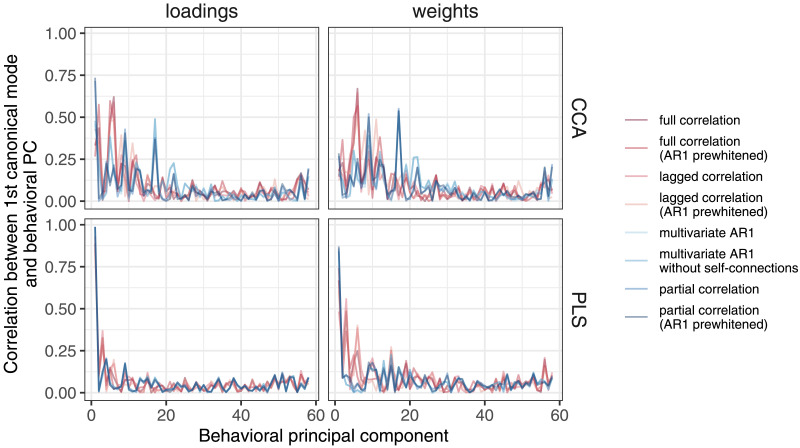
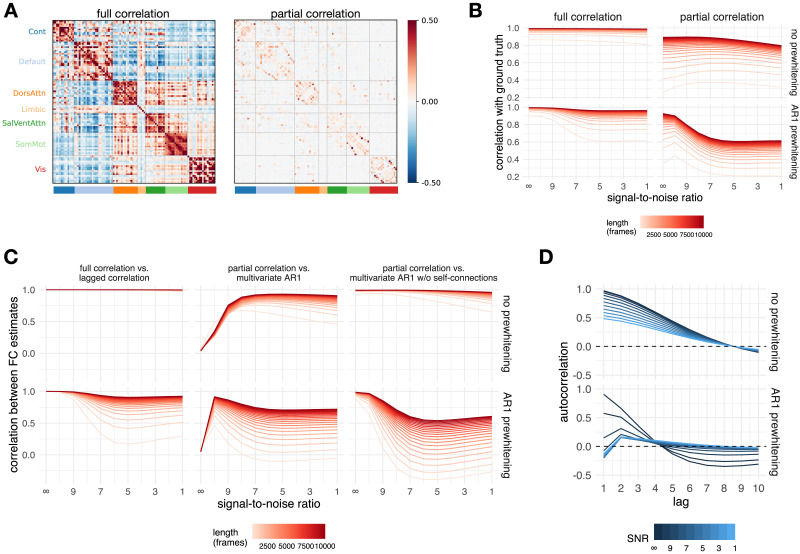
Functional connectivity (FC) of blood oxygen level-dependent (BOLD) fMRI time series can be estimated using methods that differ in sensitivity to the temporal order of time points (static vs. dynamic) and the number of regions considered in estimating a single edge (bivariate vs. multivariate). Previous research suggests that dynamic FC explains variability in FC fluctuations and behavior beyond static FC. Our aim was to systematically compare methods on both dimensions. We compared five FC methods: Pearson's/full correlation (static, bivariate), lagged correlation (dynamic, bivariate), partial correlation (static, multivariate), and multivariate AR model with and without self-connections (dynamic, multivariate). We compared these methods by (i) assessing similarities between FC matrices, (ii) by comparing node centrality measures, and (iii) by comparing the patterns of brain-behavior associations. Although FC estimates did not differ as a function of sensitivity to temporal order, we observed differences between the multivariate and bivariate FC methods. The dynamic FC estimates were highly correlated with the static FC estimates, especially when comparing group-level FC matrices. Similarly, there were high correlations between the patterns of brain-behavior associations obtained using the dynamic and static FC methods. We conclude that the dynamic FC estimates represent information largely similar to that of the static FC.

Keywords: Autoregressive model; Brain-behavior associations; Dynamic functional connectivity; Functional connectivity.


Conflict of interest statement

J.D.M. and A.A. consult for and hold equity with Neumora (formerly BlackThorn Therapeutics), Manifest Technologies, and are co-inventors on the following patents: Anticevic A, Murray JD, Ji JL: Systems and Methods for Neuro-Behavioral Relationships in Dimensional Geometric Embedding (N-BRIDGE), PCT International Application No. PCT/US2119/022110, filed March 13, 2019 and Murray JD, Anticevic A, Martin, WJ:Methods and tools for detecting, diagnosing, predicting, prognosticating, or treating a neurobehavioral phenotype in a subject, U.S. Application No. 16/149,903 filed on October 2, 2018, U.S. Application for PCT International Application No. 18/054,009 filed on October 2, 2018. G.R. consults for and holds equity with Neumora (formerly BlackThorn Therapeutics) and Manifest Technologies. A.M. declares no conflict of interest.

Figures

<b>Figure 1.</b>
Figure 1.
A schematic of analysis steps. (A) BOLD fMRI data was preprocessed, parcellated, and individual parcel time series were extracted. (B) Functional connectivity (FC) was estimated with five methods that differed along two dimensions: static versus dynamic and bivariate versus multivariate. Static FC refers to measures that are insensitive to temporal order and can be estimated using full/Pearson’s correlation or partial correlation, whereas measures of dynamic FC are sensitive to temporal order of time points. Dynamic FC can be estimated using measures of lag-based connectivity, such as lagged correlation, or using the linear multivariate autoregressive (AR) model. The lagged correlation between two time series is calculated by shifting one time series by p time points. Similarly, a p-th order multivariate (or vector) autoregressive model predicts the activity of a particular brain region at time point t based on the activity of all regions at time point(s) from tp to t − 1. Bivariate and multivariate FC methods differ in terms of number of variables (regions) taken into account when estimating connectivity at a single edge: bivariate connectivity between two regions depends only on the two regions, whereas multivariate connectivity between two regions includes all other regions as covariates. (C) FC matrices were vectorized. (D) FC estimates were compared (i) by calculating correlations between FC estimates, (ii) by calculating correlations between node centrality measures, and (iii) by comparing estimates of brain-behavior associations across FC methods. (E) Additionally, we performed simulation to assess the influence of random noise and signal length on the similarity between FC estimates obtained using different methods.
<b>Figure 2.</b>
Figure 2.
(A) Correlations between FC estimates obtained using different FC methods. We calculated the similarities between FC estimates obtained using different FC methods (i) by averaging connectivity matrices across participants and then computing correlations between them (correlation between group-level FC, bottom right triangle), and (ii) by computing correlations between the FC estimates for each participant separately and then averaging across participants (correlation between individual-level FC, top left triangle). (B) Autocorrelation function of experimental data as a function of prewhitening order. The mean autocorrelation function was computed over all participants and regions; the ribbons represent the standard deviation.
<b>Figure 3.</b>
Figure 3.
Correlations between edge similarity and test-retest reliability for selected pairs of FC methods.
<b>Figure 4.</b>
Figure 4.
Similarities between node centrality measures based on positive connections. Similarities were estimated by (1) computing node measures on group-averaged connectivity matrices (group-level comparison; below diagonal) and (2) by computing node measures for each individual separately, correlating within participants and averaging these correlations across participants (individual-level comparison; above diagonal).
<b>Figure 5.</b>
Figure 5.
Cortical distribution of centrality measures based on static FC methods for positive connections. (A) Node strength distribution. (B) Eigenvector centrality distribution. (C) Normalized participation coefficient distribution. PageRank centrality is omitted, because its correlation with strength is close to 1. For visualization, the values have been transformed into z-values. (D) Correlation between node strength and eigenvector centrality. (E) Functional networks as defined in Ji et al. (2019). CON – cingulo-opercular network, DAN – dorsal attention network, DMN – default mode network, FPN – frontoparietal network, LAN – language network, VMM – ventral multimodal network, PMM – posterior multimodal network, ORA – orbito affective network, AUD – auditory network, SMN – somatomotor network, VIS – visual network.
<b>Figure 6.</b>
Figure 6.
Cortical distribution of centrality measures based on multivariate autoregressive model for positive connections. For visualization, the values have been transformed into z-values.
<b>Figure 7.</b>
Figure 7.
Results of variance component model for brain-behavior associations. (A) Variance explained for individual traits estimated with different connectivity methods—traits are ordered according to the mean variance explained across connectivity methods. (B) Mean variance explained. (C) Similarities of explained variance patterns between connectivity methods.
<b>Figure 8.</b>
Figure 8.
Results of variance component model for brain-behavior associations on data with added noise. FC was estimated using Pearson’s/full correlation and partial correlation after adding various levels of random Gaussian noise to experimental time series. (A) Variance explained for individual traits estimated with different connectivity methods. Traits are ordered according to the mean variance explained across connectivity methods. (B) Mean variance explained. Error bars represent jackknife standard deviation. (C) Mean similarity between participants. Error bars represent standard deviation.
<b>Figure 9.</b>
Figure 9.
Results of canonical correlation analysis for brain-behavior associations. (A) CCA weights. (B) First canonical correlation on test and training set. (C) Correlations between canonical loadings and weights across functional connectivity methods for first canonical components.
<b>Figure 10.</b>
Figure 10.
Similarity between first behavioral principal component and loadings or weights, for both CCA and PLS. For PLS, the correlation between loadings or weights and the first PC was very high. For CCA, the correlation with the first PC was high for loadings but moderate for weights. The differences between the FC methods were generally small, but somewhat larger for CCA than for PLS.
<b>Figure 11.</b>
Figure 11.
Results of simulation. (A) Ground truth matrices (mean over participants). Note that all ground truth autoregressive model coefficients equal zero, since the simulated events were not autocorrelated. (B) Correlation between the ground truth and the simulated data for all FC methods and their relationship to the noise level and signal length. (C) Correlations between selected pairs of FC methods as a function of noise and signal length for simulated data. (D) The autocorrelation function of the simulated data as a function of prewhitening order and noise.

Update of

References

    1. Abraham, A., Milham, M. P., Di Martino, A., Craddock, R. C., Samaras, D., Thirion, B., & Varoquaux, G. (2017). Deriving reproducible biomarkers from multi-site resting-state data: An Autism-based example. NeuroImage, 147, 736–745. 10.1016/j.neuroimage.2016.10.045, - DOI - PubMed
    1. Allen, E. A., Damaraju, E., Plis, S. M., Erhardt, E. B., Eichele, T., & Calhoun, V. D. (2014). Tracking whole-brain connectivity dynamics in the resting state. Cerebral Cortex, 24(3), 663–676. 10.1093/cercor/bhs352, - DOI - PMC - PubMed
    1. Arbabshirani, M. R., Damaraju, E., Phlypo, R., Plis, S., Allen, E., Ma, S., … Calhoun, V. D. (2014). Impact of autocorrelation on functional connectivity. NeuroImage, 102, 294–308. 10.1016/j.neuroimage.2014.07.045, - DOI - PMC - PubMed
    1. Arbabshirani, M. R., Preda, A., Vaidya, J. G., Potkin, S. G., Pearlson, G., Voyvodic, J., … Calhoun, V. D. (2019). Autoconnectivity: A new perspective on human brain function. Journal of Neuroscience Methods, 323, 68–76. 10.1016/j.jneumeth.2019.03.015, - DOI - PubMed
    1. Bates, D., Mächler, M., Bolker, B., & Walker, S. (2015). Fitting linear mixed-effects models using lme4. Journal of Statistical Software, 67(1), 1–48. 10.18637/jss.v067.i01 - DOI

LinkOut - more resources