. 2023 Dec 16:2023:6916819.
doi: 10.1155/2023/6916819. eCollection 2023.

P-Glycoprotein Exacerbates Brain Injury Following Experimental Cerebral Ischemia by Promoting Proinflammatory Microglia Activation

Affiliations

P-Glycoprotein Exacerbates Brain Injury Following Experimental Cerebral Ischemia by Promoting Proinflammatory Microglia Activation

Yan Chen et al. Oxid Med Cell Longev. .

Abstract

Microglia are activated following cerebral ischemic insult. P-glycoprotein (P-gp) is an efflux transporter on microvascular endothelial cells and upregulated after cerebral ischemia. This study evaluated the effects and possible mechanisms of P-gp on microglial polarization/activation in mice after ischemic stroke. P-gp-specific siRNA and adeno-associated virus (p-AAV) were used to silence and overexpress P-gp, respectively. Middle cerebral artery occlusion/reperfusion (MCAO/R) and oxygen-glucose deprivation/reoxygenation (OGD/R) were performed in mice and cerebral microvascular endothelial cells (bEnd.3) in vitro, respectively. OGD/R-injured bEnd.3 cells were cocultured with mouse microglial cells (BV2) in Transwell. Influences on acute ischemic stroke outcome, the expression of inflammatory cytokines, and chemokines and chemokines receptors, microglial polarization, glucocorticoid receptor (GR) nuclear translocation, and GR-mediated mRNA decay (GMD) activation were evaluated via reverse transcription real-time polymerase chain reaction, western blot, or immunofluorescence. Silencing P-gp markedly alleviated experimental ischemia injury as indicated by reduced cerebral infarct size, improved neurological deficits, and reduced the expression of interleukin-6 (IL-6) and IL-12 expression. Silencing P-gp also mitigated proinflammatory microglial polarization and the expression of C-C motif chemokine ligand 2 (CCL2) and its receptor CCR2 expression, whereas promoted anti-inflammatory microglia polarization. Additionally, P-gp silencing promoted GR nuclear translocation and the expression of GMD relative proteins in endothelial cells. Conversely, overexpressing P-gp via p-AAV transfection offset all these effects. Furthermore, silencing endothelial GR counteracted all effects mediated by silencing or overexpressing P-gp. Elevated P-gp expression aggravated inflammatory response and brain damage after ischemic stroke by augmenting proinflammatory microglial polarization in association with increased endothelial CCL2 release due to GMD inhibition by P-gp.


Conflict of interest statement

No author has an actual or perceived conflicts of interest with the contents of this article.

Figures

Figure 1
Figure 1
P-glycoprotein influences ischemic infarction and neurological deficits in experimental ischemic stroke. Mice were intracerebroventricularly injected with P-glycoprotein (P-gp) siRNA or negative control (NC) siRNA (1.5 μL/10 g body weight), P-gp p-AAV or NC p-AAV (2.5 μL/10 g body weight), 48 hr or 14 days prior to MCAO/R surgery. Twenty-four hours after the surgery, mice were subjected to neurological behavior testing, and brains were harvested for western blot or TTC analyses. (a, b) Western-blotting quantification of P-gp levels in brain cortex (n = 4). (c, d) Representative TTC staining images and quantification of infarct volume (n = 6). (e) Neurological behavior assessed by Bederson score (n = 6). One-way ANOVA followed by the post hoc least significant difference test or Games Howell test for (a), (b), and (d). Mann–Whitney test for (e). All data are mean ± SD;  P < 0.05,  ∗∗P < 0.01 between two groups.
Figure 2
Figure 2
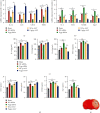
P-glycoprotein regulates inflammatory response and microglial polarization in experimental ischemic stroke. Mice were intracerebroventricularly injected with P-glycoprotein (P-gp) siRNA or negative control (NC) siRNA (1.5 μL/10 g body weight), P-gp p-AAV or NC p-AAV (2.5 μL/10 g body weight), 48 hr or 7 days prior to MCAO/R surgery. Twenty-four hours after the surgery, brains were harvested for RT-PCR and ELISA assays. (a, b) mRNA expression levels of IL-12, IL-6, IL-4, YM-1, CD16, iNOS, CD206, and Arg-1 measured via RT-PCR assay as fold changes relative to sham treatment (n = 4). (c, d) Contents of IL-12, IL-6, IL-4, YM-1, CD16, iNOS, CD206, and Arg-1 determined by ELISA assay (n = 6). (e) Coronal brain diagrams showing locations of regions for molecular analysis in infarct cortex. One-way ANOVA followed by the post hoc least significant difference test or Games Howell test for (a) and (b). Mann–Whitney test for (c) and (d). All data are mean ± SD;  P < 0.05,  ∗∗P < 0.01 between two groups.
Figure 3
Figure 3
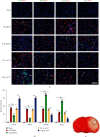
P-glycoprotein modulates microglial polarization in experimental ischemic stroke. Mice were intracerebroventricularly injected with P-glycoprotein (P-gp) siRNA or negative control (NC) siRNA (1.5 μL/10 g body weight), P-gp p-AAV or NC p-AAV (2.5 μL/10 g body weight), 48 hr or 7 days prior to MCAO/R surgery. Twenty-four hours after the surgery, brains were harvested for immunofluorescence assay. (a) Immunofluorescence colocalization of microglial polarization status markers (CD16, iNOS, CD206, and Arg-1) in the microglia (Iba1) (n = 4). Scale bars, 100 μm. (b) Quantification of CD16, iNOS, CD206, and Arg-1 localization in the microglia. (c) Coronal brain diagrams showing locations of regions for immunofluorescence staining analysis in infarct cortex. One-way ANOVA followed by the post hoc least significant difference test. All data are mean ± SD;  ∗∗P < 0.01 between two groups.
Figure 4
Figure 4
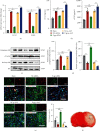
P-glycoprotein regulates GR nuclear translocation and further CCL2 degradation in experimental ischemic stroke. Mice were intracerebroventricularly injected with P-glycoprotein (P-gp) siRNA or negative control (NC) siRNA (1.5 μL/10 g body weight), P-gp p-AAV or NC p-AAV (2.5 μL/10 g body weight), 48 hr or 7 days prior to MCAO/R surgery. Twenty-four hours after the surgery, brains were harvested for RT-PCR, ELISA, western blotting, and immunofluorescence assays. (a) mRNA expression levels of CCL2 and CCR2 measured via RT-PCR assay as fold changes relative to sham treatment (n = 4). (b) Contents of CCL2 and CCR2 determined by ELISA assay (n = 6). (c, d) Immunostaining and western-blotting quantification of cytoplasm GR and nucleus GR expressions (n = 4). (e) Representative immunofluorescence images (left) and quantification (right) of nuclear and cytoplasmic localization (ratio of nuclear to cytoplasmic location) of GR (n = 4). Scale bars, 100 μm. (f) Coronal brain diagrams showing locations of regions for immunofluorescence staining analysis in infarct cortex. Mann–Whitney test for (a). One-way ANOVA followed by the post hoc least significant difference test or Games Howell test for (b), (d), and (e). All data are mean ± SD;  P < 0.05,  ∗∗P < 0.01 between two groups.
Figure 5
Figure 5
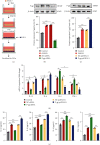
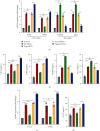
P-glycoprotein silence or overexpress in endothelial cells influenced pro- and anti- inflammatory cytokines expression in cocultured microglia following oxygen glucose deprivation/reoxygenation. Endothelial cells (bEnd.3) were transfected with P-glycoprotein (P-gp) or negative control (NC) siRNA, P-gp or NC pcDNA3.1 plasmid, or untransfected, and then subjected to either oxygen glucose deprivation/reoxygenation (OGD/R) treatment or normal culture conditions. Following 24 hr coculture with microglia (BV2), bEnd.3 cells were harvested for western-blotting analyses, while BV2 cells were harvested for RT-PCR assay and medium was collected for ELISA assay. (a) Transwell coculture model for evaluating OGD/R-induced changes in bEnd.3 cells and BV2 cells. (b, c) Representative western-blotting images and quantification of P-gp levels (n = 3). (d) mRNA expression levels of IL-12, IL-6, IL-4, and YM-1 measured via RT-PCR assay as fold changes relative to control treatment (n = 4). (e) Contents of IL-12, IL-6, IL-4, and YM-1 determined by ELISA assay (n = 3). One-way ANOVA followed by the post hoc least significant difference test or Games Howell test for (b), (c), and (e). Mann–Whitney test for (d). All data are mean ± SD;  P < 0.05,  ∗∗P < 0.01 between two groups.
Figure 6
Figure 6
P-glycoprotein silence or overexpress in endothelial cells regulates CCL2 expression and microglia phenotype following oxygen glucose deprivation/reoxygenation. Endothelial cells (bEnd.3) were transfected with P-glycoprotein (P-gp) or negative control (NC) siRNA, P-gp or NC pcDNA3.1 plasmid, or untransfected, and then subjected to either oxygen glucose deprivation/reoxygenation (OGD/R) treatment or normal culture conditions. Following 24 hr coculture with microglia (BV2), cells were harvested for RT-PCR assay and medium was collected for ELISA assay. (a, c) mRNA expression levels of CD16, iNOS, CD206, Arg-1 (in BV2 cells), CCL2, and CCR2 (in bEnd.3 cells) measured via RT-PCR assay as fold changes relative to control treatment (n = 4). (b, d) Contents of CD16, iNOS, CD206, Arg-1, and CCL2 in Transwell systems determined by ELISA assay (n = 3). Mann–Whitney test for (a) and (c). One-way ANOVA followed by the post hoc least significant difference test or Games Howell test for (b) and (d). All data are mean ± SD;  P < 0.05,  ∗∗P < 0.01 between two groups.
Figure 7
Figure 7
P-glycoprotein silence or overexpress in endothelial cells alters microglial polarization following oxygen glucose deprivation/reoxygenation. Endothelial cells (bEnd.3) were transfected with P-glycoprotein (P-gp) or negative control (NC) siRNA, P-gp or NC pcDNA3.1 plasmid, or untransfected, and then subjected to either oxygen glucose deprivation/reoxygenation (OGD/R) treatment or normal culture conditions. Following 24 hr coculture with microglia (BV2), BV2 cells were harvested for immunofluorescence assay. (a) Representative immunofluorescence staining images and quantification of microglial polarization status markers (CD16, iNOS, CD206, and Arg-1) expressions (n = 3). (b) Quantification of CD16, iNOS, CD206, and Arg-1 expressions (n = 3). Scale bars, 100 μm. One-way ANOVA followed by the post hoc least significant difference test. All data are mean ± SD;  ∗∗P < 0.01 between two groups.
Figure 8
Figure 8
P-glycoprotein silence or overexpress in endothelial cells regulates GR nuclear translocation and further GMD activation following oxygen glucose deprivation/reoxygenation. Endothelial cells (bEnd.3) were transfected with P-glycoprotein (P-gp) or negative control (NC) siRNA, P-gp or NC pcDNA3.1 plasmid, or untransfected, and then subjected to either oxygen glucose deprivation/reoxygenation (OGD/R) treatment or normal culture conditions. BEnd.3 cells were harvested for immunofluorescence and western-blotting assays. (a, b) Representative immunofluorescence staining images and quantification of nuclear and cytoplasmic localization (ratio of nuclear to cytoplasmic location) of GR (n = 3). (c–e) Representative western-blotting images and quantifications of cytoplasm GR and nucleus GR expressions (n = 3). (f, g) Representative western-blotting images and quantifications of DCP1A, UPF1, and PNRC2 expressions (n = 3). Scale bars, 100 μm. One-way ANOVA followed by the post hoc least significant difference tests. All data are mean ± SD;  ∗∗P < 0.01 between two groups.
Figure 9
Figure 9
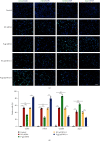
Glucocorticoid receptor silence abolishes the influence of P-glycoprotein manipulation on inflammatory cytokines and microglial polarization following oxygen glucose deprivation/reoxygenation. Endothelial cells (bEnd.3) were transfected with P-glycoprotein (P-gp) and glucocorticoid receptor (GR) siRNA, P-gp pcDNA3.1 plasmid and GR siRNA, individual negative control siRNA, or untransfected, and then subjected to either oxygen glucose deprivation/reoxygenation (OGD/R) treatment or normal culture conditions. Following 24 hr coculture with microglia (BV2), bEnd.3 cells were harvested for immunofluorescence assay, while BV2 cells were harvested for RT-PCR assay and medium was collected for ELISA assay. (a, b) Representative immunofluorescence staining images and quantification of GR expression (n = 3). (c, d) mRNA expression levels of M1 and M2 markers measured via RT-PCR assay as fold changes relative to control treatment (n = 4). (e) mRNA expression level of CCL2 measured via RT-PCR assay as fold changes relative to control treatment (n = 4) and content of CCL2 determined by ELISA assay (n = 3). Scale bars, 100 μm. One-way ANOVA followed by the post hoc least significant difference test or Games Howell test for (b) and (e). Mann–Whitney test for (c), (d), and (e). All data are mean ± SD;  P < 0.05,  ∗∗P < 0.01 between two groups.

Similar articles

References

    1. Hankey G. J., Jamrozik K., Broadhurst R. J., Forbes S., Anderson C. S. Long-term disability after first-ever stroke and related prognostic factors in the perth community stroke study, 1989–1990. Stroke . 2002;33(4):1034–1040. doi: 10.1161/01.STR.0000012515.66889.24. - DOI - PubMed
    1. Feigin V. L., Brainin M., Norrving B., et al. World Stroke Organization (WSO): global stroke fact sheet 2022. International Journal of Stroke . 2022;17(1):18–29. doi: 10.1177/17474930211065917. - DOI - PubMed
    1. Khandelwal P., Yavagal D. R., Sacco R. L. Acute ischemic stroke intervention. Journal of the American College of Cardiology . 2016;67(22):2631–2644. doi: 10.1016/j.jacc.2016.03.555. - DOI - PubMed
    1. Feske S. K. Ischemic stroke. The American Journal of Medicine . 2021;134(12):1457–1464. doi: 10.1016/j.amjmed.2021.07.027. - DOI - PubMed
    1. Maida C. D., Norrito R. L., Daidone M., Tuttolomondo A., Pinto A. Neuroinflammatory mechanisms in ischemic stroke: focus on cardioembolic stroke, background, and therapeutic approaches. International Journal of Molecular Sciences . 2020;21(18) doi: 10.3390/ijms21186454.6454 - DOI - PMC - PubMed

MeSH terms

Substances