. 2023 Dec:50:101534.
doi: 10.1016/j.ejrh.2023.101534.

Increasing volatility of reconstructed Morava River warm-season flow, Czech Republic

Affiliations

Increasing volatility of reconstructed Morava River warm-season flow, Czech Republic

Max C A Torbenson et al. J Hydrol Reg Stud. 2023 Dec.

Abstract

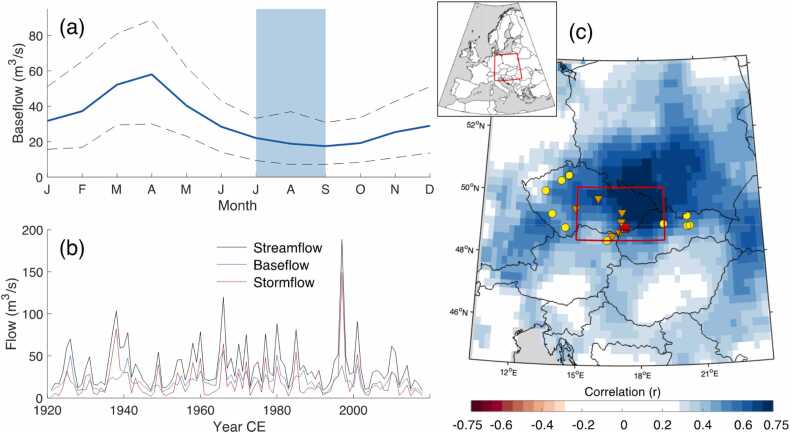
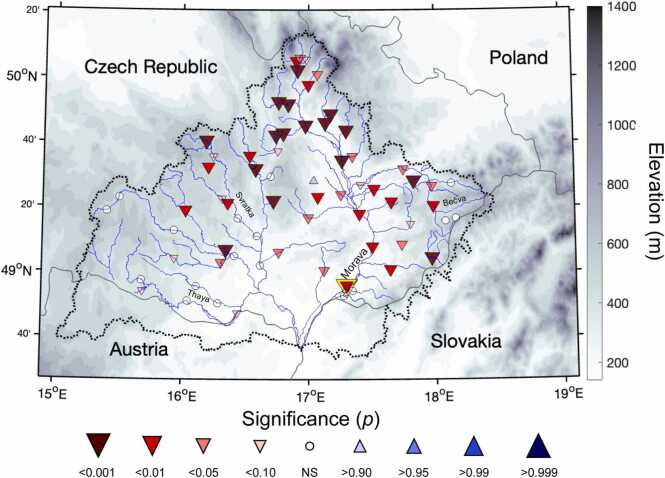
Study region: The Morava River basin, Czech Republic, Danube Basin, Central Europe.

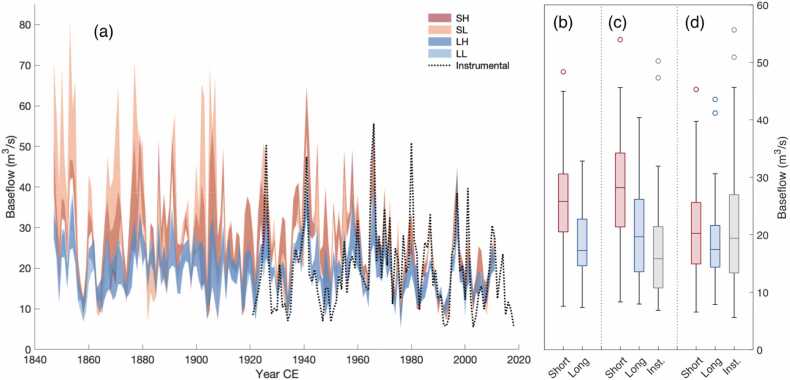
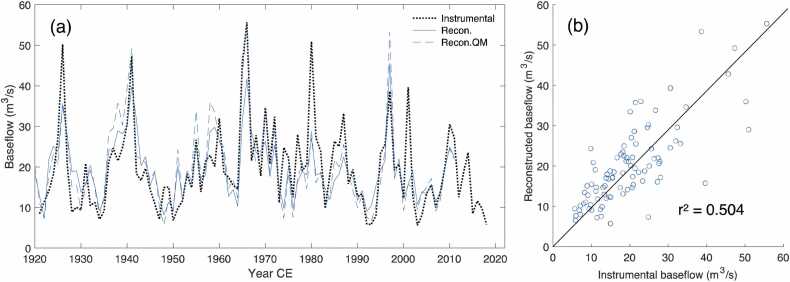
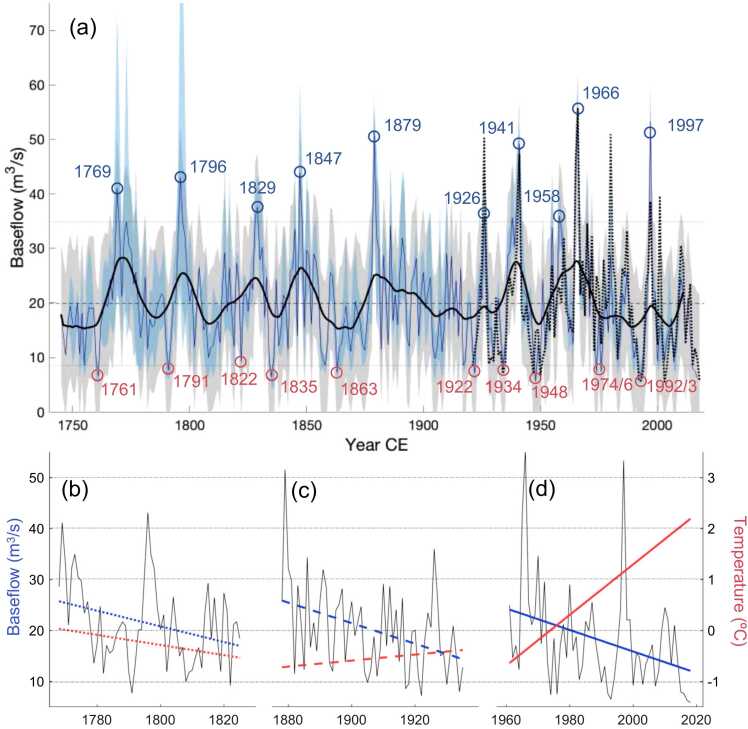
Study focus: Hydrological summer extremes represent a prominent natural hazard in Central Europe. River low flows constrain transport and water supply for agriculture, industry and society, and flood events are known to cause material damage and human loss. However, understanding changes in the frequency and magnitude of hydrological extremes is associated with great uncertainty due to the limited number of gauge observations. Here, we compile a tree-ring network to reconstruct the July-September baseflow variability of the Morava River from 1745 to 2018 CE. An ensemble of reconstructions was produced to assess the impact of calibration period length and trend on the long-term mean of reconstruction estimates. The final estimates represent the first baseflow reconstruction based on tree rings from the European continent. Simulated flows and historical documentation provide quantitative and qualitative validation of estimates prior to the 20th century.

New hydrological insights for the region: The reconstructions indicate an increased variability of warm-season flow during the past 100 years, with the most extreme high and low flows occurring after the start of instrumental observations. When analyzing the entire reconstruction, the negative trend in baseflow displayed by gauges across the basin after 1960 is not unprecedented. We conjecture that even lower flows could likely occur in the future considering that pre-instrumental trends were not primarily driven by rising temperature (and the evaporative demand) in contrast to the recent trends.

Keywords: Baseflow; Extremes; Morava; Reconstruction; Tree rings.


Conflict of interest statement

The authors declare the following financial interests/personal relationships which may be considered as potential competing interests: Max Torbenson reports financial support was provided by European Research Council. Jan Esper, Ulf Buentgen reports financial support was provided by European Research Council. Michal Rybnicek, Tomas Kolar reports financial support was provided by Czech Grant Agency. James Stagge reports financial support was provided by National Science Foundation. Miroslav Trnka, Jan Esper, Ulf Buentgen, Milan Fischer reports financial support was provided by Ministry of Education Youth and Sports of the Czech Republic.

Figures

Fig. 1
Fig. 1
(a) Baseflow climatology of the Morava River at Strážnice for 1921–2018, with dashed lines representing the 5th and 95th percentiles. (b) Timeseries of instrumental JAS streamflow, baseflow, and stormflow at Strážnice. (c) Mapped correlations of July-September (JAS) baseflow at Strážnice (red marker) and gridded April-August precipitation data from the E-OBS network (Cornes et al., 2018) for 1950–2018. The red box outlines a general region of the Morava River catchment. Yellow circles indicate the location of the tree-ring records used in the final reconstruction, orange triangles the location of stable isotope materials. Red square indicates the location of the Strážnice gauge.
Fig. 2
Fig. 2
Significance of linear trend (Mann-Kendall test) in JAS baseflow for 70 gauges in the Morava River basin (dotted black line), calculated for the period 1961–2018. Strážnice is indicated by a yellow outline.
Fig. 3
Fig. 3
(a) Ranges of reconstruction estimates based on the four groups of predictors are plotted for the shortest nest (1848–2011). The reconstruction estimates of the strongest calibration model for each calibration length (red/blue) and the instrumental values (gray) are summarized for the periods 1848–1920 (b), 1921–1960 (c), and 1961–2011 (d). For explanations of SH, SL, LH, and LL see 2.4.
Fig. 4
Fig. 4
(a) The time series comparison between instrumental and reconstructed JAS Morava River baseflow. The bias corrected reconstruction (QM) is also plotted. (b) The relationship between instrumental and bias corrected reconstructed baseflow.
Fig. 5
Fig. 5
(a) Reconstructed (blue) and instrumental (dotted black) Morava River baseflow for July-September at Strážnice. The dashed line represents the instrumental mean for the calibration period (1921–2018) and the dotted horizontal lines show the 5th and 95th percentile of the full reconstruction (1745–2018). Gray shading indicates the prediction interval (95%), and blue shading indicates the spread of estimates of the different nests. Years of extreme high and low baseflows (Table 3) are highlighted. (b-d) Reconstructed baseflow is plotted in black for three 58-year periods with significant negative trend (blue). Linear fits of JJA temperature (of Dobrovolný et al., 2010 and Brázdil et al., 2022) for the same period are plotted in red. Note that the three periods are not covering the full reconstructed period of (a).
Fig. 6
Fig. 6
Return intervals calculated empirically for instrumental data (circles) for 1921–2018, reconstructed data (triangles) for 1921–2018, and reconstructed data (squares) for 1745–2018. White markers indicate return intervals for which the return period is greater than one-third of the length of the record analyzed. The GEV fits are plotted as dotted (instrumental), dashed (reconstructed, 1921–2018), and solid (reconstructed, 1745–2018) lines.

References

    1. Alfieri L., Burek P., Feyen L., Forzieri G. Global warming increases the frequency of river floods in Europe. Hydrol. Earth Syst. Sci. 2015;19:2247–2260. doi: 10.5194/hess-19-2247-2015. - DOI
    1. Bastos A., et al. Impacts of extreme summers on European ecosystems: a comparative analysis of 2003, 2010, and 2018. Philos. Trans. R. Soc. B. 2020;375 doi: 10.1098/rtsb.2019.0507. - DOI - PMC - PubMed
    1. Blöschl G., et al. Changing climate both increases and decreases European river floods. Nature. 2019;573:108–111. doi: 10.1038/s41586-019-1495-6. - DOI - PubMed
    1. Blöschl G., et al. Current European flood-rich period exceptional compared with past 500 years. Nature. 2020;583:560–566. doi: 10.1038/s41586-020-2478-3. - DOI - PubMed
    1. Bozdogan H. Model selection and Akaike’s Information Criterion (AIC): The general theory and its analytical extensions. Psychometrika. 1987;52:345–370. doi: 10.1007/BF02294361. - DOI

LinkOut - more resources