. 2023 Dec 7:17:1282841.
doi: 10.3389/fncel.2023.1282841. eCollection 2023.

Astrocytes control hippocampal synaptic plasticity through the vesicular-dependent release of D-serine

Affiliations

Astrocytes control hippocampal synaptic plasticity through the vesicular-dependent release of D-serine

Daniela Sofia Abreu et al. Front Cell Neurosci. .

Abstract

Astrocytes, the most abundant glial cells in the central nervous system (CNS), sense synaptic activity and respond through the release of gliotransmitters, a process mediated by intracellular Ca2+ level changes and SNARE-dependent mechanisms. Ionotropic N-methyl-D-aspartate (NMDA) receptors, which are activated by glutamate along with D-serine or glycine, play a crucial role in learning, memory, and synaptic plasticity. However, the precise impact of astrocyte-released D-serine on neuronal modulation remains insufficiently characterized. To address this, we have used the dominant negative SNARE (dnSNARE) mouse model, which selectively inhibits SNARE-dependent exocytosis from astrocytes. We recorded field excitatory postsynaptic potentials (fEPSPs) in CA3-CA1 synapses within hippocampal slices obtained from dnSNARE mice and wild-type (Wt) littermates. Our results demonstrate that hippocampal θ-burst long-term potentiation (LTP), a critical form of synaptic plasticity, is impaired in hippocampal slices from dnSNARE mice. Notably, this LTP impairment was rescued upon incubation with D-serine. To further investigate the involvement of astrocytes in D-serine-mediated mechanisms of LTP maintenance, we perfused hippocampal slices with L-serine - a substrate used by both neurons and astrocytes for D-serine production. The enhancement in LTP observed in dnSNARE mice was exclusively associated with D-serine presence, with no effects evident in the presence of L-serine. Additionally, both D- and L-serine reduced basal synaptic strength in the hippocampal slices of both Wt and dnSNARE mice. These results provide compelling evidence that distinct processes underlie the modulation of basal synaptic transmission and LTP through D-serine. Our findings underscore the pivotal contribution of astrocytes in D-serine-mediated processes that govern LTP establishment and basal transmission. This study not only provides essential insights into the intricate interplay between neurons and astrocytes but also emphasizes their collective role in shaping hippocampal synaptic function.

Keywords: astrocyte; d-serine; gliotransmission; synaptic plasticity; tripartite synapse.


Conflict of interest statement

The authors declare that the research was conducted in the absence of any commercial or financial relationships that could be construed as a potential conflict of interest.

Figures

FIGURE 1
FIGURE 1
dnSNARE transgene expression is astrocyte-specific. (A) The GFAP.tTA mice line carries the human GFAP promoter that drives the expression of tTA, while the tetO.dnSNARE mice line contains a dnSNARE domain, that corresponds to the cytosolic portion of synaptobrevin, along with the EGFP reporter gene, regulated by a tetO operator promotor. Dox administration via drinking water inhibits the transcription of the dnSNARE domain, allowing functional SNARE-dependent release of gliotransmitters. In contrast, in the absence of Dox, the tetO promoter drives the expression of the dnSNARE, resulting in compromised astrocytic vesicular release. (B) Western blots of hippocampal slices tissue samples from dnSNARE and Wt mice depict immunoreactive bands for GFP (27 kDa) and GAPDH (loading control; 37 kDa) (Top panel). The histogram shows membrane intensity of the ratio of GFP/GAPDH (n = 10–14 animals per group). All values are presented as mean ± S.E.M. from n independent observations. Statistical significance was assessed by unpaired t-test. Representative confocal images of (C) GFP reporter transgene (green) with GFAP (red) and DAPI (blue) in the dorsal CA1 of Wt mice (n = 2 mice), of (D) GFP reporter transgene (green) with GFAP (red) and DAPI (blue) in the dorsal CA1 of dnSNARE mice (n = 2 mice), and (E) GFP reporter transgene (green) with βIII-tubulin (red) and DAPI (blue) in the dorsal CA1 of dnSNARE mice (n = 2 mice). Scale bars = 100 μm.
FIGURE 2
FIGURE 2
Blocking astrocytic gliotransmission decreases LTP. (A) Time course of changes in fEPSP slope after θ-burst stimulation in hippocampal slices from Wt (n = 5) and dnSNARE mice (n = 5). Representative traces of fEPSPs before (dashed line) and after (bold line) stimulation are displayed above. Scale bar: 5 ms (horizontal), 0.5 mV (vertical). The blue highlighted column represents LTP (B), while the gray highlighted column corresponds to PTP (C). (B) Comparison of the magnitude of LTP induced by the θ-burst stimulation. (C) Comparison of PTP magnitude. (D) PPF ratio obtained from Wt (n = 4) and dnSNARE mice (n = 4). On the left are illustrated representative tracings of PPF obtained from slices from Wt (bold line) and dnSNARE mice (dashed line). Scale bar: 25 ms (horizontal), 0.5 mV (vertical). (E) I/O curves showing how fEPSP slope changes with different stimulation intensities (60–320 μA) in hippocampal slices from Wt (n = 4) and dnSNARE mice (n = 4). All values are presented as mean ± S.E.M. of n independent experiments. Statistical significance was assessed by unpaired t-test.
FIGURE 3
FIGURE 3
D-serine decreases LTP in Wt animals while increasing PTP and decreasing basal synaptic transmission in animals with compromised gliotransmission. (A) Time course of changes in fEPSP slope after θ-burst stimulation in hippocampal slices from Wt mice perfused with D-serine (n = 9) with respective controls (n = 5). The blue highlighted column represents LTP (C), while the gray highlighted column corresponds to PTP (D). Representative traces of fEPSPs before (dashed line) and after (bold line) stimulation are displayed above. Scale bar: 5 ms (horizontal), 0.5 mV (vertical). (B) Time course of changes in fEPSP slope after θ-burst stimulation in hippocampal slices from dnSNARE mice perfused with D-serine (n = 7) with respective controls (n = 5). Representative traces of fEPSPs before (dashed line) and after (bold line) stimulation are displayed above. (C) Comparison of the magnitude of LTP induced by the θ-burst stimulation in the presence and absence of D-serine for Wt and dnSNARE perfused hippocampal slices. (D) Comparison of PTP magnitude induced by the θ-burst stimulation in the presence and absence of D-serine for Wt and dnSNARE perfused hippocampal slices. (E) PPF ratio obtained from Wt (Wt controls n = 4, Wt + D-serine 10 μM n = 8) and dnSNARE mice (dnSNARE controls n = 4, dnSNARE + D-serine 10 μM n = 9). On the left are illustrated representative tracings of PPF obtained from slices from Wt (bold line) and dnSNARE mice (dashed line) in the presence and absence of D-serine. Scale bar: 25 ms (horizontal), 0.5 mV (vertical). (F) I/O curves derived from Wt mice hippocampal slices perfused with D-serine (n = 7) or without (n = 4) showing how fEPSP slope changes with different stimulation intensities (60–320 μA). (G) I/O curves derived from dnSNARE mice hippocampal slices perfused with D-serine (n = 7) or without (n = 4). All values are presented as mean ± S.E.M. of n independent experiments. Statistical significance was assessed by unpaired t-test.
FIGURE 4
FIGURE 4
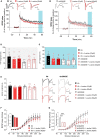
L-serine does not affect LTP nor short forms of synaptic plasticity but increases basal synaptic transmission in animals with compromised gliotransmission. (A) Time course of changes in fEPSP slope after θ-burst stimulation in hippocampal slices from Wt mice perfused with 10 μM (n = 8) and 50 μM of L-serine (n = 7) with respective controls (n = 6). The blue highlighted column represents LTP (C), while the gray highlighted column corresponds to PTP (D). Representative traces of fEPSPs before (dashed line) and after (bold line) stimulation are displayed above. Scale bar: 5 ms (horizontal), 0.5 mV (vertical). (B) Time course of changes in fEPSP slope after θ-burst stimulation in hippocampal slices from dnSNARE mice perfused with 10 μM (n = 8) and 50 μM of L-serine (n = 7), and the respective controls (n = 6). Representative traces of fEPSPs before (dashed line) and after (bold line) stimulation are displayed above. (C) Comparison of the magnitude of LTP induced by the θ-burst stimulation in the presence and absence of L-serine for Wt and dnSNARE perfused hippocampal slices. (D) Comparison of PTP magnitude induced by the θ-burst stimulation in the presence and absence of L-serine for Wt and dnSNARE perfused hippocampal slices. (E) PPF ratio obtained without (Wt, n = 4; dnSNARE, n = 6) and after perfusion with 10 μM (Wt, n = 7; dnSNARE, n = 6) and 50 μM (Wt, n = 5; dnSNARE, n = 7) of L-serine. On the left are illustrated representative tracings of PPF obtained from slices from Wt (bold line) and dnSNARE mice (dashed line) in the presence and absence of the different concentrations of L-serine. Scale bar: 25 ms (horizontal), 0.5 mV (vertical). (F) I/O curves derived from Wt mice hippocampal slices perfused with 10 μM of L-serine (n = 6), 50 μM of L-serine (n = 4), and the respective controls (n = 6) showing how fEPSP slope changes with different stimulation intensities (60–320 μA). (G) I/O curves derived from dnSNARE mice hippocampal slices perfused with 10 μM of L-serine (n = 6), 50 μM of L-serine (n = 4), and the respective controls (n = 6) All values are presented as mean ± S.E.M. of n independent experiments. Statistical significance was assessed by One-way ANOVA followed by Holm-Sidak’s post-hoc test for multiple comparisons.

References

    1. Albensi B. C., Oliver D. R., Toupin J., Odero G. (2007). Electrical stimulation protocols for hippocampal synaptic plasticity and neuronal hyper-excitability: Are they effective or relevant? Exp. Neurol. 204 1–13. 10.1016/j.expneurol.2006.12.009 - DOI - PubMed
    1. Anderson W. W., Collingridge G. L. (2001). The LTP Program: A data acquisition program for on-line analysis of long-term potentiation and other synaptic events. J. Neurosci. Methods 108, 71–83. 10.1016/s0165-0270(01)00374-0 - DOI - PubMed
    1. Angulo M. C., Kozlov A. S., Charpak S., Audinat E. (2004). Glutamate released from glial cells synchronizes neuronal activity in the hippocampus. J. Neurosci. 24 6920–6927. 10.1523/JNEUROSCI.0473-04.2004 - DOI - PMC - PubMed
    1. Araque A., Carmignoto G., Haydon P. G., Oliet S. H., Robitaille R., Volterra A. (2014). Gliotransmitters travel in time and space. Neuron 81 728–739. 10.1016/j.neuron.2014.02.007 - DOI - PMC - PubMed
    1. Benneyworth M. A., Li Y., Basu A. C., Bolshakov V. Y., Coyle J. T. (2012). Cell selective conditional null mutations of serine racemase demonstrate a predominate localization in cortical glutamatergic neurons. Cell. Mol. Neurobiol. 32 613–624. 10.1007/s10571-012-9808-4 - DOI - PMC - PubMed

LinkOut - more resources