. 2024 Feb 1;326(2):C487-C504.
doi: 10.1152/ajpcell.00600.2023. Epub 2023 Dec 25.

Cenicriviroc prevents dysregulation of astrocyte/endothelial cross talk induced by ischemia and HIV-1 via inhibiting the NLRP3 inflammasome and pyroptosis

Affiliations

Cenicriviroc prevents dysregulation of astrocyte/endothelial cross talk induced by ischemia and HIV-1 via inhibiting the NLRP3 inflammasome and pyroptosis

Nikolai Fattakhov et al. Am J Physiol Cell Physiol. .

Abstract

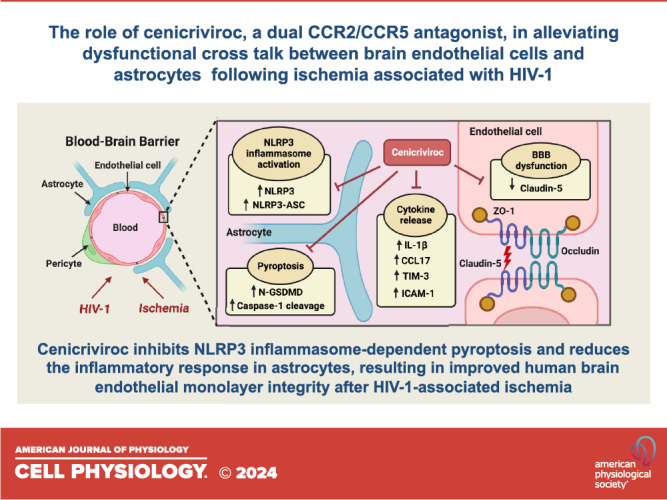
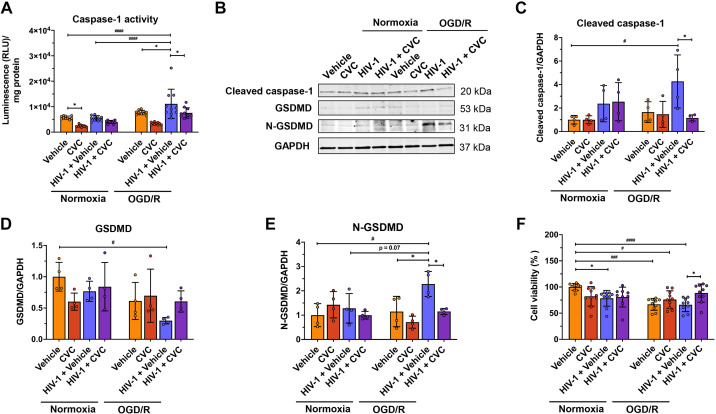
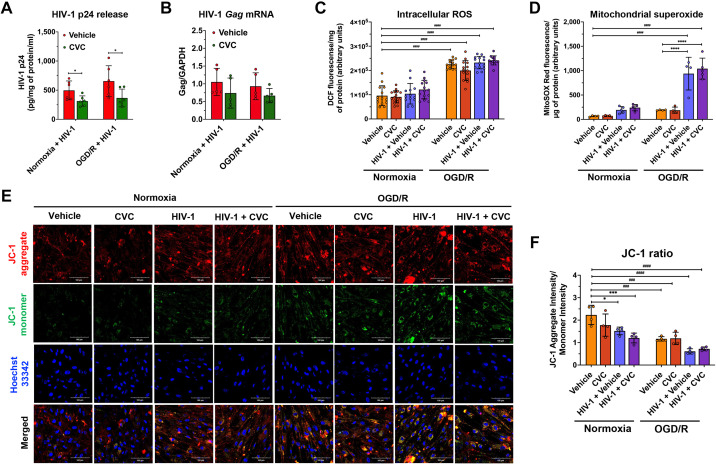
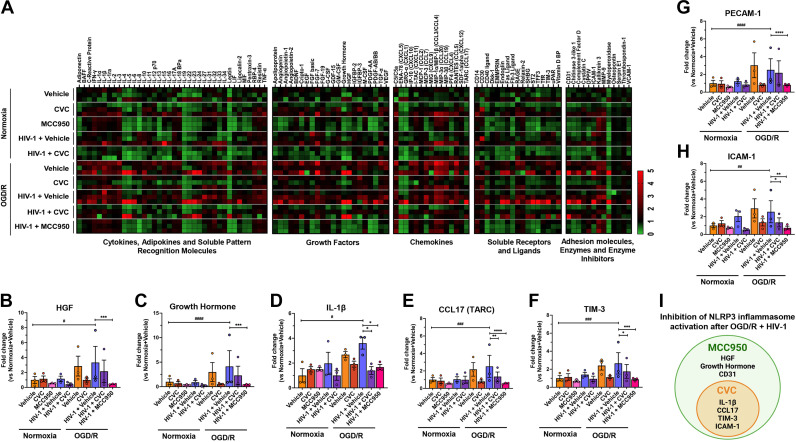
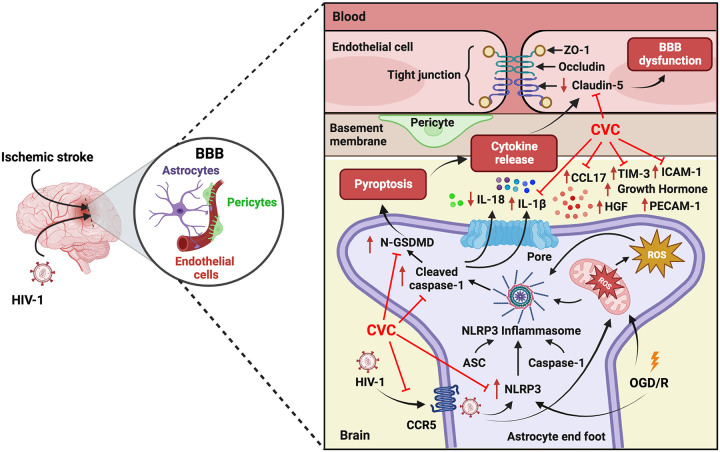
Blood-brain barrier (BBB) breakdown is one of the pathophysiological characteristics of ischemic stroke, which may contribute to the progression of brain tissue damage and subsequent neurological impairment. Human immunodeficiency virus (HIV)-infected individuals are at greater risk for ischemic stroke due to diminished immune function and HIV-associated vasculopathy. Studies have shown that astrocytes are involved in maintaining BBB integrity and facilitating HIV-1 infection in the brain. The present study investigated whether targeting astrocyte-endothelial cell signaling with cenicriviroc (CVC), a dual chemokine receptor (CCR)2 and CCR5 antagonist, may protect against dysregulation of cross talk between these cells after oxygen-glucose deprivation/reoxygenation (OGD/R) combined with HIV-1 infection. Permeability assay with 10 kDa fluorescein isothiocyanate (FITC)-dextran demonstrated that CVC alleviated endothelial barrier disruption in noncontact coculture of human brain microvascular endothelial cells (HBMECs) with HIV-1-infected human astrocytes, and reversed downregulation of tight junction protein claudin-5 induced by OGD/R- and HIV-1. Moreover, CVC attenuated OGD/R- and HIV-1-triggered upregulation of the NOD-like receptor protein-3 (NLRP3) inflammasome and IL-1β secretion. Treatment with CVC also suppressed astrocyte pyroptosis by attenuating cleaved caspase-1 levels and the formation of cleaved N-terminal GSDMD (N-GSDMD). Secretome profiling revealed that CVC ameliorated secretion levels of chemokine CC chemokine ligand 17 (CCL17), adhesion molecule intercellular adhesion molecule-1 (ICAM-1), and T cell activation modulator T cell immunoglobulin and mucin domain 3 (TIM-3) by astrocytes synergistically induced by OGD/R and HIV-1. Overall, these results suggest that CVC contributes to restoring astrocyte-endothelial cross interactions in an astrocyte-dependent manner via protection against NLRP3 activation and pyroptosis.NEW & NOTEWORTHY The present study reveals the role of astrocytic NOD-like receptor protein-3 (NLRP3) inflammasome in dysfunctional astrocyte-endothelial cross interactions triggered in response to oxygen/glucose deprivation injury associated with human immunodeficiency virus type 1 (HIV-1) infection. Our results suggest that blocking NLRP3 inflammasome activation and pyroptosis-mediated inflammation with cenicriviroc (CVC) may constitute a potentially effective therapeutic strategy for blood-brain barrier (BBB) protection during HIV-1-associated ischemic stroke.

Keywords: HIV-1; NLRP3 inflammasome; blood-brain barrier; ischemia and reperfusion; ischemic stroke.


Conflict of interest statement

No conflicts of interest, financial or otherwise, are declared by the authors.

Figures

None
Graphical abstract
Figure 1.
Figure 1.
The impact of cenicriviroc (CVC) on human immunodeficiency virus type 1 (HIV-1) infection in primary human astrocytes. A: quantification of p24 release following infection with HIV-1 JR-CSF (R5), YU-2 (R5), and NL4-3 (X4) HIV-1 strains. All infections of astrocytes were performed by adding the same amount of virus (60 ng p24 HIV-1/mL) to the cell culture medium for 12 h. Then, the virus was washed out, a fresh medium was added, and aliquots of culture medium were collected over time to measure the p24 levels. Data represent means ± SD (n = 6). *P < 0.05, **P < 0.01 compared with the NL4-3 strain; #P < 0.05, ####P < 0.0001 compared with the YU-2 strain. BD: evaluation of CVC antiviral activity against different HIV-1 strains in primary human astrocytes. Cells were infected with HIV-1 NL4-3 (B), YU-2 (C), and JR-CSF (D) in the presence of CVC (1 μM) or vehicle (0.1% DMSO). Cell cultures were washed after 12 h of infection and resuspended in 1 mL of fresh medium containing CVC or vehicle to maintain constant drug/vehicle levels for the duration of the experiment. HIV-1 p24 levels in the supernatants were determined at the indicated time points. Note that CVC effectively protected against astrocyte infection by the JR-CSF strain. Data represent means ± SD (n = 6). *P < 0.05, **P < 0.01, ***P < 0.001 compared with JR-CSF strain treated with vehicle. OGD/R, oxygen-glucose deprivation/reoxygenation.
Figure 2.
Figure 2.
The protective effect of cenicriviroc (CVC) on endothelial integrity following oxygen-glucose deprivation/reoxygenation (OGD/R)- and human immunodeficiency virus type 1 (HIV-1) infection in noncontact coculture model with human astrocytes. A: flowchart showing the experimental timeline. Astrocytes were infected by the HIV-1 strain JR-CSF (60 ng p24 HIV-1/mL) for 12 h, followed by 2 h of OGD and 24 h of reoxygenation. When reoxygenation was initiated, human astrocytes were immediately treated with CVC (1 μM). Figure created with BioRender (www.BioRender.com). B: effect of CVC on endothelial permeability after OGD/R exposure and HIV-1 infection of astrocytes. Permeability was assessed by adding 10 kDa fluorescein isothiocyanate (FITC)-dextran (0.1 mg/mL) to the upper compartment of the Transwell system, followed by spectrophotometric measurement of its passage through human brain microvascular endothelial cell (HBMEC) monolayers into the lower compartment for 1 h. Data represent means ± SD (n = 10). *P < 0.05 and ***P < 0.001 vs. vehicle-treated groups; ####P < 0.0001 vs. normoxic groups. C: representative images of Western blots for the tight junction (TJ) proteins zona occludens 1 (ZO-1), occludin, and claudin-5. DF: quantification of TJ proteins by Western blot. Bar graphs illustrating ZO-1 (D), occludin (E), and claudin-5 (F) protein levels quantified by densitometry in HBMECs cocultured with human astrocytes. All protein expression levels were normalized to glyceraldehyde-3-phosphate dehydrogenase (GAPDH) protein level and presented relative to normoxic vehicle control. Data represent means ± SD (n = 4). #P < 0.05 vs. normoxic groups; **P < 0.01 vs. vehicle-treated groups. G: effect of MCC950 on endothelial permeability following the combination of OGD/R exposure and HIV-1 infection of astrocytes. The NLRP3 inhibitor MCC950 (10 μM) was added to the cell culture medium after OGD/R and maintained for 24 h. Then, permeability was assessed as in (B). Data represent means ± SD (n = 11 or 12). ****P < 0.0001 vs. vehicle-treated groups; ####P < 0.0001 vs. normoxic groups.
Figure 3.
Figure 3.
Cenicriviroc (CVC) inhibits NOD-like receptor protein-3 (NLRP3) inflammasome expression and reduces increased NLRP3 colocalization with apoptosis-associated speck-like protein containing a caspase recruitment domain (ASC) induced by the combination of Oxygen-glucose deprivation/reoxygenation (OGD/R) and human immunodeficiency virus type 1 (HIV-1) infection in human astrocytes. A: representative Western blots showing the effects of CVC on the NLRP3 inflammasome proteins NLRP3, ASC, and caspase-1 in human astrocytes exposed to OGD/R in the presence or absence of HIV-1 infection. BD: quantification of NLRP3 inflammasome proteins by Western blot. Bar graphs illustrating NLRP3 (B), ASC (C), and caspase-1 (D) protein levels quantified by densitometry. All protein expression levels were normalized to GAPDH protein level and presented relative to normoxic vehicle control. Data represent means ± SD (n = 4). *P < 0.05 and ***P < 0.001 vs. vehicle-treated groups; ##P < 0.01 and ###P < 0.001 vs. normoxic groups. E and F: interleukin (IL)-1β (E) and IL-18 (F) release from human astrocytes exposed to OGD/R in the presence or absence of HIV-1 infection and treated with CVC during reoxygenation. IL-1β (n = 9 or 10) and IL-18 (n = 7–10) levels were determined by enzyme-linked immunosorbent assay (ELISA) and normalized to the total cellular protein contents as determined by Pierce BCA protein assay. Data represent means ± SD. *P < 0.05 vs. vehicle-treated groups; ##P < 0.01 vs. normoxic groups. G: representative confocal immunofluorescence staining images of NLRP3 (green), ASC (red), and nuclei (blue). Scale bar: 50 μm. H: quantification of the Mander’s overlap coefficient was carried out using cellSens software to assess the colocalization of signals from NLRP3 and ASC immunofluorescence staining displayed in G. Data represent means ± SD (n = 4). *P < 0.05 vs. vehicle-treated groups; ####P < 0.0001 vs. normoxic groups.
Figure 4.
Figure 4.
Cenicriviroc (CVC) suppresses caspase-1/gasdermin D (GSDMD)-mediated pyroptosis in oxygen-glucose deprivation/reoxygenation (OGD/R) combined with human immunodeficiency virus type 1 (HIV-1) infection in human astrocytes. A: the effects of CVC on caspase-1 activity as measured by Caspase-Glo 1 Inflammasome Assay (1:1 ratio of Caspase-Glo 1 Reagent volume/sample volume) and normalized to the total cellular protein content in each sample. RLU, relative luminescence units. Data represent means ± SD (n = 10). *P < 0.05 vs. vehicle-treated groups; ####P < 0.0001 vs. normoxic groups. B: representative Western blots showing the effects of CVC on the pyroptotic markers, such as cleaved caspase-1, gasdermin D (GSDMD), and N-terminal fragment of GSDMD (N-GSDMD). CE: quantification of pyroptosis-related proteins by Western blot. Bar graphs illustrating cleaved caspase-1 (C), GSDMD (D), and N-GSDMD (E) protein levels quantified by densitometry, normalized to GAPDH, and presented relative to the normoxic vehicle control. Data represent means ± SD (n = 4). *P < 0.05 vs. vehicle-treated groups; #P < 0.05 vs. normoxic groups. F: the effects of CVC on cell viability as measured by the Cell Counting Kit-8 (CCK-8) assay. Data represent means ± SD (n = 9 or 10). *P < 0.05 vs. vehicle-treated groups; #P < 0.05 vs. normoxic groups. *P < 0.05 vs. vehicle-treated groups; #P < 0.05, ###P < 0.001, ####P < 0.0001 vs. normoxic groups.
Figure 5.
Figure 5.
The influence of cenicriviroc (CVC) on human immunodeficiency virus type 1 (HIV-1) replication, oxidative stress, and mitochondrial dysfunction in primary human astrocytes after HIV-1 infection and oxygen-glucose deprivation/reoxygenation (OGD/R). A and B: the effect of CVC on viral replication, as assessed by HIV-1 p24 release (A) and HIV-1 Gag mRNA levels (B). Astrocytes were infected with the HIV-1 strain JR-CSF (60 ng p24 HIV-1/mL) for 12 h. The p24 levels (n = 6) were quantified in culture supernatants by enzyme-linked immunosorbent assay (ELISA), and the results were normalized to the total cellular protein levels. Gag mRNA levels (n = 5) were quantified using quantitative real-time PCR (qRT-PCR) with Gag-specific primers. Data represent means ± SD. *P < 0.05 vs. vehicle-treated groups. C: the impact of CVC on intracellular reactive oxygen species (ROS) levels measured by 2′,7′-dichlorofluorescin (H2DCF) fluorescence and normalized to the protein content. Data represent means ± SD (n = 13 or 14). ####P < 0.0001 vs. normoxic groups. D: the impact of CVC on mitochondrial superoxide production measured by MitoSOX Red and normalized to the protein concentration. Data represent means ± SD (n = 4–6). ****P < 0.0001 vs. vehicle-treated groups; ####P < 0.0001 vs. normoxic groups. E and F: alterations in mitochondrial transmembrane potential evaluated by JC-1 staining. Representative confocal microscopy images of JC-1-stained mitochondria (E) and quantitative analysis (F) for the assessment of the mitochondrial membrane potential. The representative images show cellular JC-1 aggregates (red fluorescence) and JC-1 monomers (green fluorescence). Nuclei were stained with Hoechst 33342 (blue fluorescence). Mitochondrial membrane potential depolarization was defined as a reduction in the ratio of JC-1 aggregates to JC-1 monomers, as indicated by changes in red/green fluorescence. Scale bar: 100 µm. Data represent means ± SD (n = 4). *P < 0.05 and ***P < 0.001 vs. vehicle-treated groups; ###P < 0.001 and ####P < 0.0001 vs. normoxic groups.
Figure 6.
Figure 6.
The treatment of primary human astrocytes with cenicriviroc (CVC) alleviates inflammatory responses triggered by the combination of oxygen-glucose deprivation/reoxygenation (OGD/R) and human immunodeficiency virus type 1 (HIV-1) infection. A: a heatmap diagram representing the cytokine secretion levels. A comprehensive secretome analysis of 105 proteins in the culture supernatants derived from human astrocytes, following exposure to OGD/R and HIV-1 infection, with or without CVC or MCC950 treatment, was conducted using a Human XL Cytokine Array Kit. Astrocyte-derived secreted factors were classified into five subsets with similar functions such as: 1) cytokines, adipokines, and soluble pattern recognition molecules, 2) growth factors, 3) chemokines, 4) soluble receptors and ligands, and 5) adhesion molecules, enzymes, and enzyme inhibitors. BH: analytes that were uniquely upregulated following exposure to OGD/R and HIV-1 infection included hepatocyte growth factor (HGF, B), growth hormone (C), interleukin (IL)-1β (D), CC chemokine ligand 17 (CCL17) (thymus and activation-regulated chemokine, TARC) (E), T-cell immunoglobulin and mucin domain 3 (TIM-3, F), platelet endothelial cell adhesion molecule-1 (PECAM-1, G), intercellular adhesion molecule-1 (ICAM-1, H). Values were determined by quantifying the positive pixels for each selected protein on the array membrane and then expressed relative to the control. Data represent means ± SE (n = 3). *P < 0.05, **P < 0.01, ***P < 0.001, ****P < 0.0001 vs. vehicle-treated groups; #P < 0.05, ##P < 0.01, ###P < 0.001, ####P < 0.0001 vs. normoxic groups. I: a Venn diagram summarizing the overlapping targets affected by CVC and MCC950 in the context of OGD/R exposure combined with HIV-1 infection.
Figure 7.
Figure 7.
A schematic overview of the proposed protective mechanisms of cenicriviroc (CVC) against dysfunctional astrocyte/endothelial cross talk induced by the combination of oxygen-glucose deprivation/reoxygenation (OGD/R) and human immunodeficiency virus type 1 (HIV-1) infection in astrocytes. OGD/R and JR-CSF HIV-1 infection synergistically activate the NOD-like receptor protein-3 (NLRP3) inflammasome, leading to Gasdermin D (GSDMD)-mediated pyroptosis and the secretion of proinflammatory factors, including hepatocyte growth factor (HGF), growth hormone, IL-1β, thymus and activation-regulated chemokine (TARC)/CC chemokine ligand 17 (CCL17), T cell immunoglobulin and mucin domain 3 (TIM-3), platelet endothelial cell adhesion molecule-1 (PECAM-1 or CD31), and intercellular adhesion molecule-1 (ICAM-1) in astrocytes. The protective impact of CVC appears to be related to the inhibition of NLRP3 expression and the excessive production of mitochondrial superoxide. This NLRP3 inflammasome-mediated astrocyte dysfunction results in increased endothelial permeability through the downregulation of claudin-5; the effect that was attenuated by CVC. The protective effect of CVC involves also the suppression of astrocytic pyroptosis through the inhibition of caspase-1 cleavage and the N-terminal domain of GSDMD (N-GSDMD). Moreover, CVC suppresses the release of specific proinflammatory mediators, including chemokine CCL17/TARC, cytokine IL-1β, adhesion molecule ICAM-1, and a soluble form of the inhibitory receptor TIM-3, which are involved in regulating T cell activation and trafficking across the BBB, as well as the immune response during viral infection. CVC-mediated attenuation of IL-18 release by astrocytes may represent a compensatory response to counteract the inflammatory effects associated with HIV-1-and/or OGD/R. Figure created with BioRender (www.BioRender.com).

Similar articles

Cited by

References

    1. Feigin VL, Brainin M, Norrving B, Martins S, Sacco RL, Hacke W, Fisher M, Pandian J, Lindsay P. World Stroke Organization (WSO): Global Stroke Fact Sheet 2022. Int J Stroke 17: 18–29, 2022. [Erratum in Int J Stroke 17: 478, 2022]. doi:10.1177/17474930211065917. - DOI - PubMed
    1. Fan J, Li X, Yu X, Liu Z, Jiang Y, Fang Y, Zong M, Suo C, Man Q, Xiong L. Global burden, risk factor analysis, and prediction study of ischemic stroke, 1990–2030. Neurology 101: e137–e150, 2023. doi:10.1212/WNL.0000000000207387. - DOI - PMC - PubMed
    1. Donkor ES. Stroke in the 21st century: a snapshot of the burden, epidemiology, and quality of life. Stroke Res Treat 2018: 3238165, 2018. doi:10.1155/2018/3238165. - DOI - PMC - PubMed
    1. Alonso A, Barnes AE, Guest JL, Shah A, Shao IY, Marconi V. HIV infection and incidence of cardiovascular diseases: an analysis of a large healthcare database. J Am Heart Assoc 8: e012241, 2019. doi:10.1161/JAHA.119.012241. - DOI - PMC - PubMed
    1. Du M, Wang Y, Qin C, Mi D, Liu M, Liu J. Prevalence and incidence of stroke among people with HIV. AIDS 37: 1747–1756, 2023. doi:10.1097/QAD.0000000000003632. - DOI - PMC - PubMed

Publication types