. 2024 Mar;11(10):e2308507.
doi: 10.1002/advs.202308507. Epub 2023 Dec 25.

Multiplexed Surface Electrode Arrays Based on Metal Oxide Thin-Film Electronics for High-Resolution Cortical Mapping

Affiliations

Multiplexed Surface Electrode Arrays Based on Metal Oxide Thin-Film Electronics for High-Resolution Cortical Mapping

Horacio Londoño-Ramírez et al. Adv Sci (Weinh). 2024 Mar.

Abstract

Electrode grids are used in neuroscience research and clinical practice to record electrical activity from the surface of the brain. However, existing passive electrocorticography (ECoG) technologies are unable to offer both high spatial resolution and wide cortical coverage, while ensuring a compact acquisition system. The electrode count and density are restricted by the fact that each electrode must be individually wired. This work presents an active micro-electrocorticography (µECoG) implant that tackles this limitation by incorporating metal oxide thin-film transistors (TFTs) into a flexible electrode array, allowing to address multiple electrodes through a single shared readout line. By combining the array with an incremental-ΔΣ readout integrated circuit (ROIC), the system is capable of recording from up to 256 electrodes virtually simultaneously, thanks to the implemented 16:1 time-division multiplexing scheme, offering lower noise levels than existing active µECoG arrays. In vivo validation is demonstrated acutely in mice by recording spontaneous activity and somatosensory evoked potentials over a cortical surface of ≈8×8 mm2 . The proposed neural interface overcomes the wiring bottleneck limiting ECoG arrays, holding promise as a powerful tool for improved mapping of the cerebral cortex and as an enabling technology for future brain-machine interfaces.

Keywords: a-IGZO; electrocorticography; electrode arrays; flexible electronics; thin-film transistors; time-division multiplexing; µECoGs.


Conflict of interest statement

The authors declare no conflict of interest.

Figures

Figure 1
Figure 1
µECoG array based on a‐IGZO thin‐film transistors. a) Exploded‐view illustration highlighting the key elements of the flexible µECoG array. b) Photograph of a released flexible µECoG array conforming to the curvature of a macaque monkey brain phantom made of agarose gel. c) Microphotograph of a 256‐channel µECoG array (16×16 pixels, 500‐µm electrode pitch and ≈1×1 cm2 array dimensions) (© 2022 IEEE. Reprinted, with permission, from[ 26 ]) and d) magnification of a single pixel, consisting of an a‐IGZO select transistor (W/L  =  300 µm/3 µm) and a gold electrode (300 µm in diameter). Transistor's gate (G), source (S), and drain (D), as well as channel width (W) and length (L) are indicated in the figure. The TFT has interdigitated source and drain contacts, with the channel width divided into three sections. e) Schematic cross‐section of the flexible µECoG array stack, including the thin‐film transistor and the recording electrode. i) SEM cross‐section of a self‐aligned a‐IGZO TFT gate stack. ii) FIB/SEM cross‐section of a gold electrode. iii) FIB/SEM cross‐section of the lateral encapsulation protecting the edges of the µECoG array. iv) SEM cross‐section of the region highlighted with the dotted red box in (iii), emphasizing the lateral encapsulation. i) – iv) include insets with a schematic cross‐section of the layers present in the SEM image.
Figure 2
Figure 2
Electrical characterization of the µECoG array and of its principal components. a) Transfer characteristics (IDS versus VGS) of free‐standing thin‐film transistors for two different channel widths (W/L  =  300 µm/3 µm, and W/L  =  50 µm/3 µm), at VDS of 100 mV. b) Bode plot (magnitude and phase) of the electrochemical impedance of various pixel designs formed by a gold electrode with and without the presence of a select transistor for two different electrode diameters (300 µm and 100 µm). c) Equivalent electrical circuit model used for the interpretation of the impedance spectra. The model corresponds to a modified version of the Randles circuit with the addition of a resistors in series (RTFT ), modeling the RON of the TFT, and a capacitance in parallel (Cpar ), accounting for parasitic capacitances. d) Lifetime assessment of a µECoG array kept in phosphate buffer saline at 37°C for up to 7 days. Electrode impedance at 1 kHz was monitored over time for electrodes with and without the presence of a switch TFT present in the same test array (300‐µm electrode diameter, W/L  =  300 µm/3 µm, n  =  5 per pixel type). e) Electrode DC offset of 8 multiplexed electrodes switched at 1 kHz. Numbers 1 to 8 represent the selected electrode.
Figure 3
Figure 3
In vitro characterization of the recording capabilities of µECoG arrays in addressing and time‐division multiplexing modes of operation. a) Schematic diagram illustrating the operation of the µECoG arrays in addressing mode, where pixels sharing the same data line can be addressed by the corresponding select line (i.e., Sel.1 and Sel.2). b) Diagram of the characterization setup in saline for a µECoG array in addressing mode and c) corresponding in vitro recordings. A probe formed by two subarrays of electrodes was employed, in which data lines were shared between pairwise electrodes located in each of the subarrays. Each subarray incorporated 30 multiplexed electrodes (100 µm in diameter, transistor dimensions of W/L  =  50 µm/3 µm), along with an additional electrode without a TFT (100 µm in diameter). The subarrays were placed in separate solutions, receiving distinct sinusoidal input signals (Vin 1  =  1 mVpp, 100 Hz, and Vin 2  =  1 mVpp, 160 Hz). Activating one of the select lines enabled recording from all 30 multiplexed electrodes from the respective subarray. Additionally, the two electrodes without TFTs (red dashed rectangle), each located in a different subarray, continuously recorded from the corresponding solutions, independently of the activated select line. Three defective pixels are marked with a red star. d) Schematic diagram illustrating the operation of the µECoG arrays in time‐division multiplexing mode. Pixels sharing the same data line are switched rapidly by applying pulse trains to the select lines (i.e., Sel.1 to Sel.16), allowing to record signals from all multiplexed electrodes virtually simultaneously. e) Diagram of the characterization setup in saline for a µECoG array in combination with the ROIC operating in time‐division multiplexing mode. A 256‐channel µECoG array was employed (16 × 16 pixels, 300‐µm electrode diameter, transistor dimensions W/L  =  300 µm/3 µm). All electrodes were placed in the same saline solution (Vin  =  1 mVpp, 100 Hz) and signals from the multiplexed data lines were recorded using the dedicated ROIC. f) Output from one super‐channel recording 16 multiplexed pixels sharing a single data line, and g) corresponding demultiplexed signals. h) RMS values measured for the full array for a 1 mVpp (0.35 mVrms) input signal. i) Histogram of the input‐referred noise of the entire system (µECoG array + ROIC) measured in saline with the solution grounded.
Figure 4
Figure 4
In vivo validation of the µECoG arrays in addressing mode. a) Representation of the placement over the cortical surface of a µECoG array formed by two subarrays (8 × 4 pixels per subarray, 100‐µm electrode diameter, 250‐µm pitch). Each of the subarrays was placed in a different hemisphere, partially covering the somatosensory regions representing the front and hind limbs. b) Recorded spontaneous activity from all the addressable electrodes when selecting one of the subarrays, and magnification of three of those electrodes: one electrode without a TFT (green), an adjacent electrode incorporating a switch TFT (orange) and a distant electrode with a TFT (purple). c) Averaged response of the somatosensory evoked potentials elicited by the electrical stimulation of the right front paw of an anesthetized mouse (monophasic current pulses: 200 µA in amplitude, 2 ms in duration, 1 Hz frequency, n  =  100). Each subarray was recorded sequentially. The subarray activated with select line #1 was located in the hemisphere contralateral to the stimulated paw, while the subarray activated with select line #2 was in the ipsilateral hemisphere. The electrode with the strongest response, and its corresponding pair in the other subarray are highlighted (red dashed square). d) Average response of the highlighted electrodes: two addressable electrodes located in different subarrays but sharing a single data line and readout channel. e) Localized gamma response to stimulation of the right front paw. The color map indicates the RMS instantaneous power of the averaged responses filtered between 30 Hz and 500 Hz in an interval 10 to 50 ms after the stimulation onset. f) Overlay of the normalized gamma responses to the sequential stimulation of all four paws. Color intensities indicate the magnitude of the RMS instantaneous power measured for each stimulated paw (right front paw = blue, left front paw = green, right hind paw = orange, and left hind paw = fuchsia).
Figure 5
Figure 5
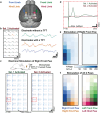
In vivo recordings of spontaneous activity using a 16 × 16 µECoG array in time‐division multiplexing mode. a) Recorded spontaneous activity showing the spatial distribution of measured physiological oscillations under anesthesia for all the 256 electrodes of the multiplexed array, and b) for a subset of electrodes capturing localized events. c) Spontaneous activity captured by 16 multiplexed electrodes sharing a single recording super‐channel. d) Spatiotemporal dynamics of spontaneous activity (650 ms timespan with 50 ms epochs). For each frame, the pixels’ color indicates the mean voltage calculated in the corresponding time bin. e) Raw and filtered time traces for a selected electrode capturing physiological oscillations. Signal filtered in the delta (1 Hz – 4 Hz), spindle (10 Hz – 16 Hz), and ripple (100 Hz – 150 Hz) bands. Spectrograms of presented time trace in the frequency ranges 1 to 55 Hz and 50 to 500 Hz. f) RMS instantaneous power of spontaneous activity in the ripple band, reflecting localized ripple activity over midline cortical structures (129 seconds of recording).
Figure 6
Figure 6
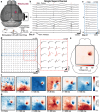
In vivo recordings of somatosensory evoked potentials using a µECoG array in time‐division multiplexing mode. a) Representation of the placement of a 16 × 16 actively multiplexed µECoG array over the cortical surface of an anesthetized mouse, highlighting the somatosensory region representing the hind limb in the right hemisphere. The left hind paw of the mouse was electrically stimulated using monophasic current pulses (1 mA in amplitude, 2 ms in duration, and with a frequency of 1.5 Hz) to elicit an evoked response in the contralateral somatosensory cortex. b) Evoked responses captured by 16 multiplexed electrodes sharing a single recording super‐channel, for three stimulation trials. c) Averaged evoked response for a selected super‐channel, and for d) all 256 electrodes of the multiplexed array (n  =  100). In the grid representation, the selected super‐channel presented in c) is highlighted (blue dashed rectangle). A magnification of the electrodes around the elicited response is included. e) Localized gamma response to stimulation of the left hind paw. The color map indicates the RMS instantaneous power of the averaged responses filtered between 30 Hz and 500 Hz in an interval 10 to 50 ms after the stimulation onset. f) Spatiotemporal dynamics of the averaged response for the first tens of milliseconds (55 ms timespan with 5 ms epochs) and g) the first hundreds of milliseconds (550 ms timespan with 50 ms epochs) after electrical stimulation of the left hind paw. For each frame, the pixels’ color indicates the mean voltage calculated in the corresponding time bin. The range of the color bar is not shared between frames.

References

    1. World Health Organization, Neurological Disorders: Public Health Challenges, 2006.
    1. DiLuca M., Olesen J., Neuron 2014, 82, 1205. - PubMed
    1. Engel A. K., Moll C. K. E., Fried I., Ojemann G. A., Nat. Rev. Neurosci. 2005, 6, 35. - PubMed
    1. Bronstein J. M., Tagliati M., Alterman R. L., Lozano A. M., Volkmann J., Stefani A., Horak F. B., Okun M. S., Foote K. D., Krack P., Pahwa R., Henderson J. M., Hariz M. I., Bakay R. A., Rezai A., Marks W. J., Moro E., Vitek J. L., Weaver F. M., Gross R. E., DeLong M. R., Arch. Neurol. 2011, 68, 165. - PMC - PubMed
    1. Chang E. F., Neuron 2015, 86, 68. - PMC - PubMed

Publication types

LinkOut - more resources