. 2024 Mar;11(10):e2304761.
doi: 10.1002/advs.202304761. Epub 2023 Dec 25.

Enzymatically Bioactive Nucleus Pulposus Matrix Hydrogel Microspheres for Exogenous Stem Cells Therapy and Endogenous Repair Strategy to Achieve Disc Regeneration

Affiliations

Enzymatically Bioactive Nucleus Pulposus Matrix Hydrogel Microspheres for Exogenous Stem Cells Therapy and Endogenous Repair Strategy to Achieve Disc Regeneration

Yizhong Peng et al. Adv Sci (Weinh). 2024 Mar.

Abstract

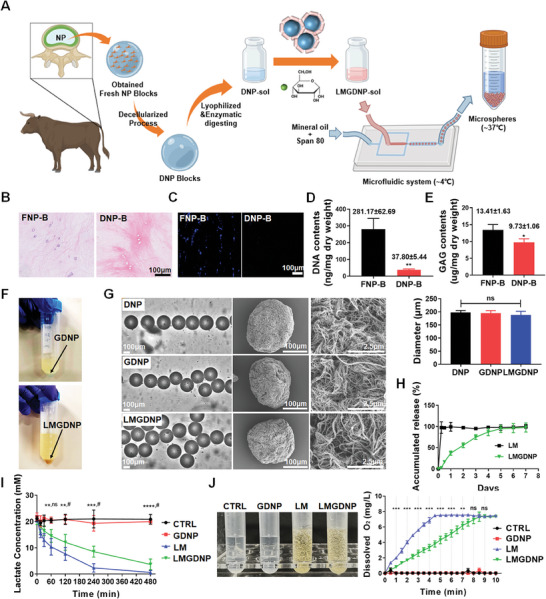
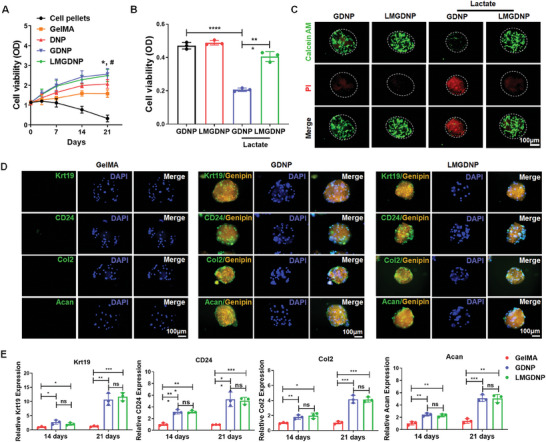
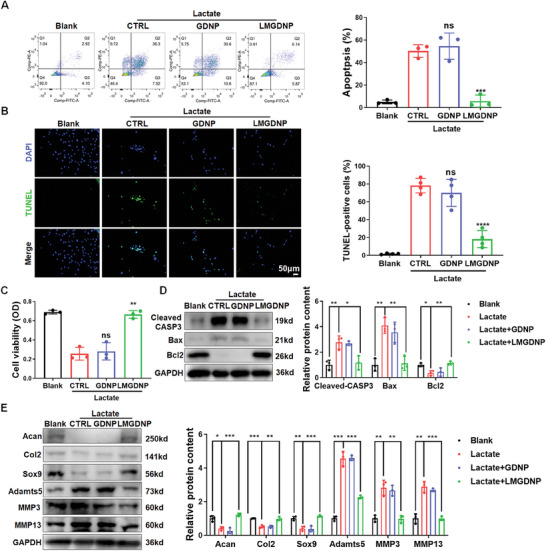
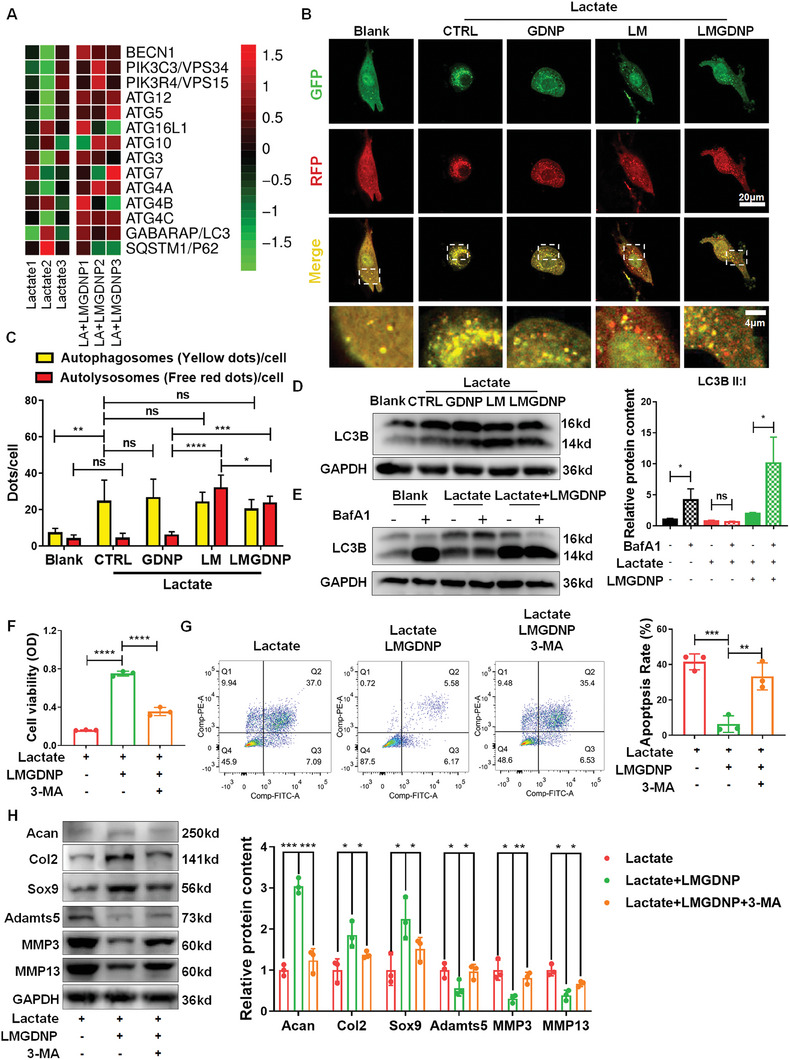
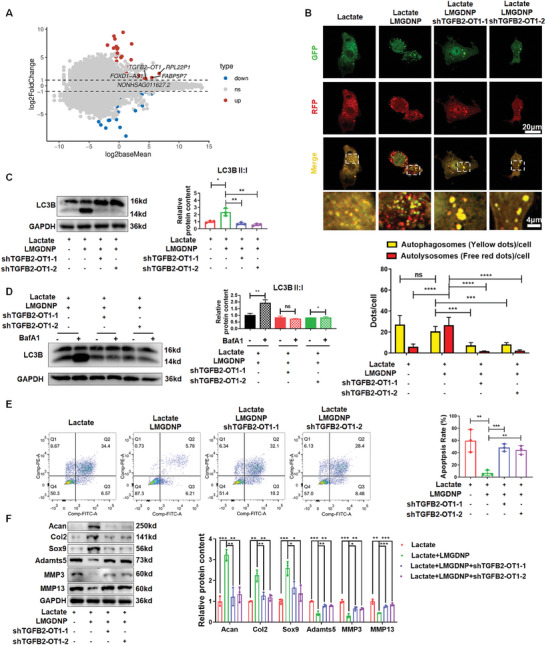
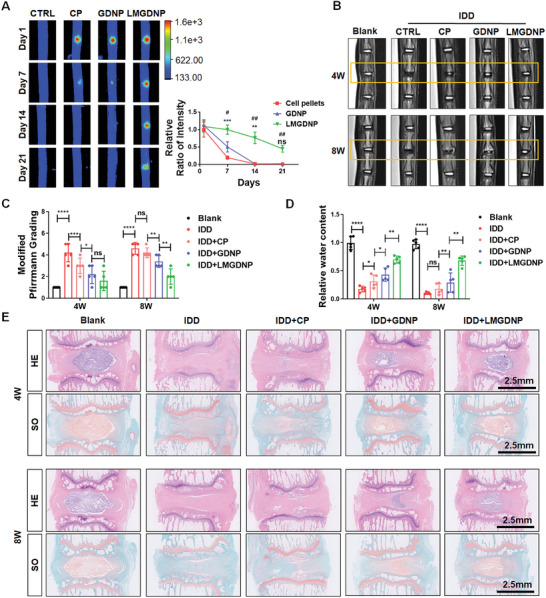
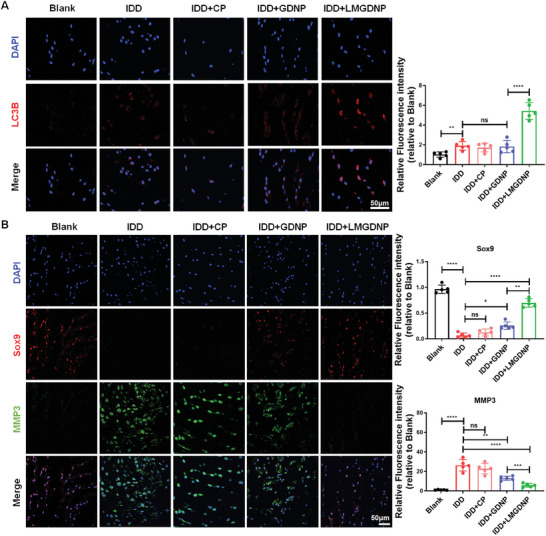
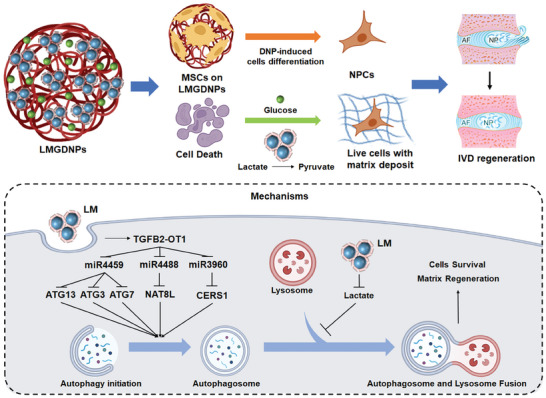
Exogenous stem cell therapy and endogenous repair has shown great potential in intervertebral disc regeneration. However, limited nutrients and accumulation of lactate largely impair the survival and regenerative capacity of implanted stem cells and endogenous nucleus pulposus cells (NPCs). Herein, an injectable hydrogel microsphere (LMGDNPs) have been developed by immersing lactate oxidase (LOX)-manganese dioxide (MnO2 ) nanozyme (LM) into glucose-enriched decellularized nucleus pulposus hydrogel microspheres (GDNPs) through a microfluidic system. LMGDNPs showed a delayed release profile of LOX and satisfactory enzymatic capacity in consuming lactate. Mesenchymal stem cells (MSCs) plated on LMGDNPs exhibited better cell viability than cells on GelMA and decellularized nucleus pulposus microspheres (DNP) and showed a obviously increased NPCs phenotype. LMGDNPs prevented MSCs and NPCs death and promoted extracellular matrix synthesis by exhausting lactate. It is determined that LMGDNPs promoted NPCs autophagy by activating transforming growth factor β2 overlapping transcript 1 (TGFB2-OT1), relying on the nanozyme. MSCs-loaded LMGDNPs largely preserved disc hydration and alleviated matrix degradation in vivo. Summarily, LMGDNPs promoted cell survival and matrix regeneration by providing a nutrient supply, exhausting lactate, and activating autophagy via TGFB2-OT1 and its downstream pathway and may serve as an ideal delivery system for exogenous stem cell therapy and endogenous repair.

Keywords: TGFB2-OT1; autophagy; intervertebral disc degeneration; lactate; microfluidic system; nanozyme.


Conflict of interest statement

The authors declare no conflict of interest.

Figures

Figure 1
Figure 1
Fabrication and characteristics of LOX‐MnO2 nanozyme. A) Schematic overview of the construction of LM. B) TEM images of PAH‐coated MnO2 nanoparticles and LM. C) Size distribution of nanoparticles. D) Effect of coating PAH‐MnO2 nanoparticles with LOX on zeta potential. Data are presented as the mean ± SD, n = 3. E) SEM images and element analysis of nanoparticles. F) Sliver staining of SDS‒PAGE for protein analysis of LOX, PAH‐MnO2 nanoparticles, and LM. G) UV–vis absorption spectra of materials and LM. LOX, lactate oxidase. MnO2, manganese dioxide. PAH, poly(allylamine hydrochloride). LM, lactate oxidase‐manganese dioxide nanozymes.
Figure 2
Figure 2
Preparation and characteristics of functional microspheres. A) Schematic overview of the construction of LMGDNPs. Micrographic images to evaluate the efficiency of decellularization based on B) HE staining and C) DAPI staining. Scale bar: 100 µm. D) Quantitative analysis of DNA content (ng/mg dry weight) in FNP‐B and DNP‐B. E) GAG analysis of FNP‐B and DNP‐B evaluating the content of proteoglycans (ng/mg dry weight). F) Collected microspheres dispersed in mineral oil. Data are presented as the mean ± SD, n = 3, *p < 0.05, **p < 0.01 between groups. G) Size distribution and microstructure of microspheres. Scale bars: 100 µm and 2.5 µm. Data are presented as the mean ± SD, n = 3, ns, no significance. H) Cumulative release profile of LOX in LMGDNPs based on the BCA assay. I) Lactate consumption efficiency of LOX‐MnO2 nanozyme and microspheres. Data are presented as the mean ± SD, n = 3, **p < 0.01, ***p < 0.001, ****p < 0.0001 between LM and CTRL groups; ns, no significance, # p < 0.05 between LM and LMGDNP groups. J) Dissolved oxygen profiles of H2O2 solution mixed with LOX‐MnO2 nanozyme and microspheres. Data are presented as the mean ± SD, n = 3, ns, no significance, **p < 0.01, ***p < 0.001 between LM and LMGDNP groups. NP, nucleus pulposus. CTRL, control. LM, LOX‐MnO2 nanozyme. DNP, decellularized nucleus pulposus matrix hydrogel‐based microspheres. GDNP, glucose‐rich nucleus pulposus matrix hydrogel‐based microspheres. LMGDNP, LOX‐MnO2 nanozyme‐loaded glucose‐rich nucleus pulposus matrix hydrogel‐based microspheres. FNP‐B, fresh nucleus pulposus tissue blocks. DNP‐B, decellularized nucleus pulposus tissue blocks.
Figure 3
Figure 3
Pro‐differentiation capacity and bioactivity of LMGDNPs against lactate. A) CCK8 assay detecting the viability of BMSCs cultured in pellets or on microspheres. Data are presented as the mean ± SD, n = 3, ns, no significance, *p < 0.05 between DNP and GelMA group; #p < 0.05 between LMGDNP and DNP group. B) Evaluation of the viability of BMSCs cultured on microspheres with or without lactate for 24 h. C) Fluorescence images of the live/dead assays of BMSCs cultured on microspheres with or without lactate for 24 h. Scale bar: 100 µm. D) Representative immunocytochemistry images showing the expression of NPCs markers (Krt19, CD24, Col2, and Acan) in BMSCs cultured on microspheres for 21 days. Genipin was visualized using orange fluorescence. Scale bar: 100 µm. E) Relative mRNA expression of Krt19, CD24, Col2, and Acan in BMSCs cultured on microspheres for 14 and 21 days. Data are presented as the mean ± SD, n = 3, ns, no significance, *p < 0.05, **p < 0.01, ***p < 0.001 between groups. DNP, decellularized nucleus pulposus matrix hydrogel‐based microspheres. GDNP, glucose‐rich nucleus pulposus matrix hydrogel‐based microspheres. LMGDNP, LOX‐MnO2 nanozyme‐loaded glucose‐rich nucleus pulposus matrix hydrogel‐based microspheres.
Figure 4
Figure 4
Anti‐lactate effects of LMGDNPs on cell survival and matrix regeneration. A) Flow cytometry results of Annexin V/PI staining of NPCs cocultured with microspheres with or without lactate treatment for 24 h. The apoptosis rate is the sum of the proportion of Annexin V+ PI and Annexin V+ PI+ cells. B) TUNEL staining of NPCs exposed to microspheres with or without lactate treatment for 24 h. Scale bar: 50 µm. The positive rate of TUNEL staining in green fluorescence was calculated and is shown in the subjacent chart. The results are shown as the mean ± SD, n = 4. C) The viability of NPCs cocultured with microspheres with or without lactate treatment. The results are shown as the mean ± SD, n = 3, ns, compared to lactate + CTRL; **p < 0.01, ***p < 0.001, ****p < 0.0001, compared to lactate + GDNP. D) Blots and densitometric analysis of apoptosis‐related proteins in NPCs treated with microspheres and lactate. E) Western blot analysis of matrix‐degrading proteases (Adamts5, MMP3, and MMP13) and matrix anabolic factors (Acan, Col 2, and Sox9). Data are presented as the mean ± SD, n = 3, ns, no significance, *p < 0.05, **p < 0.01, ***p < 0.001 between groups. CTRL, control. LM, LOX‐MnO2 nanozyme. GDNP, glucose‐rich nucleus pulposus matrix hydrogel‐based microspheres. LMGDNP, LOX‐MnO2 nanozyme‐loaded glucose‐rich nucleus pulposus matrix hydrogel‐based microspheres.
Figure 5
Figure 5
Autophagy mediated the anti‐apoptosis and matrix regeneration effects of LMGDNPs. A) Heatmaps for normalized gene expression of autophagy‐associated genes in NPCs cultured with or without LMGDNPs. B) Representative fluorescence images showing the autophagosomes (yellow dots, GFP+ RFP+) and autolysosomes (free red dots, GFP− RFP+) in NPCs exposed to lactate and GDNPs, LM, or LMGDNPs for 24 h. Scale bars: 20 µm and 4 µm. C) Quantification of autophagosomes and autolysosomes per cell is shown as the mean ± SD. Cells were from 3 independent experiments. ns, no significance; *p < 0.05, **p < 0.01, ***p < 0.001, ****p < 0.0001 between groups. D) Western blot analysis of LC3B in NPCs. E) Western blot analysis of LC3B‐II:I in NPCs treated with lactate and LMGDNPs for 24 h. BafA1 was added in the last 4 h. Densitometric analysis of LC3B‐II:I is shown in the statistical chart. F) The viability of cells exposed to lactate, LMGDNPs and 3‐MA. G) Cell flow cytometry analysis of the apoptotic rate of NPCs. H) Western blot analysis of matrix‐degrading proteases and matrix anabolic factors. Data are presented as the mean ± SD, n = 3, *p < 0.05, **p < 0.01, ***p < 0.001, ****p < 0.0001 between groups. LA, lactate. CTRL, control. LM, LOX‐MnO2 nanozyme. GDNP, glucose‐rich nucleus pulposus matrix hydrogel‐based microspheres. LMGDNP, LOX‐MnO2 nanozyme‐loaded glucose‐rich nucleus pulposus matrix hydrogel‐based microspheres. 3‐MA, 3‐Methyladenine.
Figure 6
Figure 6
TGFB2‐OT1 mediates LMGDNPs‐induced autophagy in NPCs. A) Maplot of differentially expressed genes between the lactate and lactate + LMGDNP groups. MA plots (M = log2 fold change and A = log2 baseMean average). Red and blue dots in the MA plots indicate differentially upregulated and downregulated genes (p < 0.05) in NPCs cultured with LMGDNPs or not. The top 5 upregulated genes with the highest expression abundances are labeled. B) Representative fluorescence images showing the autophagosomes (yellow dots, GFP+ RFP+) and autolysosomes (free red dots, GFP− RFP+) in NPCs transfected with shTGFB2‐OT1 and exposed to lactate and LMGDNPs for 24 h. Scale bars: 20 µm and 4 µm. Quantification of the number of autophagosomes and autolysosomes per cell is shown as the mean ± SD. Cells were from 3 independent experiments. ns, no significance; ***p < 0.001, ****p < 0.0001 between groups. C) Western blot analysis of LC3B in NPCs transfected with shTGFB2‐OT1, which were treated with lactate and LMGDNPs for 24 h. D) LC3B II:I expression in NPCs transfected with shTGFB2‐OT1, which were treated with lactate and LMGDNPs for 24 h and cultured with or without BafA1 for 4 h. E) Cell flow cytometry analysis of the apoptotic rate of NPCs. The results are shown as the mean ± SD, n = 3, ***p < 0.001, ****p < 0.0001. F) Western blot analysis of matrix‐degrading proteases and matrix anabolic factors. Data are presented as the mean ± SD, n = 3, ns, no significance, *p < 0.05, **p < 0.01, ***p < 0.001 between groups. GDNP, glucose‐rich nucleus pulposus matrix hydrogel‐based microspheres. LMGDNP, LOX‐MnO2 nanozyme‐loaded glucose‐rich nucleus pulposus matrix hydrogel‐based microspheres.
Figure 7
Figure 7
Regenerative effects of LMGDNPs on lactate‐induced IDD. A) Fluorescence images showing the fluorescence intensity after delivering DiR Iodide‐labeled BMSCs by GDNPs or LMGDNPs at Day 1, Day 7, Day 14, and Day 21. Data are presented as the mean ± SD, n = 3. Ns, no significance; **p < 0.01, ***p < 0.001, GDNPs compared to cell pellets (CP); #p < 0.05, ##p < 0.01, LMGDNPs compared to CP. B) Representative images of T2‐weighted MRI of rat tails. Boxes indicate the operated disc. C) Modified Pfirrmann MRI grades for each group. D) Quantitative evaluation of T2‐weighted signaling (water preservation in NP tissues). E). Histological images based on HE and SO staining. Scale bar: 2.5 mm. Data are presented as the mean ± SD, n = 5, ns, no significance, *p < 0.05, **p < 0.01, ***p < 0.001, ****p < 0.0001 between groups. CTRL, control. CP, cell pellets. IDD, intervertebral disc degeneration. LM, LOX‐MnO2 nanozyme. GDNP, glucose‐rich nucleus pulposus matrix hydrogel‐based microspheres. LMGDNP, LOX‐MnO2 nanozyme‐loaded glucose‐rich nucleus pulposus matrix hydrogel‐based microspheres.
Figure 8
Figure 8
LMGDNPs promote autophagy and maintain matrix metabolism balance. A) Immunofluorescence detection of LC3B. B) Representative immunofluorescence images of Sox9 (red) and MMP3 (green). Scale bars, 50 µm. Data are presented as the mean ± SD, n = 5, ns, no significance, *p < 0.05, **p < 0.01, ***p < 0.001, ****p < 0.0001 between groups. CP, cell pellets. IDD, intervertebral disc degeneration. LM, LOX‐MnO2 nanozyme. GDNP, glucose‐rich nucleus pulposus matrix hydrogel‐based microspheres. LMGDNP, LOX‐MnO2 nanozyme‐loaded glucose‐rich nucleus pulposus matrix hydrogel‐based microspheres.
Figure 9
Figure 9
Schematic diagram of the effect and mechanism of LMGDNPs in alleviating IDD. LMGDNPs, as carriers of MSCs, induce directional differentiation of MSCs into NPCs; LMGDNPs reduce cell death and ECM breakdown by consuming lactate; LM released from LMGDNPs promotes the formation of autophagosomes through the TGFB2‐OT1/miRNAs/ATGs/NAT8L/CERS1 pathway, and consumes lactate to inhibit the blocking effect of lactate on autophagy flow, thereby activating autophagy, promoting cell survival and matrix regeneration.

References

    1. Cieza A., Causey K., Kamenov K., Hanson S. W., Chatterji S., Vos T., Lancet 2021, 396, 2006. - PMC - PubMed
    1. Brinjikji W., Diehn F. E., Jarvik J. G., Carr C. M., Kallmes D. F., Murad M. H., Luetmer P. H., Am. J. Neuroradiol. 2015, 36, 2394. - PMC - PubMed
    1. Ohtori S., Inoue G., Miyagi M., Takahashi K., Spine J 2015, 15, 1347. - PubMed
    1. Guevar J., Olby N., Minimally invasive microsurgical decompression of an intervertebral disc protrusion in a dog., United States, 2020, Vol. 49 Suppl 1, pp. O86–O92. - PubMed
    1. Geisler F. H., Mcafee P. C., Banco R. J., Blumenthal S. L., Guyer R. D., Holt R. T., Majd M. E., SAS J 2009, 3, 17. - PMC - PubMed

Publication types

LinkOut - more resources