. 2024 Feb 28;198(1):113-127.
doi: 10.1093/toxsci/kfad133.

Ammonium perchlorate: serum dosimetry, neurotoxicity, and resilience of the neonatal rat thyroid system

Affiliations

Ammonium perchlorate: serum dosimetry, neurotoxicity, and resilience of the neonatal rat thyroid system

Mary E Gilbert et al. Toxicol Sci. .

Erratum in

Abstract

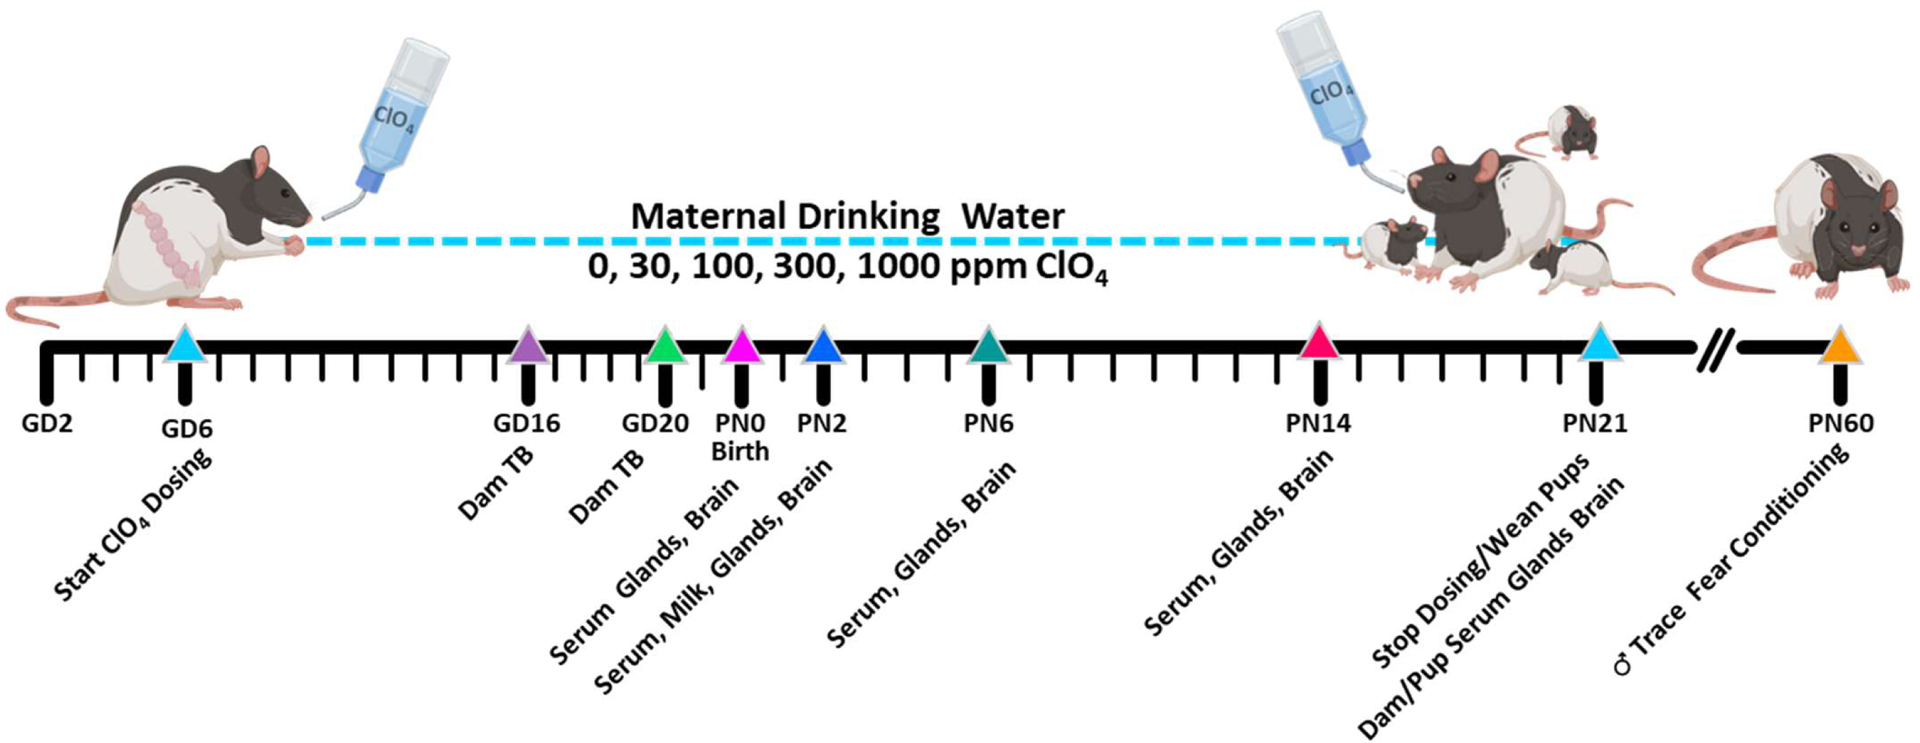
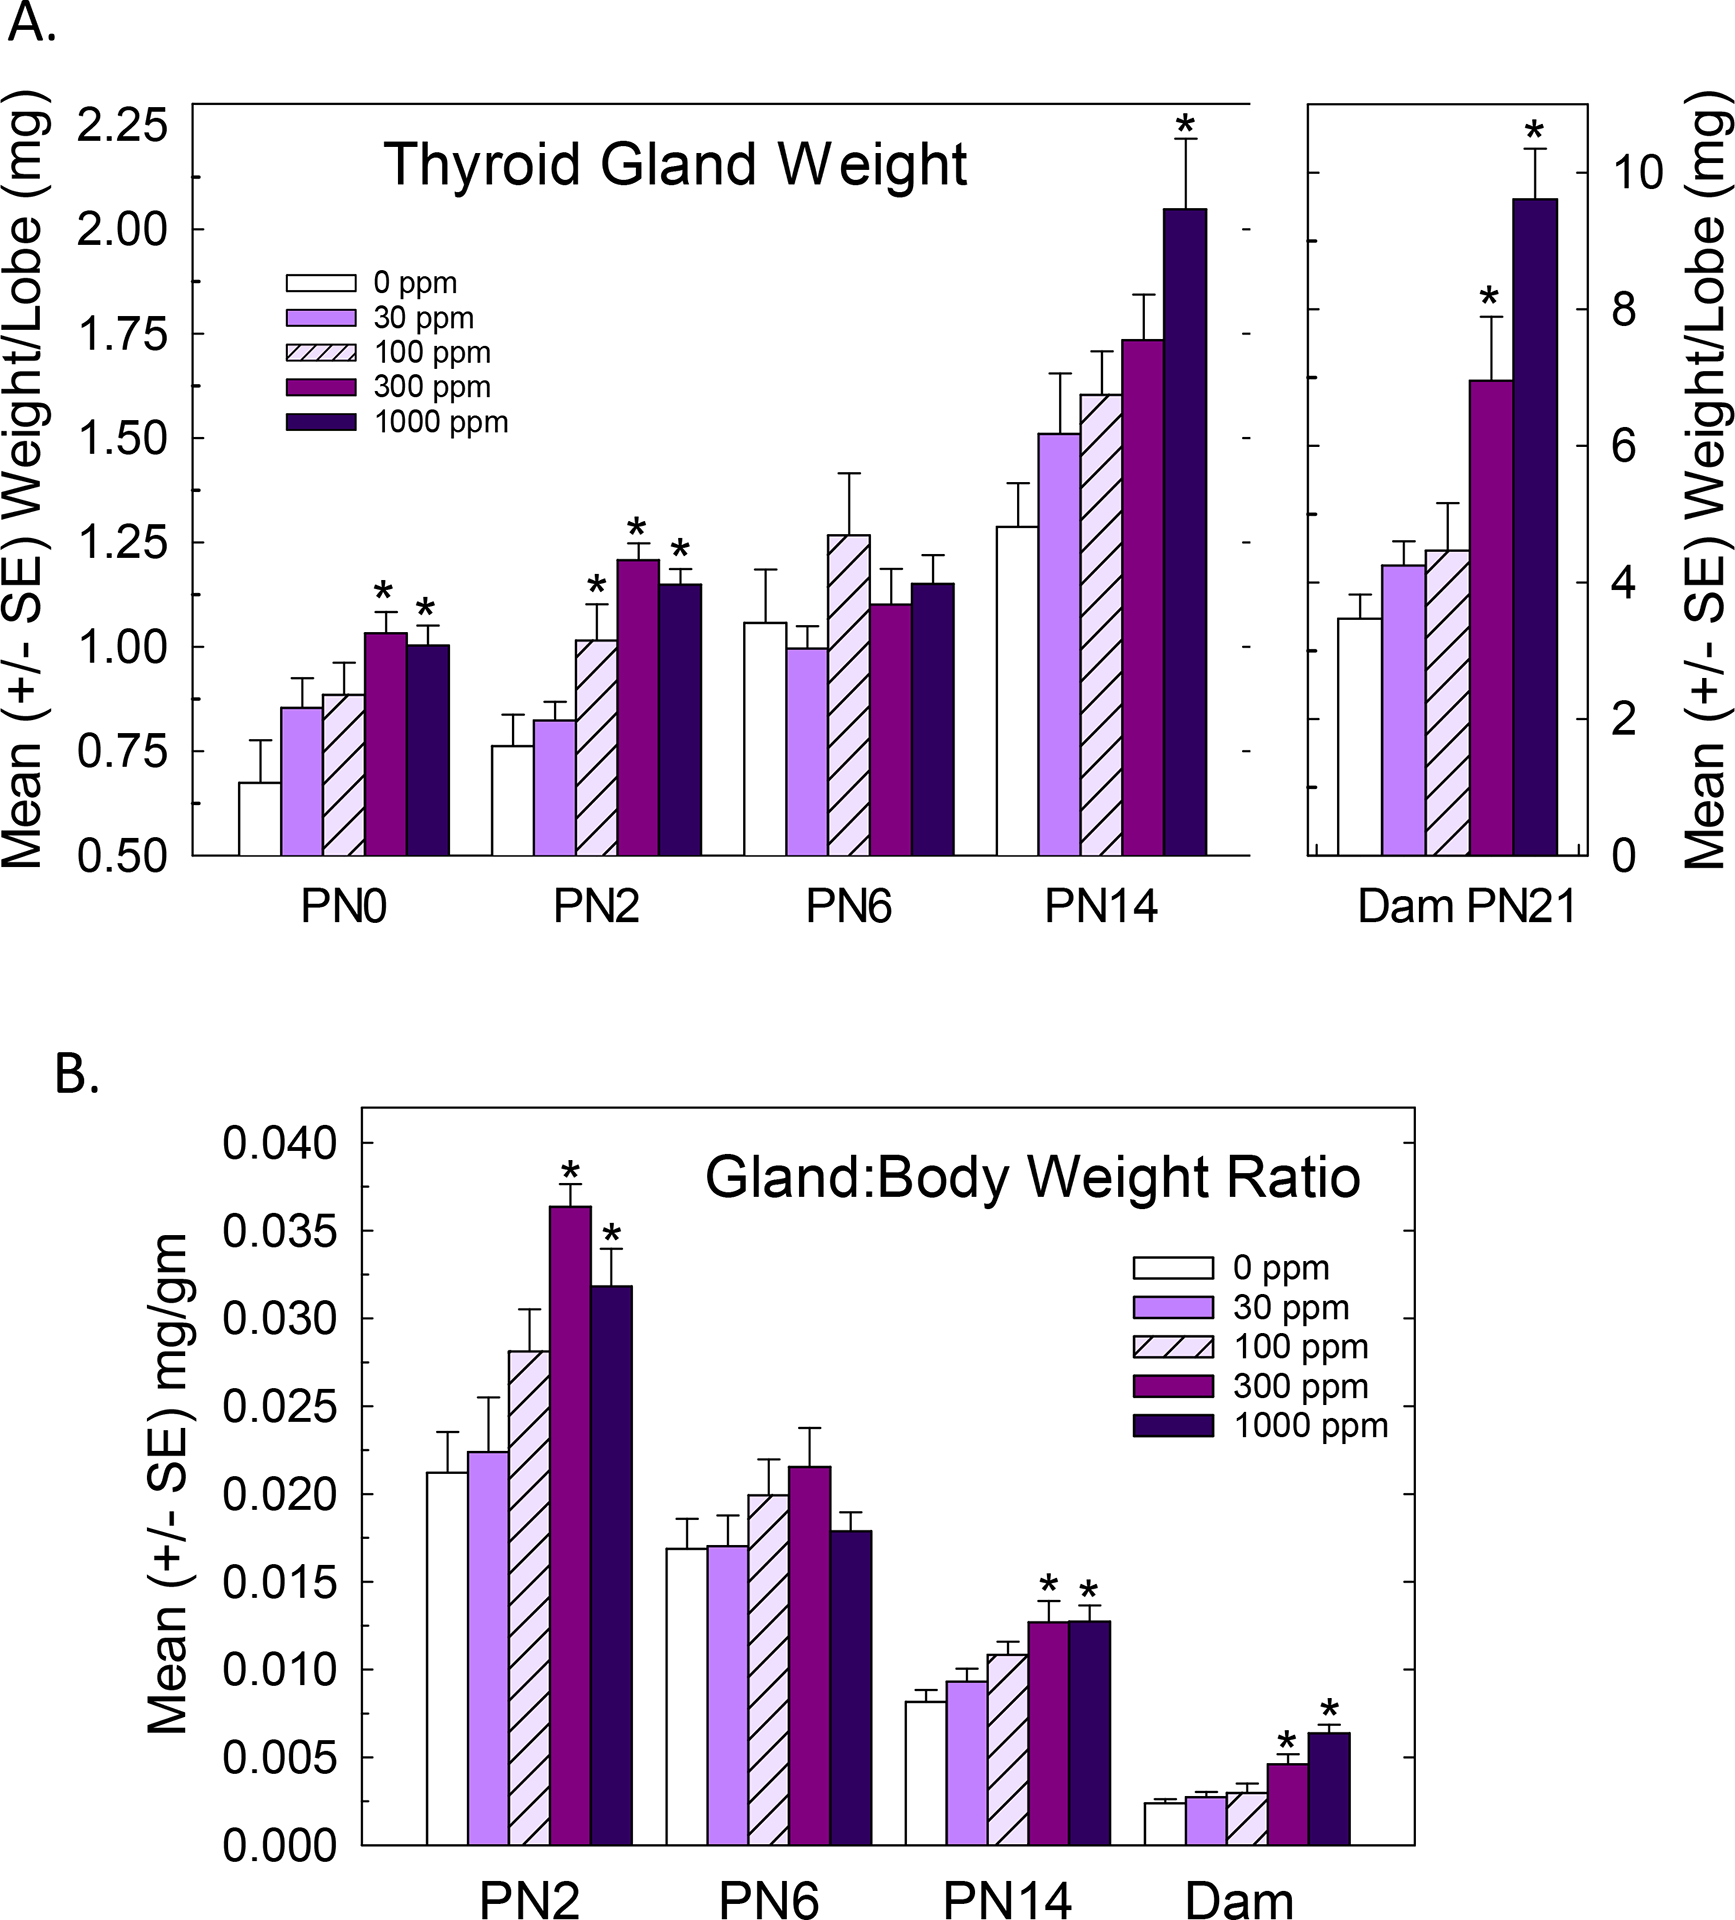
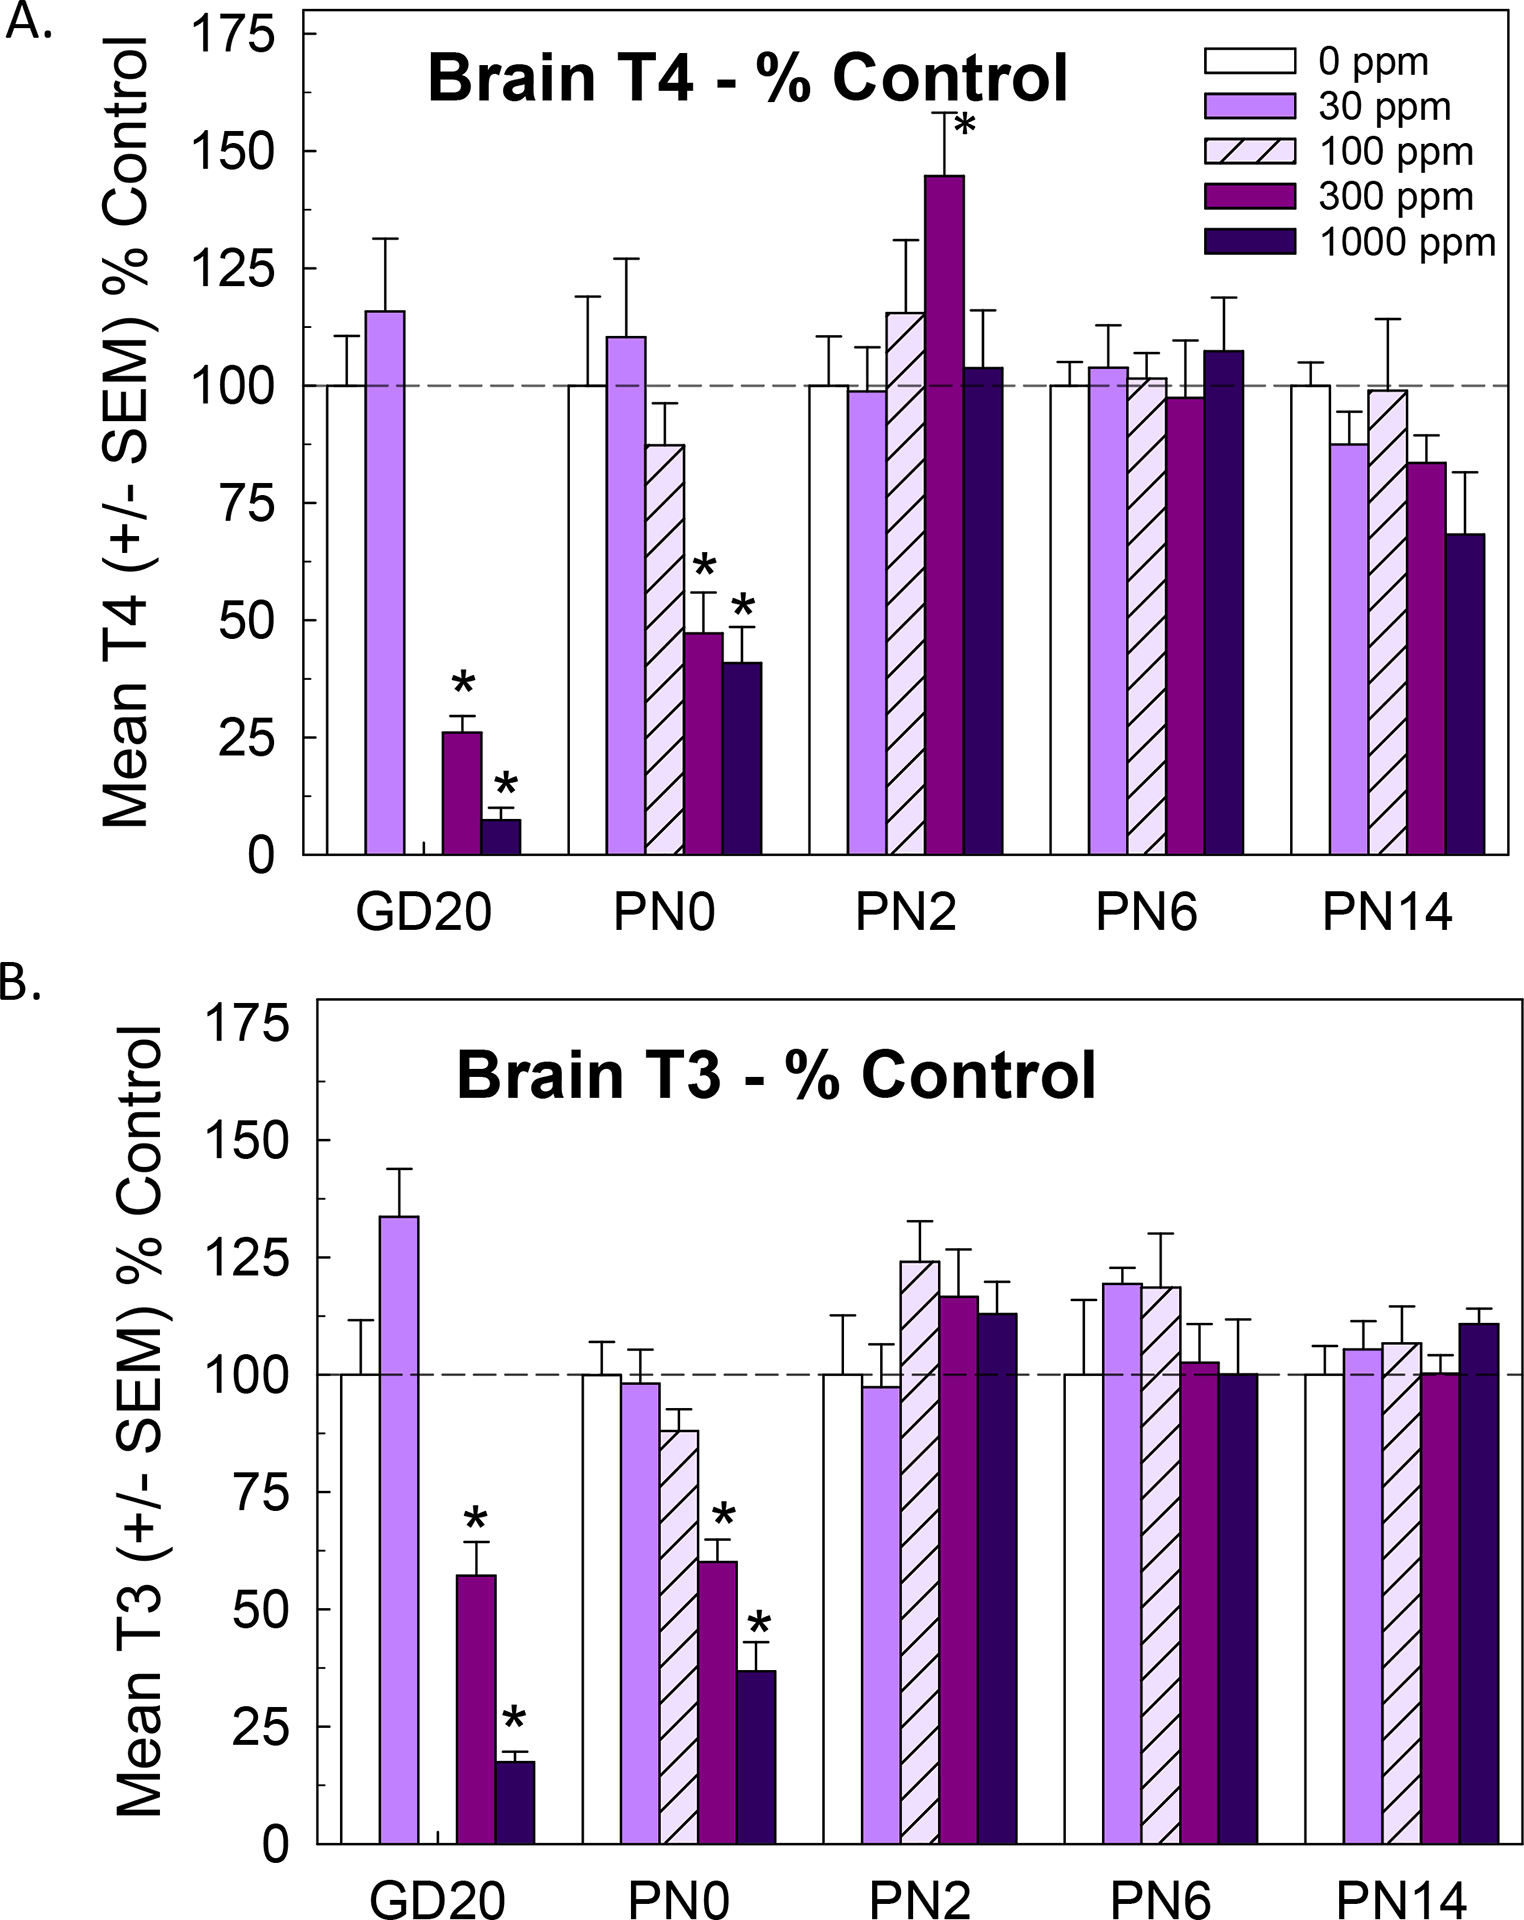
The environmental contaminant perchlorate impairs the synthesis of thyroid hormones by reducing iodine uptake into the thyroid gland. Despite this known action, moderate doses of perchlorate do not significantly alter serum thyroid hormone in rat pups born to exposed dams. We examined perchlorate dosimetry and responsivity of the thyroid gland and brain in offspring following maternal exposure to perchlorate. Pregnant rat dams were delivered perchlorate in drinking water (0, 30, 100, 300, 1000 ppm) from gestational day 6 to postnatal day (PN) 21. Perchlorate was present in the placenta, milk, and serum, the latter declining in pups over the course of lactation. Serum and brain thyroid hormone were reduced in pups at birth but recovered to control levels by PN2. Dramatic upregulation of Nis was observed in the thyroid gland of the exposed pup. Despite the return of serum thyroid hormone to control levels by PN2, expression of several TH-responsive genes was altered in the PN14 pup brain. Contextual fear learning was unimpaired in the adults, supporting previous reports. Declining levels of serum perchlorate and a profound upregulation of Nis gene expression in the thyroid gland are consistent with the rapid return to the euthyroid state in the neonate. However, despite this recovery, thyroid hormone insufficiencies in serum and brain beginning in utero and present at birth appear sufficient to alter TH action in the fetus and subsequent trajectory of brain development. Biomarkers of that altered trajectory remain in the brain of the neonate, demonstrating that perchlorate is not devoid of effects on the developing brain.

Keywords: AOP; brain; development; neurotoxicity; perchlorate; thyroid hormone.


Figures

Figure 1.
Figure 1.
Experimental Design and Timeline of Tissue Collection. Pregnant dams arrived at the facility on GD2 and were immediately placed on an iodine-controlled diet. Drinking water containing perchlorate was administered to dams beginning on GD6 and was maintained until pups were weaned on PN21. Blood was sampled via tailbleed (TB) in dams on GD16 and GD20 at on PN21 at euthanasia. Pups were taken on the day of birth (PN0), PN2, PN6 and PN14 and blood, brain and thyroid glands collected. Thyroid hormones were measured in serum and brain at all ages, perchlorate was measured in serum at all ages and in milk bands on PN2. Gene expression was assessed in the thyroid gland at all ages and in the brain on PN14. Learning and memory was measured in a distract-trace fear conditioning paradigm ~PN60 in adult male offspring.
Figure 2.
Figure 2.
Body weights in dams and pups. A) Mean (+/− SEM) body weight in dams increased throughout gestation, remained stable during lactation, and did not differ across dose groups [F(4,46)=0.43, p>0.78]. Body weight increased with age in male (B) and female (C) offspring (both p’s <0.0001) with no significant effect of Dose or Sex in ANOVA. N=9–11 litters/dose group.
Figure 3.
Figure 3.
Thyroid Gland Weight. A) Mean (+/− SEM) thyroid gland weight in pups increased with Age [F(4,154)=182.4, p<0.0001) and Dose [F(4,154)=13.3, p<0.0001]. A significant Dose X Age interaction [F(16,154)=9.03] followed by step-down ANOVAs by Age revealed significant increases in gland weight in pups on PN0 and PN2 that were present only at the highest dose by PN14. Dam thyroid gland weights on PN21 were increased at the two highest dose levels [F(4,36)=13.56, p<0.0001. Gland weight is expressed as mean weight/thyroid lobe as multiple lobes were collected from pups at various ages. Sample sizes varied as a function of age and dose, n=5–7/dose group at PN0 and PN2; 6–10/dose group in older pups and dams. B) Mean (+/-SEM) thyroid gland weight relative to body weight in pups and dams was similarly increased by perchlorate. Data are expressed for each dose level as mean weight of gland (2 lobes in mg) over mean pup body weight (in grams) within each litter at each age. Mirroring effects in A, significant increases in gland:body weight ratios were observed in pups on PN2 [F(4,24)=7.95, p<0.0003], PN14 [F(4,35)=4.51, p<0.0048], and in dams on PN21 [F(4,34)=13.55, p<0.0001]. As seen in A, no effect of perchlorate on thyroid gland weight was evident on PN6 (p>0.35). Body weights were not taken on the day of birth so ratios are not available for this age group. * Dunnett’s t-test p<0.05 following significant step-down ANOVAs.
Figure 4.
Figure 4.
Mean (+/-SE) serum T4, T3 and TSH in dam, fetus and pup. Mean (+/− SE) dam serum T4 (A) and T3 (B). T4 overall ANOVA, significant main effects of Dose [F(4,104)=25.14, p<0.0001], Age [F(2,104)=57.7, p<0.0001] and Dose X Age interaction [F(8,104)=3.43, p<0.0015]. Stepdown ANOVAs by age supported a dose-dependent reduction in dam T4 on GD16 [F(4,35)=7.36, p<0.0002], GD20 [F(4,35)=49.8, p<0.0001], and PN21 [F(4,34)=9.29, p<0.0001]. All dose groups differed from control on GD20. T3 overall ANOVA, significant main effects of Dose [F(4,39)=14.93, p<0.0001], Age [F(2,118)=8.44, p<0.0001], and Dose X Age interaction [F(8,118)=3.75, p<0.0007]. Stepdown ANOVA’s support T3 reductions on GD20, [F(4,35)=14.93, p<0.0001] and a marginal effect on PN21 [F(4,34)=2.93, p<0.035]. No dose groups were different from controls on PN21 using Dunnett’s t mean contrast test. C) Mean (+/− SE) pup serum T4. An overall ANOVA of pup T4 revealed a main effect of Age [F(3,156)=341, p<0.0001]. Step-down ANOVAs supported a significant main effect of Dose on PN0 [F(4,37)=5.87, p<0.0009], with lower T4 levels evident in the high dose group only. Higher T4 levels were observed at the 300ppm dose level on PN2 [F(4,39)=3.05, p<0.028], but no differences among dose groups beyond PN2. GD20 T4 from Gilbert et al (2022) is included for completeness. D) Mean (+/− SE) pup T3 exhibited a significant main effect of Age [F(3,131)=297.13, p<0.0001]. As with pup T4, reductions in serum T3 were limited to PN0 at the highest dose tested [F(4,24)=3.57, p<0.02]. E) Mean (+/− SE) TSH was increased in the fetus, pup and dam at all ages tested. The largest increases in TSH were seen in the fetus on GD20 [F(4,39)=35.1, p<0.0001], were maintained in the pup on PN0 [F(4,26)=50.5, p<0.0001], and subsided thereafter. Dam serum TSH on PN21 was much higher than in older pups and increases were limited to the high dose group [F(4,37)=19.18, p<0.0001]. n= 5–7/dose group at the early time points; 6–12/dose group on PN6 and PN14; 6–9/dose group for dams. Litter was the unit of analysis. * Dunnett’s t p<0.05 following significant step-down ANOVA. Values are missing for the100ppm dose group in gestational samples as this dose level was not represented in that study (see Gilbert et al., 2022).
Figure 5.
Figure 5.
Disposition of Perchlorate in Serum, Placenta, Milk. Mean (+/− SE) perchlorate in serum (A), placenta on GD20 and (B) in milk bands collected from pups on PN2. (A) Serum perchlorate concentrations in pregnant dam serum collected from tailbleed samples increased as a function of dose and day of pregnancy, but were lower on PN21 when dams were euthanized at pup weaning. Perchlorate was highest in fetal sera on GD20 (collected from samples reported in Gilbert et al. (2022)), dropping dramatically on the day of birth and continuing to decline over the next two weeks. Dose-dependent increases in placental (B) and milk band (C) perchlorate were evident, with higher concentrations found in milk than in placenta or serum. n=7–9/dose group for placenta; 5–9/dose group for milk band; 5–6/dose group for serum at each age group. n/a, values are missing for the100ppm dose group in gestational samples as this dose level was not represented in that study (see Gilbert et al. (2022)).
Figure 6.
Figure 6.
Gene Expression Changes in the Thyroid Gland Vary by Lifestage. A) Dam and fetal thyroid gland Nis expression was increased on GD20, with larger fold-change increases evident at lower doses in dams than in fetal glands (previously published Gilbert Gilbert et al. (2022)). Large increases in Nis expression, beyond those seen in pregnant dam or fetus, were present in pup thyroid glands on the day of birth. Nis expression remained elevated in the glands of PN14 pups and dams on PN21, but at a much lower level and was limited to the higher dose levels. ANOVA for dam Nis on PN21 [F(4,26)=8.24, p<0.0002]. Overall ANOVAs for pup Nis expression revealed significant main effects of Dose [F(4,12)=44.61, p<0.0001], Age [F(3,12)=57.94, p<0.0001] and Dose X Age interaction [F(12,103)=10.19, p<0.0001]. B) In contrast to Nis, TshR and (C) Tg were downregulated, in pregnant and lactating dams and in the fetus, a pattern that persisted as pups aged. Dam TshR and Tg at PN21, both p’s<0.0001; pup TshR, significant main effect of Dose [F(4,103)=16.54, p<0.0001], Age [F(3,103)=20.06, p<0.0001] and Dose X Age interaction [F(12.103)=2.50, p<0.0064]. The fold-change magnitude and number of dose levels affected decreased with pup age. C) As reported in Gilbert et al. (2022), Tg was downregulated in the GD20 dam but failed to reach statistical significance (p<0.06), but significant reductions were seen in fetal thyroid gland (p<0.003). Downregulation of Tg was maintained in pup thyroid glands throughout the postnatal period, supported by a significant main effect of Dose [F(4.103)=33.0, p<0.0001] but no effect of Age or Dose X Age interaction (both p’s>0.70]. * p<0.05 Dunnett’s t-test following significant effect of Dose for each transcript with corrected α of p<0.02 to control experiment-wise error. n=6–7/dose group. Values are missing for the100ppm dose group in gestational samples as this dose level was not represented in that study (see Gilbert et al. (2022)).
Figure 7.
Figure 7.
Thyroid Hormones in the Brain. A) Mean (+/− SE) T4 expressed as percent of control at each age was reduced in the brain of the newborn pup (PN0) at the two highest dose levels, but forebrain T4 did not differ from controls at ages of PN2 and beyond. Fetal brain hormones were reported in Gilbert et al. (2022) and are included here for completeness. An overall ANOVA for brain T4 at the postnatal timepoints revealed significant main effects of Dose [F(4,101)=2.71, p<0.0343], Age [F(3,101)=9.99, p<0.0001] and a Dose X Age interaction [F(12,19)=3.21, p<0.0006]. Stepdown ANOVAs revealed significant reductions at PN0 [F(4,32)=5.74, p<0.0013] that were restricted to the two highest dose levels. Increases in brain T4 were observe on PN2 [F(4,31)=2.71, p<0.0484], and evident only at the 100ppm dose level. B) A similar pattern is evident for brain T3 with overall ANOVA supporting significant main effects of Dose [F(4,101)=4.10, p<0.004], Age [F(3,101)=20.69] and a Dose X Age interaction [F(12,101)=4.214, p<0.0001]. Significant reductions in brain T3 were restricted to pups on PN0 [F(4,33)=21.06, p<0.0001] with reductions evident at the two highest dose levels. Brain T3 did not differ among dose groups at PN2, PN6 or PN14 (all p’s > 0.20). n=4–5/dose group for both T3 and T4. * Dunnett’s t p<0.05 following significant step-down ANOVA.
Figure 8.
Figure 8.
Gene Expression in the Brain. A) Mean (+/− SE) percent fold-change difference from control in anterior neocortex on PN14. Significant down regulation was observed for Col11a2 [F(4,24)=9.12, p<0.0001], while Agt [F(4,24)=2.95, p<0.04], Itih3 [F(4,24)=2.77, p<0.05] and Klf9 [F(4,24)=2.70, p<0.054] followed a similar trend (#, p<0.05) but at levels that failed to reach the stringent 0.02 cutoff for the overall ANOVA – see text. An unexpected increase in relative expression was observed for Hr, a direct T3-regulated transcription factor [F(4,24)=3.94, p<0.013]. B) A different set of genes with some overlap with cortex was evaluated in the hippocampus. Significant downregulation was seen in Col11a2 [F(4,32)=8.69, p<0.0001] and a trend for Hr [#, F(4,32)=3.0, p<0.03]. For both regions, * p<0.05 using least squares means adjustment for multiple comparisons following a significant effect in ANOVA and applying a stringent p<0.02 cutoff to control for experiment-wise error rate. n=5–6 for each dose group for cortex, 6–8/dose group for hippocampus. Data presented as mean FC are available in Supplementary Figure 1.
Figure 9.
Figure 9.
Adult male offspring exhibited normal trace fear learning and memory for context. A) Mean activity counts at baseline were comparable across groups, significant suppression of activity followed presentation of tone/light conditioned stimulus (CS) and mild footshock unconditioned stimulus (US). No group differences in acquisition were observed. B) Returning animals to the test box 24-hours after fear training showed a decrease in activity counts relative to baseline on training day, indicative of conditioning to context. ANOVA did not reveal any group differences, all p values>0.05. N=10–16/dose group, with no more than 2 pups represented from any given litter.

Similar articles

Cited by

References

    1. Abt E, Spungen J, Pouillot R, Gamalo-Siebers M, Wirtz M. 2018. Update on dietary intake of perchlorate and iodine from u.S. Food and drug administration’s total diet study: 2008–2012. J Expo Sci Environ Epidemiol. 28(1):21–30. - PubMed
    1. Bernal J 2017. Thyroid hormone regulated genes in cerebral cortex development. The Journal of endocrinology. 232(2):R83–r97. - PubMed
    1. Blount BC, Pirkle JL, Osterloh JD, Valentin-Blasini L, Caldwell KL. 2006. Urinary perchlorate and thyroid hormone levels in adolescent and adult men and women living in the united states. Environ Health Perspect. 114(12):1865–1871. - PMC - PubMed
    1. Blount BC, Valentin-Blasini L. 2006. Analysis of perchlorate, thiocyanate, nitrate and iodide in human amniotic fluid using ion chromatography and electrospray tandem mass spectrometry. Anal Chim Acta. 567(1):87–93. - PubMed
    1. Boyes WK, Degn L, George BJ, Gilbert ME. 2018. Moderate perinatal thyroid hormone insufficiency alters visual system function in adult rats. Neurotoxicology. 67:73–83. - PMC - PubMed

LinkOut - more resources