. 2023 Dec 11:16:1323431.
doi: 10.3389/fnmol.2023.1323431. eCollection 2023.

Inhibition of lipid synthesis by the HIV integrase strand transfer inhibitor elvitegravir in primary rat oligodendrocyte cultures

Affiliations

Inhibition of lipid synthesis by the HIV integrase strand transfer inhibitor elvitegravir in primary rat oligodendrocyte cultures

Hubert Monnerie et al. Front Mol Neurosci. .

Abstract

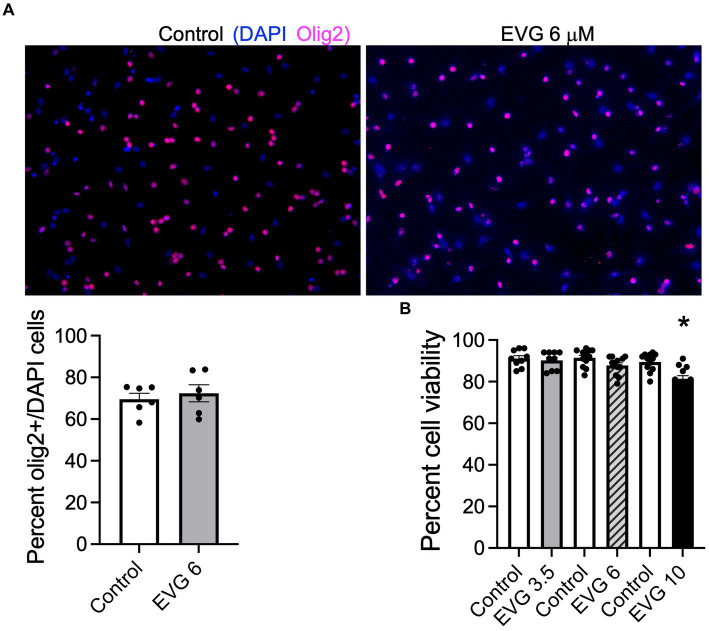
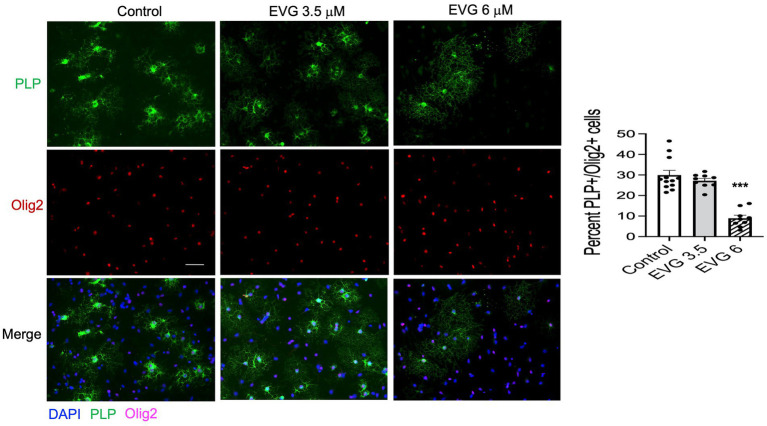
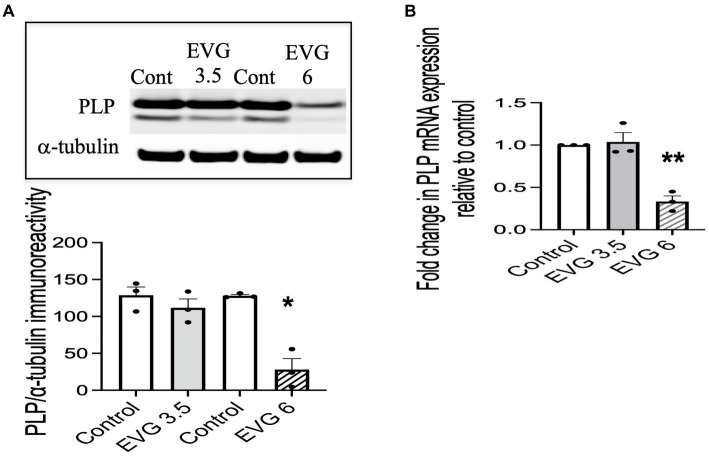
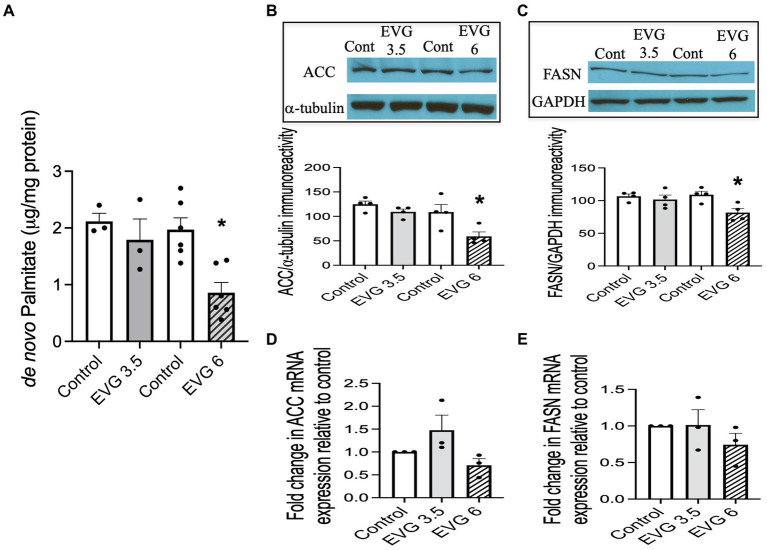
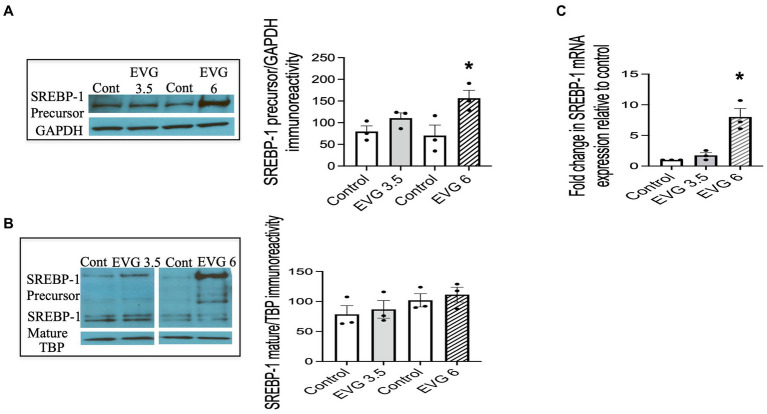
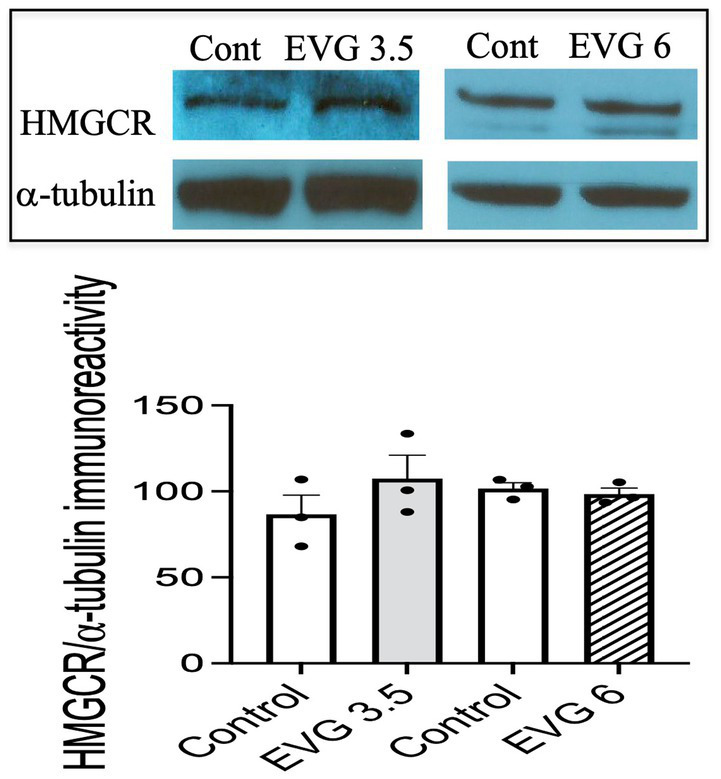
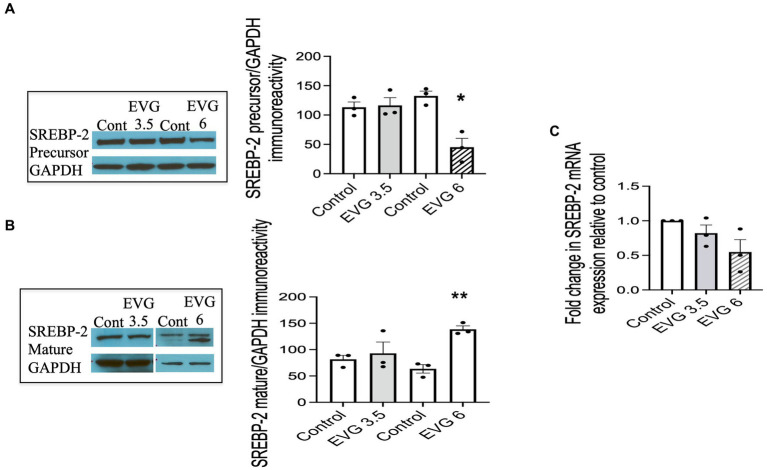
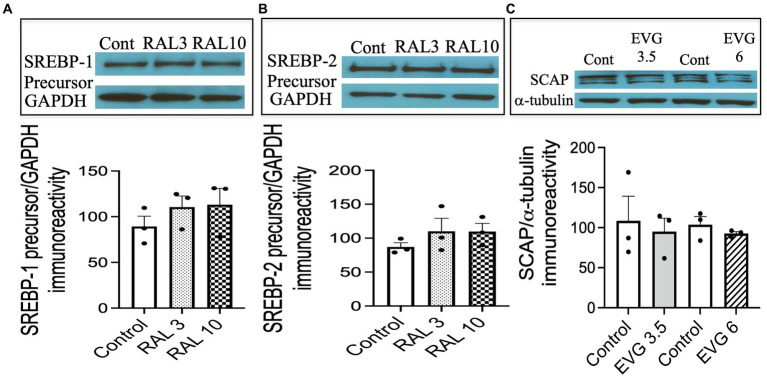
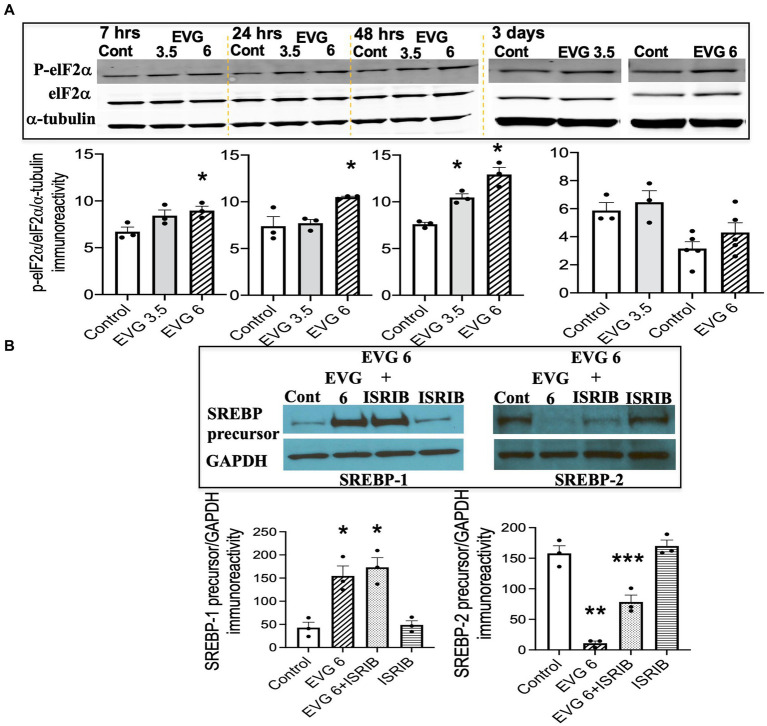
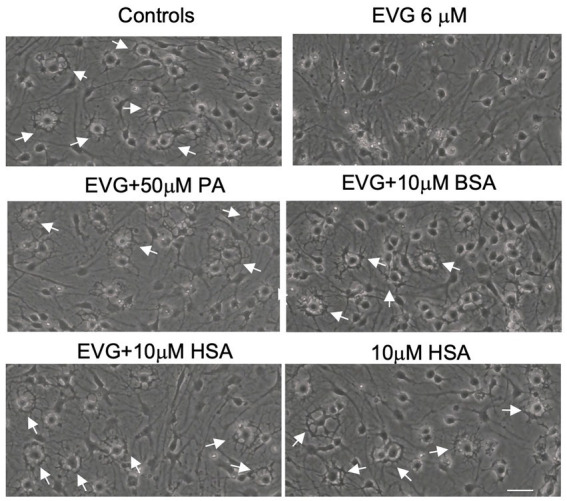
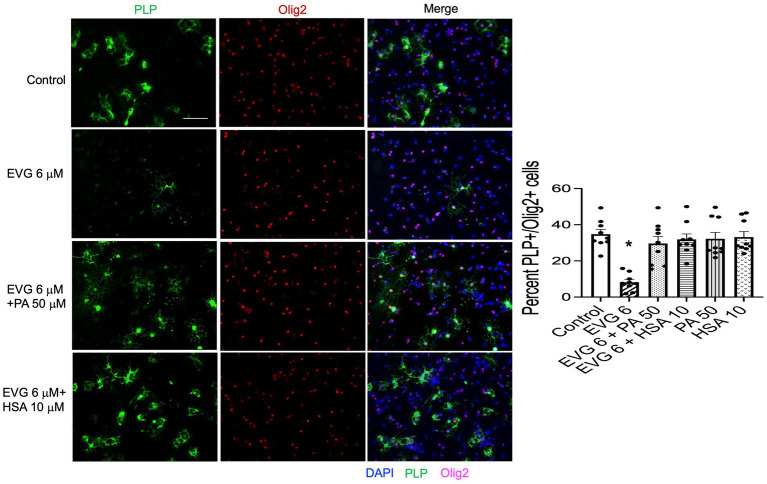
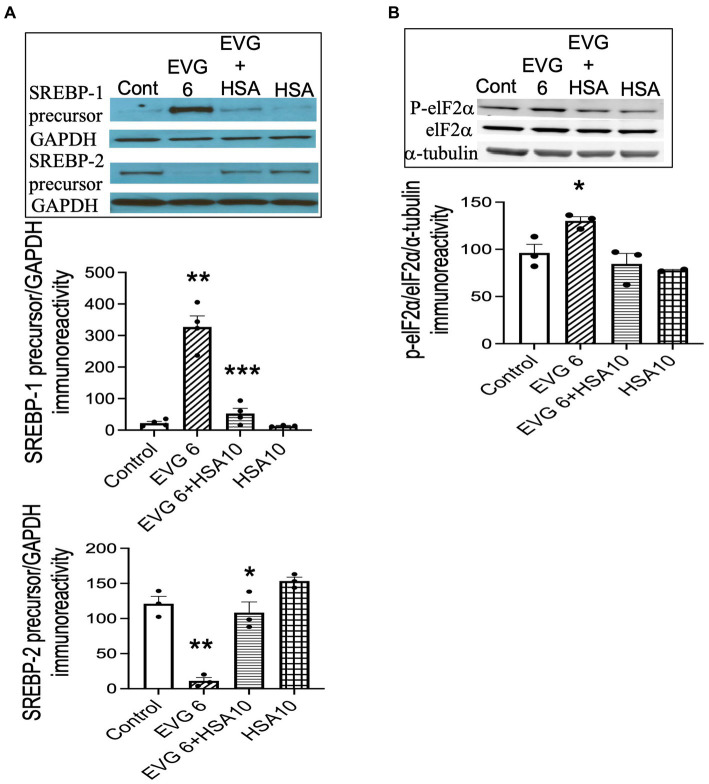
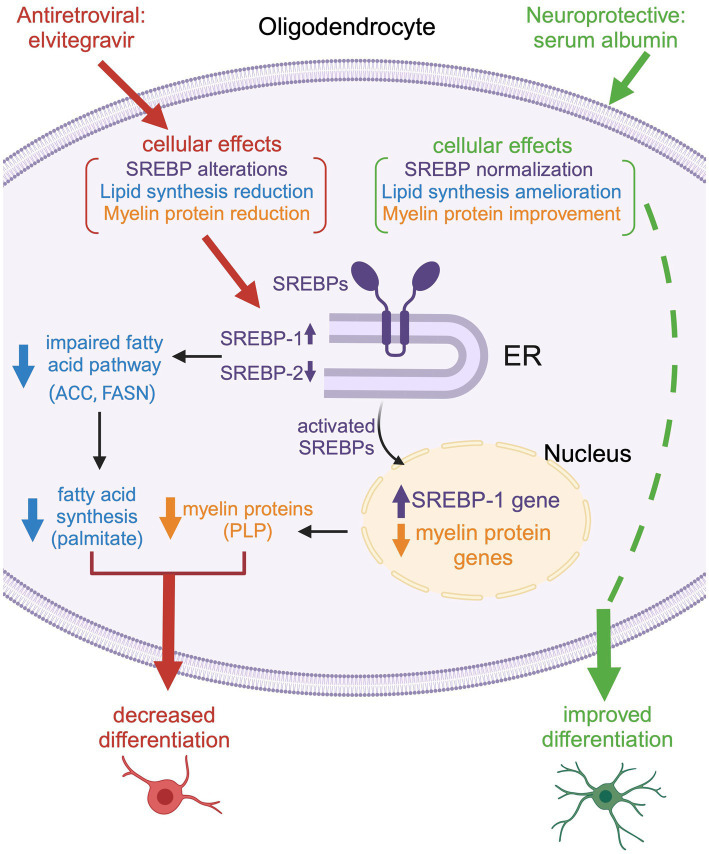
Combined antiretroviral therapy (cART) has greatly decreased mortality and morbidity among persons with HIV; however, neurologic impairments remain prevalent, in particular HIV-associated neurocognitive disorders (HANDs). White matter damage persists in cART-treated persons with HIV and may contribute to neurocognitive dysfunction as the lipid-rich myelin membrane of oligodendrocytes is essential for efficient nerve conduction. Because of the importance of lipids to proper myelination, we examined the regulation of lipid synthesis in oligodendrocyte cultures exposed to the integrase strand transfer inhibitor elvitegravir (EVG), which is administered to persons with HIV as part of their initial regimen. We show that protein levels of genes involved in the fatty acid pathway were reduced, which correlated with greatly diminished de novo levels of fatty acid synthesis. In addition, major regulators of cellular lipid metabolism, the sterol regulatory element-binding proteins (SREBP) 1 and 2, were strikingly altered following exposure to EVG. Impaired oligodendrocyte differentiation manifested as a marked reduction in mature oligodendrocytes. Interestingly, most of these deleterious effects could be prevented by adding serum albumin, a clinically approved neuroprotectant. These new findings, together with our previous study, strengthen the possibility that antiretroviral therapy, at least partially through lipid dysregulation, may contribute to the persistence of white matter changes observed in persons with HIV and that some antiretrovirals may be preferable as life-long therapy.

Keywords: HIV; Hand; SREBP; cART; myelin; oligodendrocyte.


Conflict of interest statement

The authors declare that the research was conducted in the absence of any commercial or financial relationships that could be construed as a potential conflict of interest.

Figures

Figure 1
Figure 1
Effect of elvitegravir (EVG) on cell viability in oligodendrocyte cultures. Oligodendrocyte cultures were grown in a differentiation medium with EVG (3.5, 6, or 10 μM) or without (Control). After 3 days, cells were subjected to immunocytochemistry. (A) Representative images of Olig2 immunostaining in oligodendrocyte cultures. Cells were co-labeled for DAPI to stain nuclei (blue) and Olig2 to label oligodendrocyte lineage cells (pink). Scale bar: 50 μm. The graph represents the number of Olig2-positive cells normalized to DAPI. Data are expressed as mean ± SEM from 2 independent cell culture preparations. (B) Cell viability measured as the ratio of live (fluorescein diacetate-positive)/dead (propidium iodide-positive) + live cells. The graph represents the percent cell viability after exposure to various EVG concentrations. Data are expressed as mean ± SEM from four independent cell culture preparations. *p < 0.001 versus control.
Figure 2
Figure 2
Elvitegravir (EVG) decreases oligodendrocyte maturation in vitro. Oligodendrocyte cultures were grown in a differentiation medium with EVG (3.5 or 6 μM) or without (Control). After 3 days, cells were subjected to immunocytochemistry. Representative images of proteolipid protein (PLP) immunostaining in oligodendrocyte cultures. Cells were triple-labeled for DAPI to stain nuclei (blue), PLP to label mature oligodendrocytes (green), and Olig2 to label oligodendrocyte lineage cells (pink). Scale bar: 50 μm. The graph represents the number of PLP-positive cells normalized to the number of Olig2-expressing cells. Data are expressed as mean ± SEM from three to four independent cell culture preparations. ***p < 0.0001 versus control (ANOVA).
Figure 3
Figure 3
Elvitegravir (EVG) decreases myelin protein formation in oligodendrocytes in vitro. Oligodendrocyte cultures were grown in a differentiation medium with EVG (3.5 or 6 μM) or without (Control). After 3 days, cells were harvested and prepared for immunoblotting or qRT-PCR. (A) Cell lysates were immunoblotted for PLP, and band intensities were quantified after normalization to α-tubulin as loading control. Graph data are expressed as mean ± SEM from three independent cell culture preparations. *p < 0.05 versus control. (B) qRT-PCR analysis was performed to determine PLP mRNA expression relative to that of control. Graph data are expressed as mean ± SEM from three independent cell culture preparations. **p < 0.01 versus control.
Figure 4
Figure 4
Effect of elvitegravir (EVG) on fatty acid synthesis and protein expression levels of key enzymes in the fatty acid pathway. Oligodendrocyte cultures were grown in a differentiation medium with EVG (3.5 or 6 μM) or without (Control) for 3 days. (A) Twenty-four hours before harvesting, cells were incubated with 1 mM 13C-sodium acetate. Cells were harvested and processed for quantification of de novo palmitate synthesis by gas chromatography/mass spectrometry. The graph represents new palmitate synthesis normalized to the total amount of proteins. Data are expressed as mean ± SEM from three to six independent cell culture preparations. *p < 0.005 versus control. (B,C) Western blot analysis and quantification of band intensities of (B) acetyl CoA carboxylase (ACC) and (C) fatty acid synthase (FASN) protein immunoreactivities normalized to GAPDH or α-tubulin as loading controls. Graph data are expressed as mean ± SEM from three to four independent cell culture preparations. *p < 0.05 versus control. (D,E) qRT-PCR analysis to determine (D) ACC and (E) FASN mRNA expression relative to that of control. Graph data are expressed as mean ± SEM from three independent cell culture preparations.
Figure 5
Figure 5
EVG alters the protein and mRNA expressions of sterol regulatory element-binding protein 1 (SREBP-1) in oligodendrocyte cultures. Oligodendrocyte cultures were grown in a differentiation medium with EVG (3.5 or 6 μM) or without (Control). After 3 days, cells were harvested and prepared for immunoblotting or qRT-PCR. (A,B) Western blots and quantification of band intensities of SREBP-1 precursor (A) and mature form (B) normalized to glyceraldehyde-3-phosphate dehydrogenase (GAPDH) or TATA box-binding protein (TBP) as loading controls. Graph data are expressed as mean ± SEM from three independent cell culture preparations. *p < 0.05 versus control. In (C), the graph shows mRNA expression for SREBP-1 relative to the control. Graph data are expressed as mean ± SEM from three independent cell culture preparations. *p < 0.05 versus control.
Figure 6
Figure 6
Protein expression of hydroxy-methyl-glutaryl CoA reductase (HMGCR) is not affected by EVG exposure to oligodendrocyte cultures. Oligodendrocyte cultures grown for 3 days in a differentiation medium with EVG (3.5 or 6 μM) or without (Control) were subjected to Western blot analysis and quantification of band intensities of HMGCR protein immunoreactivities normalized to α-tubulin as loading control. Graph data are expressed as mean ± SEM from three independent cell culture preparations.
Figure 7
Figure 7
EVG alters the protein expression of sterol regulatory element-binding protein 2 (SREBP-2) in oligodendrocyte cultures. Oligodendrocyte cultures were grown in a differentiation medium with EVG (3.5 or 6 μM) or without (Control). After 3 days, cells were harvested and prepared for immunoblotting or qRT-PCR. (A,B) Western blots and quantification of band intensities of SREBP-2 precursor (A) and mature form (B) normalized to GAPDH as loading control. Graph data are expressed as mean ± SEM from three independent cell culture preparations. *p < 0.05 versus control; **p < 0.01 versus control. In (C), the graph shows mRNA expression for SREBP-2 relative to the control. Graph data are expressed as mean ± SEM from three independent cell culture preparations.
Figure 8
Figure 8
Integrase strand transfer inhibitor (INSTI) raltegravir (RAL) does not affect the expression of SREBPs in oligodendrocyte cultures, while the protein expression of SREBP cleavage activating protein (SCAP) is not affected by EVG exposure to oligodendrocyte cultures. (A,B) Show Western blots and quantification of band intensities of RAL-exposed oligodendrocyte cultures grown in a differentiation medium for 3 days with RAL (3 or 10 μM) or without (Control) and probed with anti-SREBP-1 (A) and anti-SREBP-2 (B). GAPDH was used as a loading control. Graph data are expressed as mean ± SEM from two to three independent cell culture preparations. (C) Oligodendrocyte cultures grown for 3 days in a differentiation medium with EVG (3.5 or 6 μM) or without (Control) were subjected to Western blot analysis and quantification of band intensities of SCAP protein immunoreactivities normalized to α-tubulin as loading control. Graph data are expressed as mean ± SEM from three independent cell culture preparations.
Figure 9
Figure 9
EVG triggers the integrated stress response (ISR) in oligodendrocyte cultures, but the integrated stress response inhibitor (ISRIB) minimally prevents EVG-induced SREBP alterations. Oligodendrocyte cultures were grown in a differentiation medium with EVG (3.5 or 6 μM) or without (Control), plus or minus the ISR-inhibitor ISRIB (5 μM). In (A), cells were harvested at 7, 24, and 48 h or 3 days and prepared for immunoblotting, and band intensities were quantified for phosphorylated elF2α (P-elF2α), elF2α, and α-tubulin immunoreactivities. P-elF2α bands were normalized to elF2α and then to α-tubulin as loading control. Graph data are expressed as mean ± SEM from three independent cell culture preparations. *p < 0.05 versus control. In (B), cells were grown in differentiation medium for 3 days with EVG (6 μM) or without (Control), plus or minus the ISR inhibitor ISRIB (5 μM). Western blots and quantification of band intensities were performed for lysates probed with anti-SREBP-1 or anti-SREBP-2. GAPDH was used as a loading control. Graph data are expressed as mean ± SEM from three to five independent cell culture preparations. *p < 0.05 versus control; **p < 0.01 versus control; ***p < 0.05 versus EVG 6 μM.
Figure 10
Figure 10
Serum albumin protects against the EVG-induced inhibition of oligodendrocyte differentiation in oligodendrocyte cultures. Photomicrographs of sister cultures after 3 days of oligodendrocyte differentiation taken under phase-contrast microscopy. Control cultures display numerous “halo” cells representative of differentiating oligodendrocytes with processes wrapped around their cell body (arrows). Cultures exposed to EVG (6 μM) for 3 days do not show “halo” cells, and process growth is reduced. Cultures co-treated with bovine (BSA) or human (HSA) serum albumins exhibit many “halo” cells as in controls (arrows) as do cultures in which BSA-containing palmitate (PA) has been added to the culture medium. Scale bar: 35 μm.
Figure 11
Figure 11
Serum albumin protects against the EVG-induced inhibition of oligodendrocyte differentiation in oligodendrocyte cultures. Representative images of PLP immunostaining in oligodendrocyte cultures grown for 3 days in a differentiation medium with EVG (6 μM), with EVG and PA/BSA (50 μM), with EVG and HSA (10 μM), or without (Control). Cells were triple-labeled for DAPI to stain nuclei (blue), PLP to label differentiating oligodendrocytes (green), and Olig2 to label oligodendrocyte lineage cells (pink). Scale bar: 50 μm. The graph represents the number of PLP-positive cells normalized to the number of Olig2-expressing cells. *p < 0.0005 versus control, EVG 6 + PA50 and EVG 6 + HSA10 (ANOVA).
Figure 12
Figure 12
Serum albumin protects against the EVG-induced alteration in SREBP expression and prevents the increase in elF2α phosphorylation in oligodendrocyte cultures. (A) Oligodendrocyte cultures were grown in a differentiation medium with EVG (6 μM), EVG + 10 μM HSA, 10 μM HSA alone, or without (Control). After 3 days, cells were harvested and prepared for immunoblotting. Western blots and quantification of band intensities for SREBP-1 and SREBP-2 normalized to GAPDH as loading control. SREBP-1: **p < 0.005 versus control; ***p < 0.005 versus EVG 6 μM. SREBP-2: *p < 0.05 versus EVG 6 μM; **p < 0.005 versus control. (B) Western blot and quantification of band intensities for phosphorylated elF2α (P-elF2α), elF2α, and α-tubulin immunoreactivities. P-elF2α bands were normalized to elF2α and then to α-tubulin as loading control. Graph data are expressed as mean ± SEM from three independent cell culture preparations. *p < 0.05 versus control and EVG 6 μM + HSA 10 μM.
Figure 13
Figure 13
Schematic representation of the effect of EVG on oligodendrocyte maturation. Exposure to EVG alters SREBP processing (SREBP-1 is increased, while SREBP-2 is decreased), and the expression of myelin protein genes is decreased, which results in reduced myelin protein expression [such as proteolipid protein (PLP)]. In addition, the protein expression of lipid enzymes in the fatty acid pathway [acetyl-CoA carboxylase (ACC) and fatty acid synthase (FASN)] is diminished. This leads to a reduction in fatty acid synthesis (palmitate) and impaired differentiation of oligodendrocytes. Co-treatment with serum albumin mitigates the effect of EVG by ameliorating SREBP processing and restoring myelin protein expression, leading to improved oligodendrocyte maturation. However, fatty acid synthesis is not completely reestablished, suggesting that other cellular functions may remain dysregulated. Reproduced with permission from C. Long. Created with BioRender.com.

Similar articles

Cited by

References

    1. AIDSinfo (2019) Guidelines for the use of antiretroviral agents in adults and adolescents living with HIV. https://aidsinfo.nih.gov/guidelines
    1. Akay C., Cooper M., Odeleye A., Jensen B. K., White M. G., Vassoler F., et al. . (2014). Antiretroviral drugs induce oxidative stress and neuronal damage in the central nervous system. J. Neurovirol. 20, 39–53. doi: 10.1007/s13365-013-0227-1, PMID: - DOI - PMC - PubMed
    1. Baltanas F. C., Weruaga E., Valero J., Recio J. S., Alonso J. R. (2009). Albumin attenuates DNA damage in primary-cultured neurons. Neurosci. Lett. 450, 23–26. doi: 10.1016/j.neulet.2008.10.108, PMID: - DOI - PubMed
    1. Borjabad A., Morgello S., Chao W., Kim S.-Y., Brooks A. I., Murray J., et al. . (2011). Significant effects of antiretroviral therapy on global gene expression in brain tissues of patients with HIV-1-associated neurocognitive disorders. PLoS Pathog. 7:e1002213. doi: 10.1371/journal.ppat.1002213, PMID: - DOI - PMC - PubMed
    1. Braganza O., Bedner P., Huttmann K., von Staden E., Friedman A., Seifert G., et al. . (2012). Albumin is taken up by hippocampal NG2 cells and astrocytes and decreases gap junction coupling. Epilepsia 53, 1898–1906. doi: 10.1111/j.1528-1167.2012.03665.x, PMID: - DOI - PMC - PubMed

LinkOut - more resources