Polyinosinic: polycytidylic acid induced inflammation enhances while lipopolysaccharide diminishes alloimmunity to platelet transfusion in mice
- PMID: 38146372
- PMCID: PMC10749330
- DOI: 10.3389/fimmu.2023.1281130
Polyinosinic: polycytidylic acid induced inflammation enhances while lipopolysaccharide diminishes alloimmunity to platelet transfusion in mice
Abstract
Introduction: Alloimmune responses against platelet antigens, which dominantly target the major histocompatibility complex (MHC), can cause adverse reactions to subsequent platelet transfusions, platelet refractoriness, or rejection of future transplants. Platelet transfusion recipients include individuals experiencing severe bacterial or viral infections, and how their underlying health modulates platelet alloimmunity is not well understood.
Methods: This study investigated the effect of underlying inflammation on platelet alloimmunization by modelling viral-like inflammation with polyinosinic-polycytidylic acid (poly(I:C)) or gram-negative bacterial infection with lipopolysaccharide (LPS), hypothesizing that underlying inflammation enhances alloimmunization. Mice were pretreated with poly(I:C), LPS, or nothing, then transfused with non-leukoreduced or leukoreduced platelets. Alloantibodies and allogeneic MHC-specific B cell (allo-B cell) responses were evaluated two weeks later. Rare populations of allo-B cells were identified using MHC tetramers.
Results: Relative to platelet transfusion alone, prior exposure to poly(I:C) increased the alloantibody response to allogeneic platelet transfusion whereas prior exposure to LPS diminished responses. Prior exposure to poly(I:C) had equivalent, if not moderately diminished, allo-B cell responses relative to platelet transfusion alone and exhibited more robust allo-B cell memory development. Conversely, prior exposure to LPS resulted in diminished allo-B cell frequency, activation, antigen experience, and germinal center formation and altered memory B cell responses.
Discussion: In conclusion, not all inflammatory environments enhance bystander responses and prior inflammation mediated by LPS on gram-negative bacteria may in fact curtail platelet alloimmunization.
Keywords: alloantibodies; alloimmunization; inflammation; lipopolysaccharide; platelets; poly(I:C); underlying health.
Copyright © 2023 Tran, Muench, Gaillard, Darst, Tomayko and Jackman.
Conflict of interest statement
The authors declare that the research was conducted in the absence of any commercial or financial relationships that could be construed as a potential conflict of interest. The author(s) declared that they were an editorial board member of Frontiers, at the time of submission. This had no impact on the peer review process and the final decision.
Figures


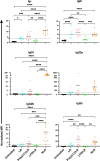
 ), received transfusion alone (
 ), poly(I:C) alone (
 ), poly(I:C) followed by transfusion (
 ), LPS alone (
 ), or LPS followed by transfusion (
 ). (p)<0.05 (*), p<0.01 (**), p<0.001 (***), and p<0.0001 (****).
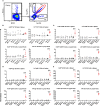
 ), received leukoreduced (LR) platelet transfusion alone (
 ), poly(I:C) followed by leukoreduced transfusion (
 ), LPS followed by leukoreduced transfusion (
 ), and non-leukoreduced (NLR) platelet transfusion alone (
 ). 10 mice per group in a single experiment. For IgG1 and IgG3, 200 was added to the raw values prior to normalization to adjust for negative values. (p)<0.05 (*), p<0.01 (**), p<0.001 (***), and p<0.0001 (****). Tick line represents mean of the group that received a leukoreduced transfusion only.
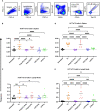
 ), received transfusion alone (
 ), poly(I:C) alone (
 ), poly(I:C) followed by transfusion (
 ), LPS alone (
 ), or LPS followed by transfusion (
 ). Splenic and lymph node cells were stained with MHC class I (B, C) and MHC class II (D, E) tetramers. Tick line represents mean of untreated group. (p)<0.05 (*), p<0.01 (**), p<0.001 (***), and p<0.0001 (****).
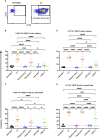
 ), received transfusion alone (
 ), poly(I:C) alone (
 ), poly(I:C) followed by transfusion (
 ), LPS alone (
 ), or LPS followed by transfusion (
 ). Splenic and lymph node cells were stained with MHC class I (B, C) and MHC class II (D, E) tetramers. Tick line represents mean of untreated group. (p)<0.05 (*), p<0.001 (***), and p<0.0001 (****).
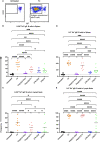
 ), received transfusion alone (
 ), poly(I:C) alone (
 ), poly(I:C) followed by transfusion (
 ), LPS alone (
 ), or LPS followed by transfusion (
 ). Splenic and lymph node cells were stained with MHC class I (B, C) and MHC class II (D, E) tetramers. Tick line represents mean of untreated group. (p)<0.05 (*), p<0.01 (**), p<0.001 (***), and p<0.0001 (****).
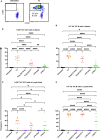
 ), received transfusion alone (
 ), poly(I:C) alone (
 ), poly(I:C) followed by transfusion (
 ), LPS alone (
 ), or LPS followed by transfusion (
 ). Splenic and lymph node cells were stained with MHC class I (B, C) and MHC class II (D, E) tetramers. (p)<0.05 (*), p<0.01 (**), and p<0.0001 (****).
 ), received transfusion alone (
 ), poly(I:C) alone (
 ), poly(I:C) followed by transfusion (
 ), LPS alone (
 ), or LPS followed by transfusion (
 ). Tick line represents mean of untreated group. (p)<0.05 (*), p<0.01 (**), p<0.001 (***), and p<0.0001 (****).
 ), received transfusion alone (
 ), poly(I:C) alone (
 ), poly(I:C) followed by transfusion (
 ), LPS alone (
 ), or LPS followed by transfusion (
 ). Tick line represents mean of untreated group. (p)<0.05 (*), p<0.01 (**), p<0.001 (***), and p<0.0001 (****).
References
Publication types
MeSH terms
Substances
Grants and funding
LinkOut - more resources
Full Text Sources
Research Materials

