

Brain oscillations in reflecting motor status and recovery induced by action observation-driven robotic hand intervention in chronic stroke
- PMID: 38146541
- PMCID: PMC10749335
- DOI: 10.3389/fnins.2023.1241772
Brain oscillations in reflecting motor status and recovery induced by action observation-driven robotic hand intervention in chronic stroke
Abstract
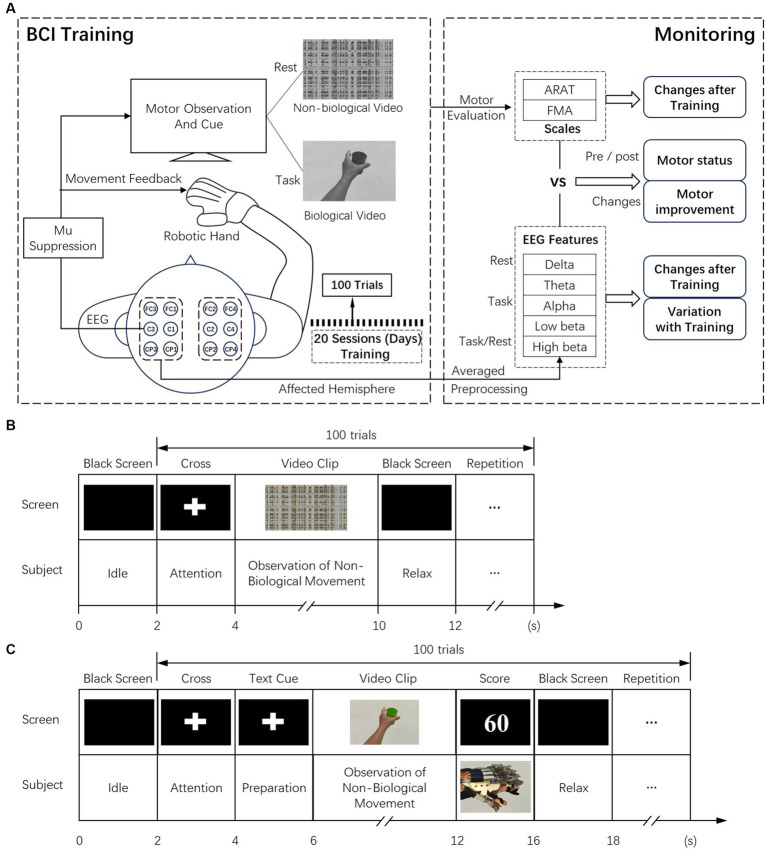
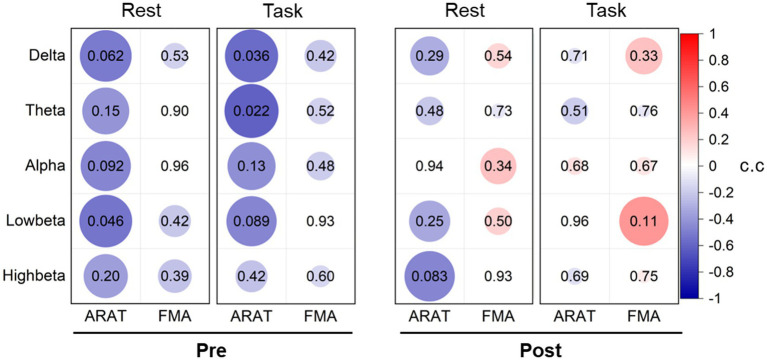
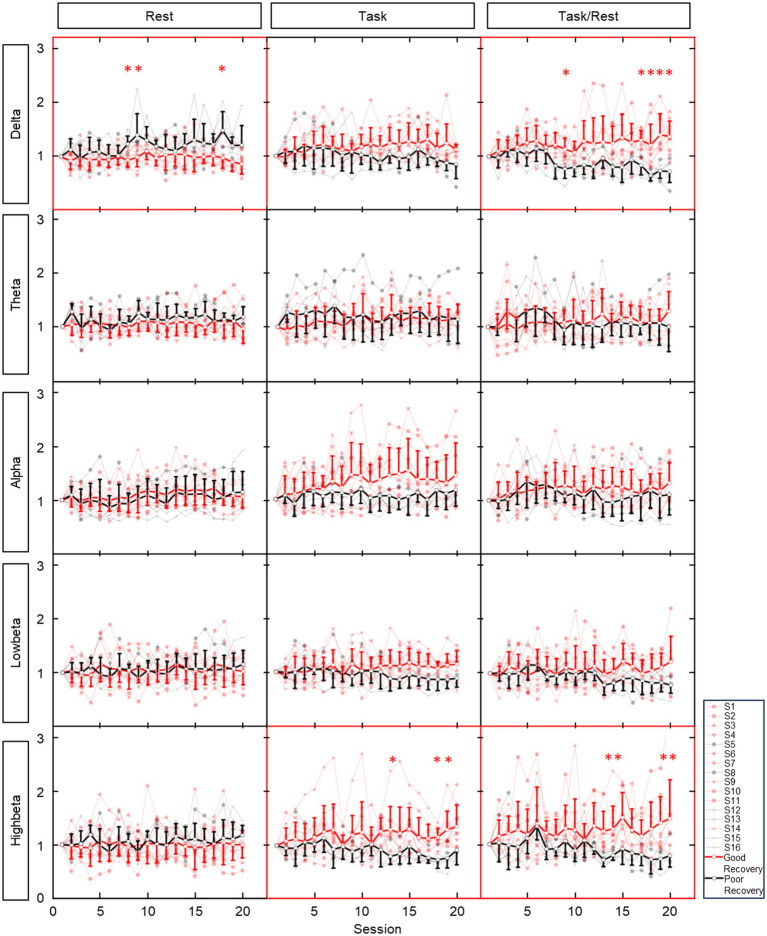
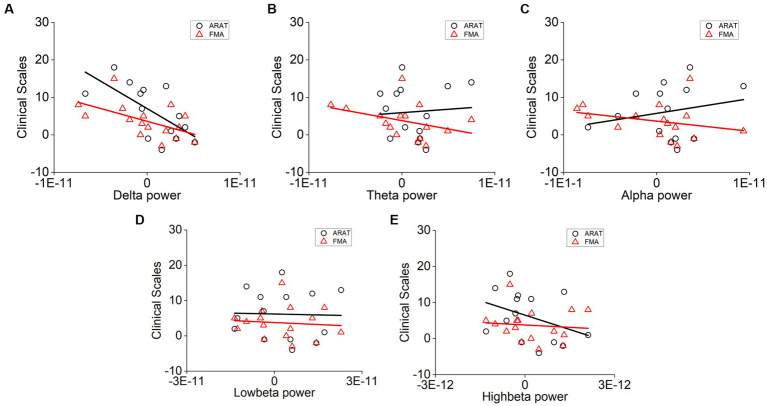
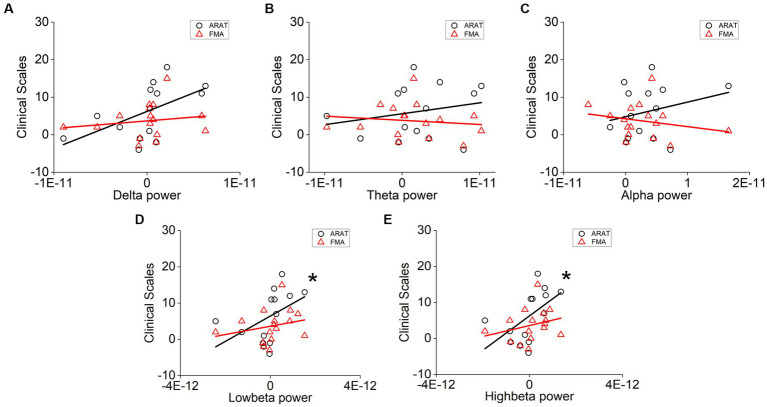
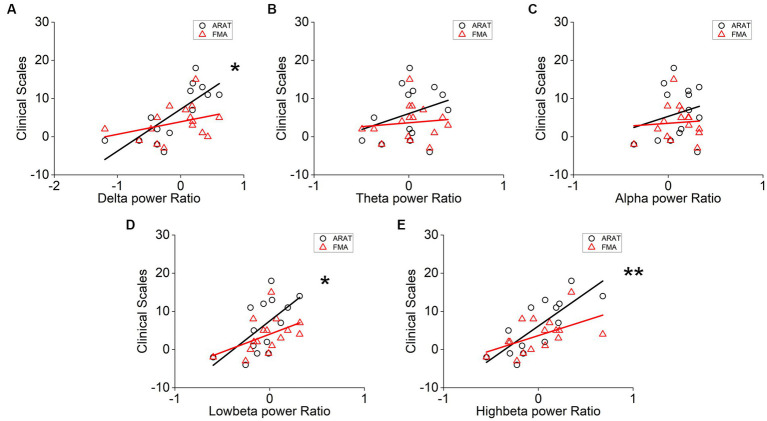
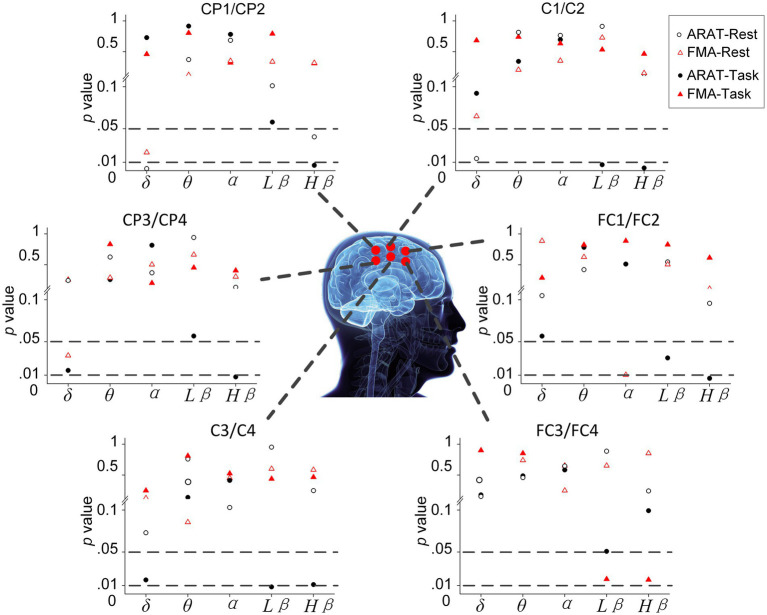
Hand rehabilitation in chronic stroke remains challenging, and finding markers that could reflect motor function would help to understand and evaluate the therapy and recovery. The present study explored whether brain oscillations in different electroencephalogram (EEG) bands could indicate the motor status and recovery induced by action observation-driven brain-computer interface (AO-BCI) robotic therapy in chronic stroke. The neurophysiological data of 16 chronic stroke patients who received 20-session BCI hand training is the basis of the study presented here. Resting-state EEG was recorded during the observation of non-biological movements, while task-stage EEG was recorded during the observation of biological movements in training. The motor performance was evaluated using the Action Research Arm Test (ARAT) and upper extremity Fugl-Meyer Assessment (FMA), and significant improvements (p < 0.05) on both scales were found in patients after the intervention. Averaged EEG band power in the affected hemisphere presented negative correlations with scales pre-training; however, no significant correlations (p > 0.01) were found both in the pre-training and post-training stages. After comparing the variation of oscillations over training, we found patients with good and poor recovery presented different trends in delta, low-beta, and high-beta variations, and only patients with good recovery presented significant changes in EEG band power after training (delta band, p < 0.01). Importantly, motor improvements in ARAT correlate significantly with task EEG power changes (low-beta, c.c = 0.71, p = 0.005; high-beta, c.c = 0.71, p = 0.004) and task/rest EEG power ratio changes (delta, c.c = -0.738, p = 0.003; low-beta, c.c = 0.67, p = 0.009; high-beta, c.c = 0.839, p = 0.000). These results suggest that, in chronic stroke, EEG band power may not be a good indicator of motor status. However, ipsilesional oscillation changes in the delta and beta bands provide potential biomarkers related to the therapeutic-induced improvement of motor function in effective BCI intervention, which may be useful in understanding the brain plasticity changes and contribute to evaluating therapy and recovery in chronic-stage motor rehabilitation.
Keywords: action observation; biomarkers; brain-computer interface; chronic stroke; electroencephalography; motor rehabilitation.
Copyright © 2023 Yue, Xiao, Wang and Tong.
Conflict of interest statement
The authors declare that the research was conducted in the absence of any commercial or financial relationships that could be construed as a potential conflict of interest.
Figures
Similar articles
-
Changes in Electroencephalography Complexity using a Brain Computer Interface-Motor Observation Training in Chronic Stroke Patients: A Fuzzy Approximate Entropy Analysis.Front Hum Neurosci. 2017 Sep 5;11:444. doi: 10.3389/fnhum.2017.00444. eCollection 2017. Front Hum Neurosci. 2017. PMID: 28928649 Free PMC article.
-
The Promotoer, a brain-computer interface-assisted intervention to promote upper limb functional motor recovery after stroke: a study protocol for a randomized controlled trial to test early and long-term efficacy and to identify determinants of response.BMC Neurol. 2020 Jun 27;20(1):254. doi: 10.1186/s12883-020-01826-w. BMC Neurol. 2020. PMID: 32593293 Free PMC article.
-
Functional brain networks assessed with surface electroencephalography for predicting motor recovery in a neural guided intervention for chronic stroke.Brain Commun. 2021 Sep 25;3(4):fcab214. doi: 10.1093/braincomms/fcab214. eCollection 2021. Brain Commun. 2021. PMID: 35350709 Free PMC article.
-
Determining optimal mobile neurofeedback methods for motor neurorehabilitation in children and adults with non-progressive neurological disorders: a scoping review.J Neuroeng Rehabil. 2022 Sep 28;19(1):104. doi: 10.1186/s12984-022-01081-9. J Neuroeng Rehabil. 2022. PMID: 36171602 Free PMC article.
-
Effect of brain-computer interface training based on non-invasive electroencephalography using motor imagery on functional recovery after stroke - a systematic review and meta-analysis.BMC Neurol. 2020 Oct 22;20(1):385. doi: 10.1186/s12883-020-01960-5. BMC Neurol. 2020. PMID: 33092554 Free PMC article.
Cited by
-
Improving Neuroplasticity through Robotic Verticalization Training in Patients with Minimally Conscious State: A Retrospective Study.Brain Sci. 2024 Mar 27;14(4):319. doi: 10.3390/brainsci14040319. Brain Sci. 2024. PMID: 38671971 Free PMC article.
References
-
- Ang K. K., Guan C., Phua K. S., Wang C., Zhou L., Tang K. Y., et al. . (2014). Brain-computer interface-based robotic end effector system for wrist and hand rehabilitation: results of a three-armed randomized controlled trial for chronic stroke. Front. Neuroengineer. 7:30. doi: 10.3389/fneng.2014.00030 - DOI - PMC - PubMed
LinkOut - more resources
Full Text Sources