

Transcranial burst electrical stimulation contributes to neuromodulatory effects in the rat motor cortex
- PMID: 38146544
- PMCID: PMC10749301
- DOI: 10.3389/fnins.2023.1303014
Transcranial burst electrical stimulation contributes to neuromodulatory effects in the rat motor cortex
Abstract
Background and objective: Transcranial Burst Electrical Stimulation (tBES) is an innovative non-invasive brain stimulation technique that combines direct current (DC) and theta burst stimulation (TBS) for brain neuromodulation. It has been suggested that the tBES protocol may efficiently induce neuroplasticity. However, few studies have systematically tested neuromodulatory effects and underlying neurophysiological mechanisms by manipulating the polarity of DC and TBS patterns. This study aimed to develop the platform and assess neuromodulatory effects and neuronal activity changes following tBES.
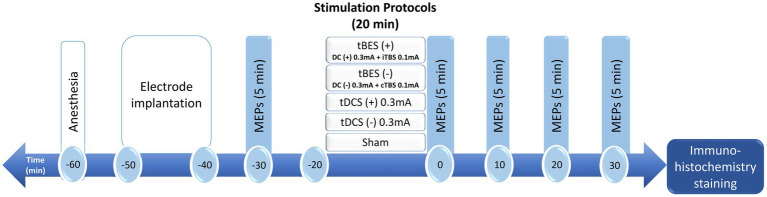
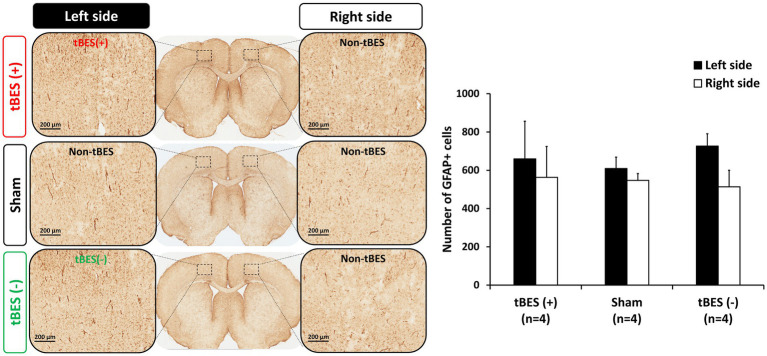
Methods: Five groups of rats were exposed to anodal DC combined with intermittent TBS (tBES+), cathodal DC combined with continuous TBS (tBES-), anodal and cathodal transcranial direct current stimulation (tDCS+ and tDCS-), and sham groups. The neuromodulatory effects of each stimulation on motor cortical excitability were analyzed by motor-evoked potentials (MEPs) changes. We also investigated the effects of tBES on both excitatory and inhibitory neural biomarkers. We specifically examined c-Fos and glutamic acid decarboxylase (GAD-65) using immunohistochemistry staining techniques. Additionally, we evaluated the safety of tBES by analyzing glial fibrillary acidic protein (GFAP) expression.
Results: Our findings demonstrated significant impacts of tBES on motor cortical excitability up to 30 min post-stimulation. Specifically, MEPs significantly increased after tBES (+) compared to pre-stimulation (p = 0.026) and sham condition (p = 0.025). Conversely, tBES (-) led to a notable decrease in MEPs relative to baseline (p = 0.04) and sham condition (p = 0.048). Although tBES showed a more favorable neuromodulatory effect than tDCS, statistical analysis revealed no significant differences between these two groups (p > 0.05). Additionally, tBES (+) exhibited a significant activation of excitatory neurons, indicated by increased c-Fos expression (p < 0.05), and a reduction in GAD-65 density (p < 0.05). tBES (-) promoted GAD-65 expression (p < 0.05) while inhibiting c-Fos activation (p < 0.05), suggesting the involvement of cortical inhibition with tBES (-). The expression of GFAP showed no significant difference between tBES and sham conditions (p > 0.05), indicating that tBES did not induce neural injury in the stimulated regions.
Conclusion: Our study indicates that tBES effectively modulates motor cortical excitability. This research significantly contributes to a better understanding of the neuromodulatory effects of tBES, and could provide valuable evidence for its potential clinical applications in treating neurological disorders.
Keywords: motor evoked potential; neuromodulation; neuroplasticity; rats; transcranial burst electrical stimulation.
Copyright © 2023 Nguyen, Kuo, Peng, Liu, Chang and Hsieh.
Conflict of interest statement
The authors declare that the research was conducted in the absence of any commercial or financial relationships that could be construed as a potential conflict of interest.
Figures


Similar articles
-
Temporal interference stimulation over the motor cortex enhances cortical excitability in rats.Sci Rep. 2025 May 15;15(1):16933. doi: 10.1038/s41598-025-01008-z. Sci Rep. 2025. PMID: 40374770 Free PMC article.
-
Neuromodulatory Responses Elicited by Intermittent versus Continuous Transcranial Focused Ultrasound Stimulation of the Motor Cortex in Rats.Int J Mol Sci. 2024 May 23;25(11):5687. doi: 10.3390/ijms25115687. Int J Mol Sci. 2024. PMID: 38891875 Free PMC article.
-
Tracking the Effect of Cathodal Transcranial Direct Current Stimulation on Cortical Excitability and Connectivity by Means of TMS-EEG.Front Neurosci. 2018 May 15;12:319. doi: 10.3389/fnins.2018.00319. eCollection 2018. Front Neurosci. 2018. PMID: 29867330 Free PMC article.
-
Modulating Human Auditory Processing by Transcranial Electrical Stimulation.Front Cell Neurosci. 2016 Mar 7;10:53. doi: 10.3389/fncel.2016.00053. eCollection 2016. Front Cell Neurosci. 2016. PMID: 27013969 Free PMC article. Review.
-
Transcranial electrical stimulation (TES) in human motor Optimization: Mechanisms, safety, and emerging applications.Biochem Biophys Rep. 2025 Jun 2;43:102055. doi: 10.1016/j.bbrep.2025.102055. eCollection 2025 Sep. Biochem Biophys Rep. 2025. PMID: 40519699 Free PMC article. Review.
Cited by
-
Temporal interference stimulation over the motor cortex enhances cortical excitability in rats.Sci Rep. 2025 May 15;15(1):16933. doi: 10.1038/s41598-025-01008-z. Sci Rep. 2025. PMID: 40374770 Free PMC article.
References
LinkOut - more resources
Full Text Sources
Miscellaneous