. 2024 May 3;147(5):1710-1725.
doi: 10.1093/brain/awad432.

New cyclophilin D inhibitor rescues mitochondrial and cognitive function in Alzheimer's disease

Affiliations

New cyclophilin D inhibitor rescues mitochondrial and cognitive function in Alzheimer's disease

Sourav Samanta et al. Brain. .

Abstract

Mitochondrial dysfunction is an early pathological feature of Alzheimer disease and plays a crucial role in the development and progression of Alzheimer's disease. Strategies to rescue mitochondrial function and cognition remain to be explored. Cyclophilin D (CypD), the peptidylprolyl isomerase F (PPIase), is a key component in opening the mitochondrial membrane permeability transition pore, leading to mitochondrial dysfunction and cell death. Blocking membrane permeability transition pore opening by inhibiting CypD activity is a promising therapeutic approach for Alzheimer's disease. However, there is currently no effective CypD inhibitor for Alzheimer's disease, with previous candidates demonstrating high toxicity, poor ability to cross the blood-brain barrier, compromised biocompatibility and low selectivity. Here, we report a new class of non-toxic and biocompatible CypD inhibitor, ebselen, using a conventional PPIase assay to screen a library of ∼2000 FDA-approved drugs with crystallographic analysis of the CypD-ebselen crystal structure (PDB code: 8EJX). More importantly, we assessed the effects of genetic and pharmacological blockade of CypD on Alzheimer's disease mitochondrial and glycolytic bioenergetics in Alzheimer's disease-derived mitochondrial cybrid cells, an ex vivo human sporadic Alzheimer's disease mitochondrial model, and on synaptic function, inflammatory response and learning and memory in Alzheimer's disease mouse models. Inhibition of CypD by ebselen protects against sporadic Alzheimer's disease- and amyloid-β-induced mitochondrial and glycolytic perturbation, synaptic and cognitive dysfunction, together with suppressing neuroinflammation in the brain of Alzheimer's disease mouse models, which is linked to CypD-related membrane permeability transition pore formation. Thus, CypD inhibitors have the potential to slow the progression of neurodegenerative diseases, including Alzheimer's disease, by boosting mitochondrial bioenergetics and improving synaptic and cognitive function.

Keywords: Alzheimer disease; CypD inhibitor; amyloid beta; high-throughput screening; mitochondrial respiratory and glycolytic function.


Conflict of interest statement

The authors report no competing interests.

Figures

Figure 1
Figure 1
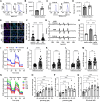
Upregulation of CypD expression and increased mPTP opening in Alzheimer’s disease cybrid cells. (A) Quantification of cyclophilin D (CypD) mRNA in Alzheimer’s disease (AD) and non-Alzheimer’s disease (nonAD) cybrid cells. (B) Representative immunoblots are shown with CypD immunoreactive band intensity data normalized to the mitochondrial marker Hsp60 expressed as fold changes in Alzheimer’s disease versus non-Alzheimer’s disease cybrid cells. (C) Representative immunostaining for CypD (green) and nuclei (blue) in non-Alzheimer’s disease and Alzheimer’s disease cells. (D) Quantification of CypD staining fluorescence intensity using the NIH-ImageJ program (n = 53–55 cells per group). (E and F) Fluorescence-activated cell sorting (FACS) analysis of mitochondrial permeability transition pore (mPTP) stained with calcein in the presence of Co2+ in non-Alzheimer’s disease and Alzheimer’s disease cells. Representative histograms for FACS analysis of calcein staining (E) and percentage of calcein signals (F) with respective to only calcein treated controls (100%). Data are expressed as mean ± standard error of the mean (SEM). (GK) Impairment of mitochondrial respiration in Alzheimer’s disease cybrid cells. Representative real time oxygen consumption rate (OCR) profile of Alzheimer’s disease and non-Alzheimer’s disease cybrid cells determined by the Seahorse XF96e Analyzer (G). OCR was determined upon sequential exposure to oligomycin (Oligo, 2.5 µM), FCCP (2.0 µM), and rotenone/antimycin (Rot/AA, 0.5 µM). OCR under basal condition (basal OCR) (H), maximal OCR (I) and ATP-linked OCR (J). (K) Quantification of mitochondrial ATP production rate was determined by the Seahorse XF96e Analyzer in response to oligomycin (2.5 µM) and rotenone/antimycin (0.5 µM) treatment. Data are presented as mean ± SEM and the number of samples in each group is 39–45 from 5–6 cell lines, respectively. Data were analysed by unpaired t-test, as indicated by *P < 0.05.
Figure 2
Figure 2
Reduced glycolytic function in Alzheimer’s disease cybrid cells. Representative real time oxygen consumption rate (OCR) (A) and extracellular acidification rate (ECAR) (B), total proton efflux rate (PER) (C) profile in Alzheimer’s disease (AD) and non-Alzheimer’s disease (nonAD) cybrid cells determined by the Seahorse XF96e Analyzer. The glycolytic function was determined upon sequential exposure of rotenone/antimycin (Rot/AA, 0.5 µM) and 2-deoxy-D-glucose (2-DG, 50 mM). Quantification of basal (D) and maximal glycolytic capacity (E) from Alzheimer’s disease and non-Alzheimer’s disease cybrid cell lines. (F) The quantification of glycolytic ATP production rate of Alzheimer’s disease and non-Alzheimer’s disease cybrid cell was determined by the Seahorse XF96e Analyzer in response to oligomycin (2.5 µM) and rotenone/antimycin (0.5 µM) treatment. The data are represented as mean ± standard error of the mean (SEM), number of samples in each group is 40–46 from 5–6 cell lines. The data were analysed by unpaired t-test, as indicated by *P < 0.05.
Figure 3
Figure 3
Effects of mitochondrial ROS on mitochondrial and glycolytic function in Alzheimer’s disease cybrid cells. Effects of a mitochondria targeting antioxidant (mitoTEMPO) on mitochondrial respiration and glycolytic function in Alzheimer’s disease (AD) cybrid cells. (A) Representative real time oxygen consumption rate (OCR) of vehicle and mitoTEMPO treated (24 h) Alzheimer’s disease cybrid cells, determined by the Seahorse XF96e Analyzer. Treatment of mitoTEMPO (5 µM) improved the basal OCR (B), maximal OCR (C) and ATP-linked OCR (D) in Alzheimer’s disease cybrid cells compared to vehicle treatment. Representative real time OCR (E), extracellular acidification rate (ECAR) (F) and total proton efflux rate (PER) (G) profile in Alzheimer’s disease cybrid cells treated with vehicle or mitoTEMPO (24 h) determined by the Seahorse XF96e Analyzer. Quantification of basal (H) and maximal glycolytic capacity (I) in Alzheimer’s disease cybrid cells treated with vehicle or mitoTEMPO (5 µM). (AD) OCR was determined upon sequential exposure to oligomycin (Oligo, 2.5 µM), FCCP (2.0 µM) and rotenone/antimycin (Rot/AA, 0.5 µM). (EI) OCR, ECAR and PER were determined upon sequential exposure to rotenone/antimycin (Rot/AA, 0.5 µM) and 2-deoxy-D-glucose (2-DG, 50 mM). Data are expressed as mean ± standard error of the mean (SEM) and n = 7 per group. Data were analysed by unpaired t-test, as indicated by *P< 0.05. ROS = reactive oxygen species.
Figure 4
Figure 4
Inhibition of ebselen on CypD activity and crystal structure for ebselen bound to CypD. (A) Ebselen inhibits cyclophilin D (CypD) activity in a dose-dependent manner with an IC50 = 1.5 ± 0.34 µM. Ebselen did not inhibit the chymotrypsin in a counter-screen assay. (B) Reaction scheme of ebselen binding to Cys115 of CypD. (C) Electron density map of ebselen bound to CypD. Fo-Fc omits map contoured at 3 s (green mesh). (D) Electrostatic surface representation showing the CypD binding pocket environment occupied by ebselen (grey spheres). (E and F) Superposition of ebselen bound CypD (magenta) with apo (4O8H, light green) and cyclosporin A bound (2Z6W, cyan). The cyclosporin A molecule is coloured tan, and ebselen is shown in grey. Differences in the loop spanning Cys115 to Val128 upon binding of ebselen. (F) Conformational changes in residues Phe60 and 113 to accommodate binding of ebselen. (G) Reduced CypD activity in Alzheimer’s disease cybrid cells exposed to ebselen (n = 5 cell lines/group). (H) Administration of ebselen suppresses CypD activity in the brain of mice compared with vehicle-treated control mice by daily intraperitoneal injection (2.5 mg/kg, n = 5–6 mice/group). Data were analysed by unpaired t-test, as indicated by *P < 0.05, ***P < 0.001.
Figure 5
Figure 5
Ebselen attenuates impaired mPTP and enhances mitochondrial function in Alzheimer’s disease cybrid cells. (AD) Fluorescence-activated cell sorting (FACS) analysis of calcein staining signals in Alzheimer’s disease (AD) cybrid cells with and without ebselen treatment (2.5 µM) in the presence (A and B) or absence (C and D) of Co2+. Quantification of calcein fluorescence signals in Alzheimer’s disease cybrids treated with ebselen or vehicle in the presence (B) or absence (D) of Co2+. Data are expressed as mean ± standard error of the mean (SEM) and n = 9 per group. Data were analysed by unpaired t-test as indicated by *P < 0.05. (E) Effect of ebselen on mitochondrial membrane potential. Representative staining images of tetramethylrhodamine (TMRM) (red, left) with MitoTracker green (middle) in vehicle-treated non-Alzheimer’s disease and Alzheimer’s disease cybrid cells, and ebselen (2.5 µM) treated Alzheimer’s disease cybrid cells. Nuclei were stained with DRAQ5 (blue). (F) Quantification of TMRM fluorescence intensity relative to signal in vehicle-treated non-Alzheimer’s disease cybrid cells. Data are expressed as mean ± SEM, the number of cells in each group is 57–70. Data were analysed by one-way ANOVA followed by Fisher's Least Significant Difference (LSD) tests, as indicated by *P < 0.05. (G and H) Effect of ebselen on reactive oxygen species (ROS). Representative electron paramagnetic resonance (EPR) spectra (G) and ROS levels by quantification of EPR spectra (H) in nonTg mice brain slices treated with vehicle, Aꞵ42 oligomers (Aꞵ42, 200 nM) and Aꞵ42 + ebselen (2.5 µM). Data are presented as mean ± SEM and n = 4 mice per group, respectively. Data were analysed by one-way ANOVA followed by Fisher post hoc test, as indicated by *P < 0.05. (IM) Effect of ebselen on mitochondrial respiration. (I) Representative real time oxygen consumption rate (OCR) of vehicle and ebselen treated (24 h) Alzheimer’s disease cybrid cells, determined by the Seahorse XF96e Analyzer. Ebselen (2.5 µM) improved respiration under basal conditions [basal OCR (J), maximal OCR (K) and ATP-linked OCR (L)] of Alzheimer’s disease cybrid cells. (M) Mitochondrial ATP production rates following vehicle or ebselen (2.5 µM) treatment were measured by the Seahorse XF96e Analyzer in Alzheimer’s disease cybrid cells in response to oligomycin (2.5 µM) and rotenone/antimycin (0.5 µM) treatments. Data are expressed as mean ± SEM, the number of samples in each group is 45–47 from six Alzheimer’s disease cell lines. Data were analysed by unpaired t-test and indicated as *P < 0.05. (NQ) Ebselen (submicromolar concentrations) has a dose-dependent effect on mitochondrial respiration. (N) Representative real time OCR of Alzheimer’s disease cybrid cells treated with vehicle and ebselen (24 h). Ebselen improved respiration under basal conditions (basal OCR) (O), maximal OCR (P) and ATP-linked OCR (Q) of Alzheimer’s disease cybrid cells in a dose-dependent manner. Data are expressed as mean ± SEM and analysed by one-way ANOVA followed by Fisher's Least Significant Difference (LSD) tests, as indicated by *P < 0.05. OCR was determined upon sequential exposure to oligomycin (Oligo, 2.5 µM), FCCP (2.0 µM) and rotenone/antimycin (Rot/AA, 0.5 µM). mPTP = membrane permeability transition pore; ns = no significance.
Figure 6
Figure 6
Ebselen attenuates impaired glycolytic function in Alzheimer’s disease cybrid cells. Representative real time oxygen consumption rate (OCR) (A), extracellular acidification rate (ECAR) (B) and total proton efflux rate (PER) (C) profile in vehicle- or ebselen-treated Alzheimer’s disease cybrid cells, determined by the Seahorse XF96e Analyzer. Ebselen (2.5 µM) improved the basal (D) and maximal (E) glycolytic capacity in Alzheimer’s disease cybrid cells compared to vehicle treatment. Glycolytic function was determined upon sequential exposure to rotenone/antimycin (Rot/AA, 0.5 µM) and 2-deoxy-D-glucose (2-DG, 50 mM). Data are expressed as mean ± standard error of the mean (SEM), the number of samples in each group was 45 from six Alzheimer’s disease cell lines. Data were analysed by unpaired t-test, as indicated by *P < 0.05. (F) Quantification of glycolytic ATP production rate of vehicle- or ebselen (2.5 µM)-treated (24 h) Alzheimer’s disease cybrid cell was determined by the Seahorse XF96e Analyzer in response to oligomycin (2.5 µM) and rotenone/antimycin (0.5 µM) treatment. Data are expressed as mean ± SEM, the number of samples in each group was 45 from six Alzheimer’s disease cell lines. Data were analysed by unpaired t-test, as indicated by *P < 0.05. (GK) Ebselen has a dose-dependent effect on glycolytic function. Representative real time OCR (G), ECAR (H) and PER (I) profile in Alzheimer’s disease cybrid cells treated with vehicle or ebselen (24 h). Ebselen improved the basal (J) and maximal (K) glycolytic capacity in Alzheimer’s disease cybrid cells in a concentration-dependent manner. Data are expressed as mean ± SEM and analysed by one-way ANOVA followed by Bonferroni’s multiple comparisons tests as indicated by *P < 0.05. Glycolytic function was determined upon sequential exposure to rotenone/antimycin (Rot/AA, 0.5 µM) and 2-deoxy-D-glucose (2-DG, 50 mM). ns = no significance.
Figure 7
Figure 7
Ebselen inhibits CypD-mediated mitochondrial dysfunction. (A) Immunoblotting of cell lysates revealed increased expression of human cyclophilin D (CypD) in cybrid cells transfected with pcDNA3-hCypD as compared with pcDNA3 vector-transfected cybrids. n = 3–4/group. *P < 0.05 (B) Representative real time oxygen consumption rate (OCR) of Alzheimer’s disease cybrid cells treated with pcDNA3 (Vector), pcDNA3-hCypD (hCypD) and pcDNA3-hCypD + ebselen (hCypD + Ebselen) determined by the Seahorse XF96e Analyzer. Quantification of basal OCR (C) and maximal OCR (D) and ATP-linked OCR (E) in the indicated group of cells. Data are presented as mean ± standard error of the mean (SEM) and n = 7 for each group. Data were analysed by one-way ANOVA followed be Fisher post hoc test, as indicated by *P < 0.05. ns = no significance.
Figure 8
Figure 8
Inhibition of CypD by ebselen rescues amyloid-β-impaired mitochondrial, synaptic function and learning and memory in Alzheimer’s disease mice. Complex IV (COX IV) activity (A), ATP (B) and H2O2 (C) levels were measured in the brains of 12-month-old transgenic mAPP mice and non-transgenic (nonTg) mice, starting at 11 months of age, by vehicle or ebselen treated daily intraperitoneal injection. (DG) Effects of ebselen on amyloid-β (Aβ)-induced alterations of basal synaptic transmission (BST) and long term potentiation (LTP) in hippocampal slices from 3-month-old wild-type (WT) mice perfused with oligomer Aβ (200 nM) in the presence or absence of ebselen (10 μM). (D) The field-excitatory post-synaptic potentials (fEPSPs) plotted against stimulation intensity did not differ among indicated groups. However, the Aβ-treated groups displayed compromised synaptic activity. (E) Hippocampal CA1-CA3 LTP was recorded in the indicated groups. (F) LTP amplitudes in the indicated groups of mice were calculated by an average of fEPSP slopes for 50–60 min after theta burst stimulation. (G) There was no significant difference in basal synaptic activity between groups of mice. All data are expressed as mean ± standard error of the mean (SEM), analysed by one-way ANOVA followed by Fisher post hoc tests, indicated as *P < 0.05. n = 7–10 slices per group from six male mice. Alzheimer’s disease mice were intraperitoneally injected with ebselen once a day for 8 weeks and then subjected to the Morris water maze (MWM) test. (H) Escape latencies in the hidden platform during MWM task training in indicated groups. (I) Mean number of crossings of the target during the probe test. (J) Time spent in the quadrant with the hidden platform. (K) Representative searching trajectory during the probe test. (L) Swimming speed of the indicated groups of mice. All data are expressed as mean ± SEM, analysed by one-way ANOVA with Fisher's Least Significant Difference (LSD) test, indicated as *P < 0.05. n = 8–15 mice per group, including male and female mice. AD = Alzheimer’s disease; CypD = cyclophilin D.

References

    1. Ray WJ, Buggia-Prevot V. Novel targets for Alzheimer's disease: A view beyond amyloid. Annu Rev Med. 2021;72:15–28. - PubMed
    1. Ramanan VK, Day GS. Anti-amyloid therapies for Alzheimer disease: Finally, good news for patients. Mol Neurodegener. 2023;18:42. - PMC - PubMed
    1. Yadollahikhales G, Rojas JC. Anti-Amyloid immunotherapies for Alzheimer's disease: A 2023 clinical update. Neurotherapeutics. 2023;20:914–931. - PMC - PubMed
    1. Gibson GE, Sheu KF, Blass JP. Abnormalities of mitochondrial enzymes in Alzheimer disease. J Neural Transm. 1998;105(8-9):855–870. - PubMed
    1. Humphries KM, Yoo Y, Szweda LI. Inhibition of NADH-linked mitochondrial respiration by 4-hydroxy-2-nonenal. Biochemistry. 1998;37:552–557. - PubMed

Publication types

MeSH terms