

Healthy life expectancy for 202 countries up to 2030: Projections with a Bayesian model ensemble
- PMID: 38146817
- PMCID: PMC10750449
- DOI: 10.7189/jogh.13.04185
Healthy life expectancy for 202 countries up to 2030: Projections with a Bayesian model ensemble
Abstract
Background: Healthy life expectancy (HLE) projections are required for optimising social and health service management in the future. Existing studies on the topic were usually conducted by selecting a single model for analysis. We thus aimed to use an ensembled model to project the future HLE for 202 countries/region.
Methods: We obtained data on age-sex-specific HLE and the sociodemographic index (SDI) level of 202 countries from 1990 to 2019 from the Global Burden of Disease (GBD) database and used a probabilistic Bayesian model comprised of 21 forecasting models to predict their HLE in 2030.
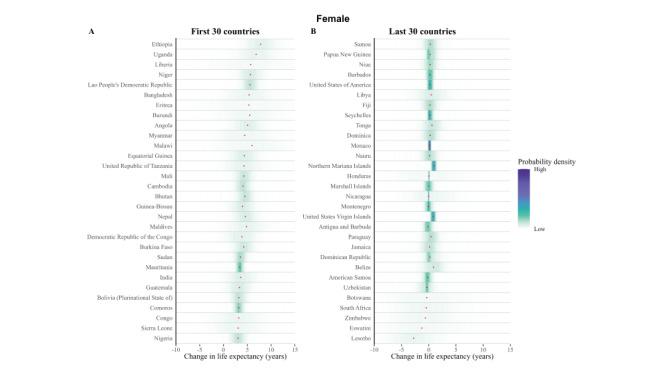
Results: In general, HLE is projected to increase in all 202 countries, with the least probability of 82.4% for women and 81.0% for men. Most of the countries with the lowest projected HLE would be located in Africa. Women in Singapore have the highest projected HLE in 2030, with a 94.5% probability of higher than 75.2 years, which is the highest HLE in 2019 across countries. Maldives, Kuwait, and China are projected to have a probability of 49.3%, 41.2% and 31.6% to be the new entries of the top ten countries with the highest HLE for females compared with 2019. Men in Singapore are projected to have the highest HLE at birth in 2030, with a 93.4% probability of higher than 75.2 years. Peru and Maldives have a probability of 48.7% and 35.3% being new top ten countries in male's HLE. The female advantage in HLE will shrink by 2030 in 117 countries, especially in most of the high SDI and European countries.
Conclusions: HLE will likely continue to increase in most countries and regions worldwide in the future. More attention needs to be paid to combatting obesity, chronic diseases, and specific infectious diseases, especially in African and some Pacific Island countries. Although gender gaps may not be fully bridged, HLE could partially mitigate and even eliminate them through economic development and improvements in health care.
Copyright © 2023 by the Journal of Global Health. All rights reserved.
Conflict of interest statement
Disclosure of interest: The authors completed the ICMJE Disclosure of Interest Form (available upon request from the corresponding author) and disclose no relevant interests.
Figures


References
MeSH terms
LinkOut - more resources
Full Text Sources
Medical
