. 2024 Mar 4;12(3):322-333.
doi: 10.1158/2326-6066.CIR-23-0389.

FcγRIIB Is an Immune Checkpoint Limiting the Activity of Treg-Targeting Antibodies in the Tumor Microenvironment

Affiliations

FcγRIIB Is an Immune Checkpoint Limiting the Activity of Treg-Targeting Antibodies in the Tumor Microenvironment

David A Knorr et al. Cancer Immunol Res. .

Abstract

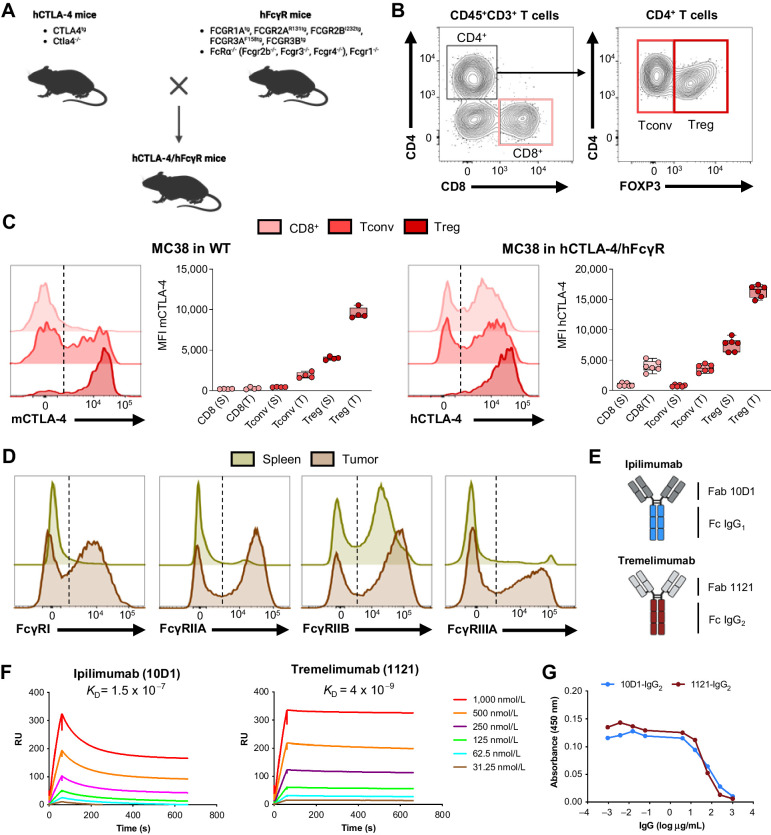
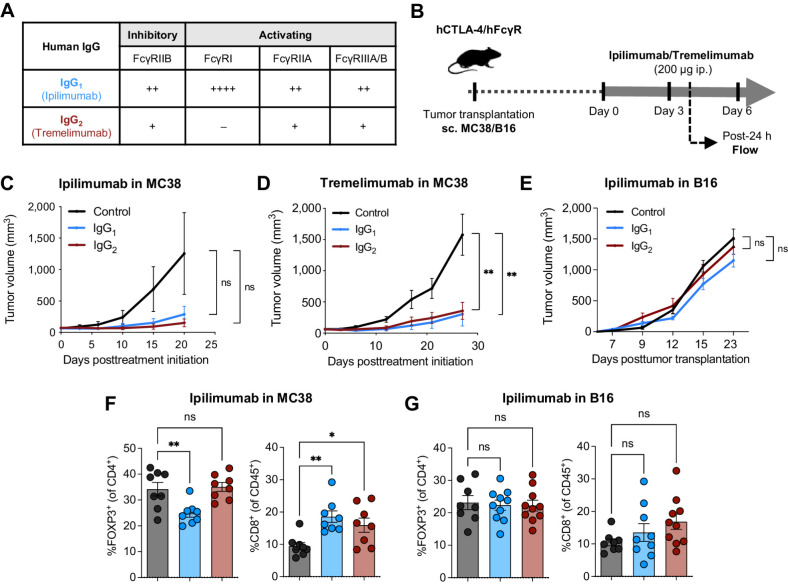
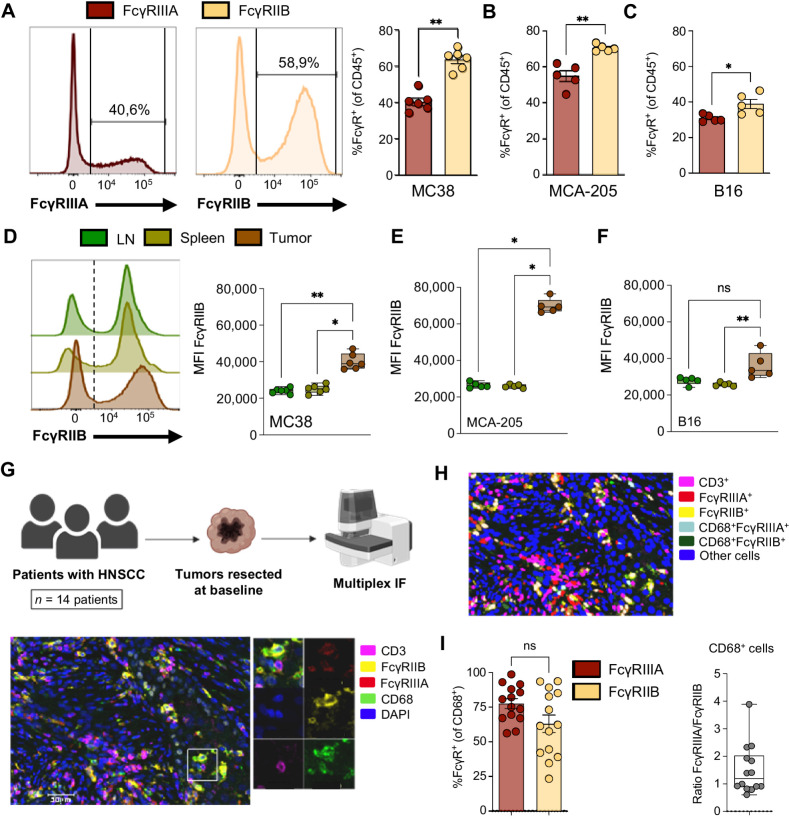
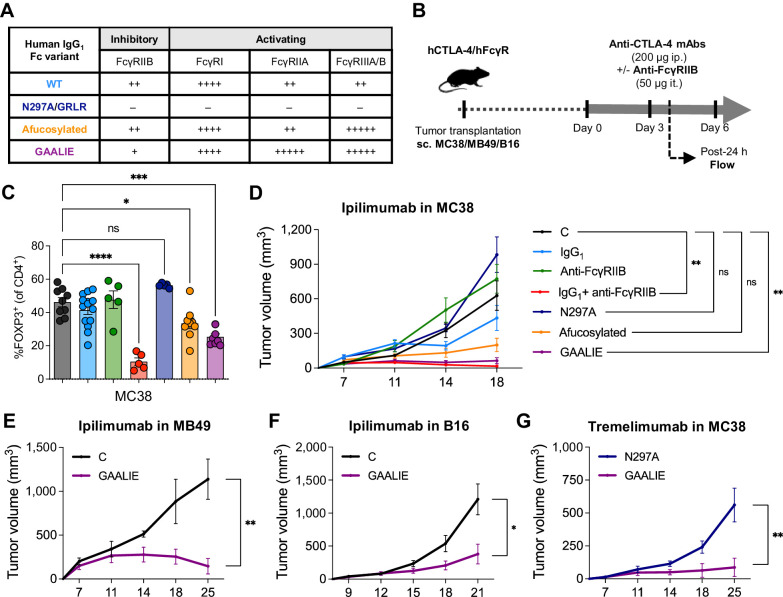
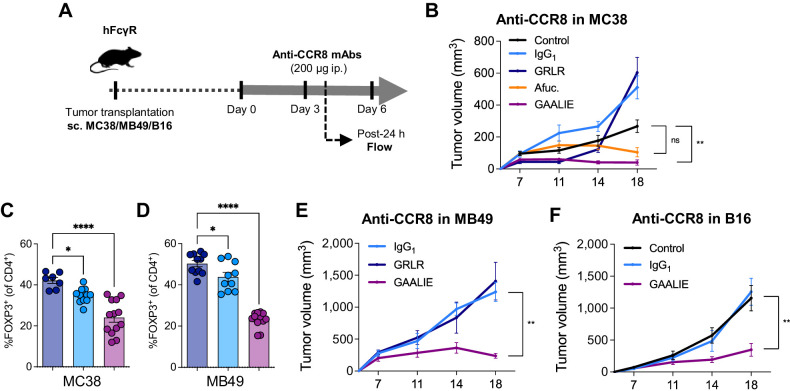
Preclinical murine data indicate that fragment crystallizable (Fc)-dependent depletion of intratumoral regulatory T cells (Treg) is a major mechanism of action of anti-CTLA-4. However, the two main antibodies administered to patients (ipilimumab and tremelimumab) do not recapitulate these effects. Here, we investigate the underlying mechanisms responsible for the limited Treg depletion observed with these therapies. Using an immunocompetent murine model humanized for CTLA-4 and Fcγ receptors (FcγR), we show that ipilimumab and tremelimumab exhibit limited Treg depletion in tumors. Immune profiling of the tumor microenvironment (TME) in both humanized mice and humans revealed high expression of the inhibitory Fc receptor, FcγRIIB, which limits antibody-dependent cellular cytotoxicity/phagocytosis. Blocking FcγRIIB in humanized mice rescued the Treg-depleting capacity and antitumor activity of ipilimumab. Furthermore, Fc engineering of antibodies targeting Treg-associated targets (CTLA-4 or CCR8) to minimize FcγRIIB binding significantly enhanced Treg depletion, resulting in increased antitumor activity across various tumor models. Our results define the inhibitory FcγRIIB as an immune checkpoint limiting antibody-mediated Treg depletion in the TME, and demonstrate Fc engineering as an effective strategy to overcome this limitation and improve the efficacy of Treg-targeting antibodies.


Figures

Figure 1. A humanized mouse model to study the Fc effector function of human anti–CTLA-4. A, Schematic drawing describing the generation of humanized CTLA-4/FcγR mice. The genotypes of the mouse strains used for the crossing are presented. B and C, Flow cytometric analysis of CTLA-4 in CD45+CD3+ T cells isolated from spleens and tumors from humanized CTLA-4/FcγR mice. B, Representative dot plots illustrating the gating strategy for identification of CD8+ T cells, FOXP3– conventional CD4+ T cells (Tconv) and FOXP3+ CD4+ Tregs in MC38 tumors from humanized CTLA-4/FcγR mice. C, Levels of expression of mouse CTLA-4 (mCTLA-4) and human CTLA-4 (hCTLA-4) in the indicated T-cell subsets in spleens (S) and tumors (T) from WT (left, n = 4) and humanized CTLA-4/FcγR mice (right, n = 6) bearing MC38 tumors. Representative histograms and quantification of the mean fluorescence intensity (MFI) ± SEM are shown. Dotted lines indicate Fluorescence Minus One (FMO) controls. Each symbol represents an individual mouse and are from one experiment. D, Flow cytometric analysis of human FcγRs in CD45+ immune cells isolated from spleens and tumors from humanized CTLA-4/FcγR mice bearing MC38 tumors. Representative histograms from one experiment are shown. Dotted lines indicate FMO controls. E, Schema outlining the composition of the recombinant human anti–CTLA-4 antibodies used in the study. The Fab and Fc regions used for the generation of recombinant ipilimumab (top) and tremelimumab (bottom) antibodies are described. F, Evaluation of the binding of the recombinant ipilimumab (left) and tremelimumab (right) antibodies to hCTLA-4 by surface plasmon resonance. The dissociation constant (KD) of each antibody is shown. RU, response units. Data are from one experiment. G, Competitive ELISA evaluating the capacity of recombinant hIgG2 ipilimumab (clone 10D1) and hIgG2 tremelimumab (clone 1121) to block the interaction between hCTLA-4 and human B7.1 (CD80). Data indicate means for triplicate wells and are from one experiment. Panels A and E were created with BioRender.com.
Figure 1.
A humanized mouse model to study the Fc effector function of human anti–CTLA-4. A, Schematic drawing describing the generation of humanized CTLA-4/FcγR mice. The genotypes of the mouse strains used for the crossing are presented. B and C, Flow cytometric analysis of CTLA-4 in CD45+CD3+ T cells isolated from spleens and tumors from humanized CTLA-4/FcγR mice. B, Representative dot plots illustrating the gating strategy for identification of CD8+ T cells, FOXP3 conventional CD4+ T cells (Tconv) and FOXP3+ CD4+ Tregs in MC38 tumors from humanized CTLA-4/FcγR mice. C, Levels of expression of mouse CTLA-4 (mCTLA-4) and human CTLA-4 (hCTLA-4) in the indicated T-cell subsets in spleens (S) and tumors (T) from WT (left, n = 4) and humanized CTLA-4/FcγR mice (right, n = 6) bearing MC38 tumors. Representative histograms and quantification of the mean fluorescence intensity (MFI) ± SEM are shown. Dotted lines indicate Fluorescence Minus One (FMO) controls. Each symbol represents an individual mouse and are from one experiment. D, Flow cytometric analysis of human FcγRs in CD45+ immune cells isolated from spleens and tumors from humanized CTLA-4/FcγR mice bearing MC38 tumors. Representative histograms from one experiment are shown. Dotted lines indicate FMO controls. E, Schema outlining the composition of the recombinant human anti–CTLA-4 antibodies used in the study. The Fab and Fc regions used for the generation of recombinant ipilimumab (top) and tremelimumab (bottom) antibodies are described. F, Evaluation of the binding of the recombinant ipilimumab (left) and tremelimumab (right) antibodies to hCTLA-4 by surface plasmon resonance. The dissociation constant (KD) of each antibody is shown. RU, response units. Data are from one experiment. G, Competitive ELISA evaluating the capacity of recombinant hIgG2 ipilimumab (clone 10D1) and hIgG2 tremelimumab (clone 1121) to block the interaction between hCTLA-4 and human B7.1 (CD80). Data indicate means for triplicate wells and are from one experiment. Panels A and E were created with BioRender.com.
Figure 2. Human anti–CTLA-4 have limited Treg-depleting and antitumor activities in humanized CTLA-4/FcγR mice. A, Binding profiles of human IgG1 (hIgG1) and human IgG2 (hIgG2) to human FcγRs. The relative binding affinities presented were defined on the basis of affinity constants previously assessed by surface plasmon resonance (34). B, Schema of experimental design indicating the treatment timing and dosage of human anti–CTLA-4 in humanized CTLA-4/FcγR mice. Average growth ± SEM of MC38 tumors in humanized CTLA-4/FcγR mice treated with ipilimumab (C) or tremelimumab (D). Each antibody was evaluated with both a hIgG1 or a hIgG2 Fc backbone and compared with hIgG1 isotype control (n = 5–10 mice/group, two independent experiments). E, Average growth ± SEM of B16 tumors in humanized CTLA-4/FcγR mice treated with ipilimumab. The antibody was evaluated with both a hIgG1 or a hIgG2 Fc backbone and compared with hIgG1 isotype control (n = 5 mice/group, one experiment). In each experiment (C–E), P values were determined at last timepoint of tumor assessment by one-way ANOVA with Tukey multiple comparison test. Flow cytometry analysis of FOXP3+ Tregs and CD8+ T cells in MC38 (F) and B16 (G) tumors from humanized CTLA-4/FcγR mice treated with recombinant hIgG1 or hIgG2 ipilimumab. A hIgG1 isotype control antibody was used for the control group. Data indicate means ± SEM and each symbol represents an individual mouse (n = 8–10 mice/group, two independent experiments). P values were determined by one-way ANOVA with Tukey multiple comparison test. *, P < 0.05; **, P < 0.01; ns, not significant.
Figure 2.
Human anti–CTLA-4 have limited Treg-depleting and antitumor activities in humanized CTLA-4/FcγR mice. A, Binding profiles of human IgG1 (hIgG1) and human IgG2 (hIgG2) to human FcγRs. The relative binding affinities presented were defined on the basis of affinity constants previously assessed by surface plasmon resonance (34). B, Schema of experimental design indicating the treatment timing and dosage of human anti–CTLA-4 in humanized CTLA-4/FcγR mice. Average growth ± SEM of MC38 tumors in humanized CTLA-4/FcγR mice treated with ipilimumab (C) or tremelimumab (D). Each antibody was evaluated with both a hIgG1 or a hIgG2 Fc backbone and compared with hIgG1 isotype control (n = 5–10 mice/group, two independent experiments). E, Average growth ± SEM of B16 tumors in humanized CTLA-4/FcγR mice treated with ipilimumab. The antibody was evaluated with both a hIgG1 or a hIgG2 Fc backbone and compared with hIgG1 isotype control (n = 5 mice/group, one experiment). In each experiment (C–E), P values were determined at last timepoint of tumor assessment by one-way ANOVA with Tukey multiple comparison test. Flow cytometry analysis of FOXP3+ Tregs and CD8+ T cells in MC38 (F) and B16 (G) tumors from humanized CTLA-4/FcγR mice treated with recombinant hIgG1 or hIgG2 ipilimumab. A hIgG1 isotype control antibody was used for the control group. Data indicate means ± SEM and each symbol represents an individual mouse (n = 8–10 mice/group, two independent experiments). P values were determined by one-way ANOVA with Tukey multiple comparison test. *, P < 0.05; **, P < 0.01; ns, not significant.
Figure 3. The inhibitory Fc receptor FcγRIIB is highly expressed in the TME. A–F, Flow cytometric analysis of human FcγRs in tumors and lymphoid organs from humanized CTLA-4/FcγR mice. Percentages of expression of the activating FcγRIIIA and the inhibitory FcγRIIB in CD45+ immune cells from MC38 (A), MCA-205 (B), and B16 (C) tumors. Representative histograms and quantification of the mean percentage ± SEM of cells expressing the indicated FcγR are shown. Each symbol represents an individual mouse and data are from one experiment (n = 5–6 mice/model). P values were determined by Mann–Whitney test. Expression levels of the inhibitory FcγRIIB in CD45+ immune cells isolated from tumor-draining lymph nodes, spleens, and tumors from mice bearing MC38 (D), MCA-205 (E), or B16 (F) tumors. Representative histograms and quantification of the MFI ± SEM of FcγRIIB in CD45+FcγRIIB+ cells are shown. Dotted lines indicate Fluorescence Minus One (FMO) control. Each symbol represents an individual mouse and data are from one experiment (n = 5–6 mice/model). P values were determined by Kruskal–Wallis test with Dunn multiple comparison test. G–I, mIF analysis of human FcγRs in human tumors. G, Schematic drawing indicating the cohort of patients and experimental procedure. Resected tumors from patients (n = 14) with HNSCC were analyzed by mIF for CD3, CD68, FcγRIIB, FcγRIIIA, and DAPI (top). Representative image (of 14 samples) showing myeloid cells (CD68, green) expressing FcγRIIB (yellow) and/or FcγRIIIA (red) in a tumor resected from a patient (bottom). Inset shows a higher magnification image of the boxed area with all individual stainings. H, Representative segmentation mask obtained from the original image shown in G and the distinct cell phenotypes analyzed in the study. I, Quantification of the percentage of cells expressing the indicated FcγR in CD68+ myeloid cells (left). Each symbol represents a patient and data indicate means ± SEM. The ratio of FcγRIIIA+ to FcγRIIB+ cells among CD68+ myeloid cells is indicated (right). P value was determined by Mann–Whitney test. *, P < 0.05; **, P < 0.01; ns, not significant. Panel G was created with BioRender.com.
Figure 3.
The inhibitory Fc receptor FcγRIIB is highly expressed in the TME. A–F, Flow cytometric analysis of human FcγRs in tumors and lymphoid organs from humanized CTLA-4/FcγR mice. Percentages of expression of the activating FcγRIIIA and the inhibitory FcγRIIB in CD45+ immune cells from MC38 (A), MCA-205 (B), and B16 (C) tumors. Representative histograms and quantification of the mean percentage ± SEM of cells expressing the indicated FcγR are shown. Each symbol represents an individual mouse and data are from one experiment (n = 5–6 mice/model). P values were determined by Mann–Whitney test. Expression levels of the inhibitory FcγRIIB in CD45+ immune cells isolated from tumor-draining lymph nodes, spleens, and tumors from mice bearing MC38 (D), MCA-205 (E), or B16 (F) tumors. Representative histograms and quantification of the MFI ± SEM of FcγRIIB in CD45+FcγRIIB+ cells are shown. Dotted lines indicate Fluorescence Minus One (FMO) control. Each symbol represents an individual mouse and data are from one experiment (n = 5–6 mice/model). P values were determined by Kruskal–Wallis test with Dunn multiple comparison test. G–I, mIF analysis of human FcγRs in human tumors. G, Schematic drawing indicating the cohort of patients and experimental procedure. Resected tumors from patients (n = 14) with HNSCC were analyzed by mIF for CD3, CD68, FcγRIIB, FcγRIIIA, and DAPI (top). Representative image (of 14 samples) showing myeloid cells (CD68, green) expressing FcγRIIB (yellow) and/or FcγRIIIA (red) in a tumor resected from a patient (bottom). Inset shows a higher magnification image of the boxed area with all individual stainings. H, Representative segmentation mask obtained from the original image shown in G and the distinct cell phenotypes analyzed in the study. I, Quantification of the percentage of cells expressing the indicated FcγR in CD68+ myeloid cells (left). Each symbol represents a patient and data indicate means ± SEM. The ratio of FcγRIIIA+ to FcγRIIB+ cells among CD68+ myeloid cells is indicated (right). P value was determined by Mann–Whitney test. *, P < 0.05; **, P < 0.01; ns, not significant. Panel G was created with BioRender.com.
Figure 4. Limiting the binding of human anti–CTLA-4 to FcγRIIB improves Treg depletion and tumor control. A, Schema of experimental design indicating the treatment timing and dosage of human IgG1 (hIgG1) ipilimumab alone or in combination with a human FcγRIIB–blocking antibody (clone 2B6), as well as various Fc-engineered hIgG1 anti–CTLA-4 (ipilimumab or tremelimumab). B, Binding profiles of distinct hIgG1 Fc variants to human FcγRs. The relative binding affinities presented were defined based on affinity constants previously assessed by surface plasmon resonance (29, 30). C, Flow cytometry analysis of FOXP3+ Tregs in MC38 tumors from humanized CTLA-4/FcγR mice treated with indicated treatments (color legend in D). A hIgG1 isotype control antibody was used for the control group. Data indicate means ± SEM and each symbol represents an individual mouse (n = 5–14 mice/group, three independent experiments). P values were determined by one-way ANOVA with Tukey multiple comparison test. D, Average growth ± SEM of MC38 tumors in humanized CTLA-4/FcγR mice treated with indicated treatments (n = 5–20 mice/group, four independent experiments). A hIgG1 isotype control antibody was used for the control group. P values were determined at last timepoint of tumor assessment by one-way ANOVA with Tukey multiple comparison test. Average growth ± SEM of MB49 (E), B16 (F), and MC38 (G) tumors in humanized CTLA-4/FcγR mice treated with Fc-engineered hIgG1 GAALIE ipilimumab (E and F) or Fc-engineered hIgG1 GAALIE tremelimumab (G; n = 4–6 mice/group, one experiment). A hIgG1 isotype control antibody (E and F) or Fc null hIgG1 (N297A) tremelimumab (G) were used for the control groups. P values were determined at last timepoint of tumor assessment by Mann–Whitney test. *, P < 0.05; **, P < 0.01; ***, P < 0.001; ****, P < 0.0001; ns, not significant.
Figure 4.
Limiting the binding of human anti–CTLA-4 to FcγRIIB improves Treg depletion and tumor control. A, Schema of experimental design indicating the treatment timing and dosage of human IgG1 (hIgG1) ipilimumab alone or in combination with a human FcγRIIB–blocking antibody (clone 2B6), as well as various Fc-engineered hIgG1 anti–CTLA-4 (ipilimumab or tremelimumab). B, Binding profiles of distinct hIgG1 Fc variants to human FcγRs. The relative binding affinities presented were defined based on affinity constants previously assessed by surface plasmon resonance (29, 30). C, Flow cytometry analysis of FOXP3+ Tregs in MC38 tumors from humanized CTLA-4/FcγR mice treated with indicated treatments (color legend in D). A hIgG1 isotype control antibody was used for the control group. Data indicate means ± SEM and each symbol represents an individual mouse (n = 5–14 mice/group, three independent experiments). P values were determined by one-way ANOVA with Tukey multiple comparison test. D, Average growth ± SEM of MC38 tumors in humanized CTLA-4/FcγR mice treated with indicated treatments (n = 5–20 mice/group, four independent experiments). A hIgG1 isotype control antibody was used for the control group. P values were determined at last timepoint of tumor assessment by one-way ANOVA with Tukey multiple comparison test. Average growth ± SEM of MB49 (E), B16 (F), and MC38 (G) tumors in humanized CTLA-4/FcγR mice treated with Fc-engineered hIgG1 GAALIE ipilimumab (E and F) or Fc-engineered hIgG1 GAALIE tremelimumab (G; n = 4–6 mice/group, one experiment). A hIgG1 isotype control antibody (E and F) or Fc null hIgG1 (N297A) tremelimumab (G) were used for the control groups. P values were determined at last timepoint of tumor assessment by Mann–Whitney test. *, P < 0.05; **, P < 0.01; ***, P < 0.001; ****, P < 0.0001; ns, not significant.
Figure 5. Targeting tumor-infiltrating Tregs with Fc-engineered anti-CCR8 induces potent antitumor activity. A, Schema of experimental design indicating the treatment timing and dosage of a human IgG1 (hIgG1) anti-murine CCR8 (clone SA214G2), as well as various Fc-engineered hIgG1 versions of this same antibody. B, Average growth ± SEM of MC38 tumors in humanized FcγR mice treated with indicated treatments (n = 4–17 mice/group, three independent experiments). A hIgG1 isotype control antibody was used for the control group. P values were determined at last time point of tumor assessment by one-way ANOVA with Tukey multiple comparison test. C and D, Flow cytometry analysis of FOXP3+ Tregs in MC38 tumors from humanized FcγR mice treated with indicated treatments (color legend in B). Fc null hIgG1 (GRLR) anti-murine CCR8 were used for the control groups. Data indicate means ± SEM and each symbol represents an individual mouse (n = 7–13 mice/group, two independent experiments). P values were determined by one-way ANOVA with Tukey multiple comparison test. Average growth ± SEM of MB49 (E) and B16 (F) tumors in humanized FcγR mice treated with indicated treatments (n = 4–11 mice/group, one experiment in E and two independent experiments in F). Fc null hIgG1 (GRLR) anti-murine CCR8 (E) or a human IgG1 isotype control antibody (F) were used for the control groups. P values were determined at last timepoint of tumor assessment by one-way ANOVA with Tukey multiple comparison test. *, P < 0.05; **, P < 0.01; ****, P < 0.0001; ns, not significant.
Figure 5.
Targeting tumor-infiltrating Tregs with Fc-engineered anti-CCR8 induces potent antitumor activity. A, Schema of experimental design indicating the treatment timing and dosage of a human IgG1 (hIgG1) anti-murine CCR8 (clone SA214G2), as well as various Fc-engineered hIgG1 versions of this same antibody. B, Average growth ± SEM of MC38 tumors in humanized FcγR mice treated with indicated treatments (n = 4–17 mice/group, three independent experiments). A hIgG1 isotype control antibody was used for the control group. P values were determined at last time point of tumor assessment by one-way ANOVA with Tukey multiple comparison test. C and D, Flow cytometry analysis of FOXP3+ Tregs in MC38 tumors from humanized FcγR mice treated with indicated treatments (color legend in B). Fc null hIgG1 (GRLR) anti-murine CCR8 were used for the control groups. Data indicate means ± SEM and each symbol represents an individual mouse (n = 7–13 mice/group, two independent experiments). P values were determined by one-way ANOVA with Tukey multiple comparison test. Average growth ± SEM of MB49 (E) and B16 (F) tumors in humanized FcγR mice treated with indicated treatments (n = 4–11 mice/group, one experiment in E and two independent experiments in F). Fc null hIgG1 (GRLR) anti-murine CCR8 (E) or a human IgG1 isotype control antibody (F) were used for the control groups. P values were determined at last timepoint of tumor assessment by one-way ANOVA with Tukey multiple comparison test. *, P < 0.05; **, P < 0.01; ****, P < 0.0001; ns, not significant.

Update of

Similar articles

Cited by

References

    1. Morad G, Helmink BA, Sharma P, Wargo JA. Hallmarks of response, resistance, and toxicity to immune checkpoint blockade. Cell 2021;184:5309–37. - PMC - PubMed
    1. Sharma P, Allison JP. Dissecting the mechanisms of immune checkpoint therapy. Nat Rev Immunol 2020;20:75–6. - PubMed
    1. Wei SC, Duffy CR, Allison JP. Fundamental mechanisms of immune checkpoint blockade therapy. Cancer Discov 2018;8:1069–86. - PubMed
    1. Peggs KS, Quezada SA, Chambers CA, Korman AJ, Allison JP. Blockade of CTLA-4 on both effector and regulatory T cell compartments contributes to the antitumor activity of anti-CTLA-4 antibodies. J Exp Med 2009;206:1717–25. - PMC - PubMed
    1. Simpson TR, Li F, Montalvo-Ortiz W, Sepulveda MA, Bergerhoff K, Arce F, et al. . Fc-dependent depletion of tumor-infiltrating regulatory T cells co-defines the efficacy of anti-CTLA-4 therapy against melanoma. J Exp Med 2013;210:1695–710. - PMC - PubMed

Publication types