. 2024 Mar 9;36(4):183-196.
doi: 10.1093/intimm/dxad054.

Aberrant monocytopoiesis drives granuloma development in sarcoidosis

Affiliations

Aberrant monocytopoiesis drives granuloma development in sarcoidosis

Ryosuke Hiranuma et al. Int Immunol. .

Abstract

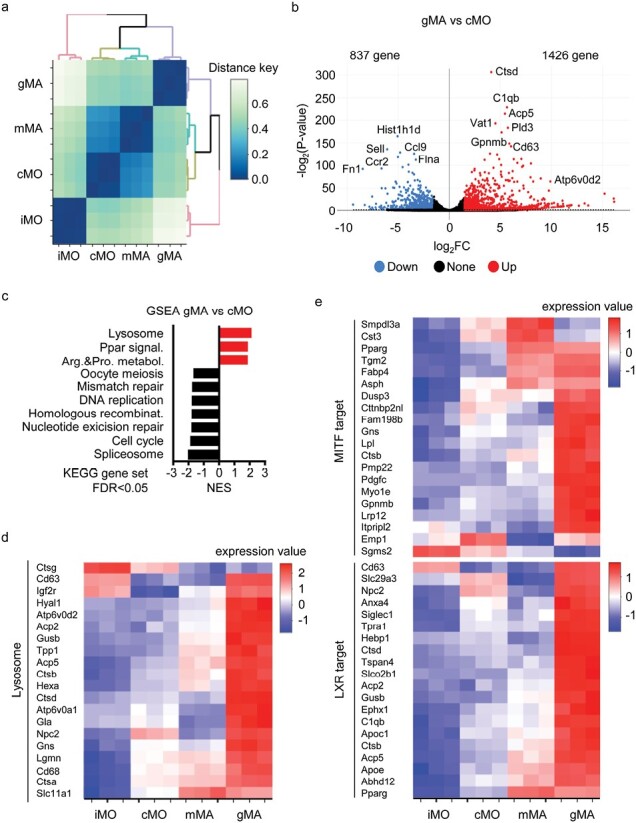
In sarcoidosis, granulomas develop in multiple organs including the liver and lungs. Although mechanistic target of rapamycin complex 1 (mTORC1) activation in macrophages drives granuloma development in sarcoidosis by enhancing macrophage proliferation, little is known about the macrophage subsets that proliferate and mature into granuloma macrophages. Here, we show that aberrantly increased monocytopoiesis gives rise to granulomas in a sarcoidosis model, in which Tsc2, a negative regulator of mTORC1, is conditionally deleted in CSF1R-expressing macrophages (Tsc2csf1rΔ mice). In Tsc2csf1rΔ mice, common myeloid progenitors (CMPs), granulocyte-monocyte progenitors (GMPs), common monocyte progenitors / monocyte progenitors (cMoPs / MPs), inducible monocyte progenitors (iMoPs), and Ly6Cint CX3CR1low CD14- immature monocytes (iMOs), but not monocyte-dendritic cell progenitors (MDPs) and common dendritic cell progenitors (CDPs), accumulated and proliferated in the spleen. Consistent with this, monocytes, neutrophils, and neutrophil-like monocytes increased in the spleens of Tsc2csf1rΔ mice, whereas dendritic cells did not. The adoptive transfer of splenic iMOs into wild-type mice gave rise to granulomas in the liver and lungs. In these target organs, iMOs matured into Ly6Chi classical monocytes/macrophages (cMOs). Giant macrophages (gMAs) also accumulated in the liver and lungs, which were similar to granuloma macrophages in expression of cell surface markers such as MerTK and SLAMF7. Furthermore, the gMA-specific genes were expressed in human macrophages from sarcoidosis skin lesions. These results suggest that mTORC1 drives granuloma development by promoting the proliferation of monocyte/neutrophil progenitors and iMOs predominantly in the spleen, and that proliferating iMOs mature into cMOs and then gMAs to give rise to granuloma after migration into the liver and lungs in sarcoidosis.

Keywords: mTORC1; macrophage.


Figures

Graphical Abstract
Graphical Abstract
Figure 1.
Figure 1.
BM cells give rise to granulomas in Tsc2Csf1rΔ mice. (a, b) H&E staining and F4/80 immunostaining of lung (a) and liver (b) sections of Tsc2fl/fl and Tsc2Csf1rΔ mice at the age of 2 months. (c–g) Percentages of CD11b+ Ly6G NK1.1 Siglec-F monocytes/macrophages, F4/80+ SiglecF+ alveolar macrophages, and F4/80+ Tim4+ Kupffer cells in CD45+ hematopoietic cells in the lung, liver, spleen, peripheral blood, and BM of the indicated mice (n = 5–8). (h) Immunostaining for F4/80 in the lung and liver sections of the indicated BM chimeric mice. (i) Percentages of CD11b+ macrophages in CD45.2+ hematopoietic cells in the spleen of the indicated BM chimeric mice (n = 4–5). ***P < .001. Scale bars, 200 µm.
Figure 2.
Figure 2.
Ly6Cint CX3CR1low iMOs give rise to granuloma. (a) Dot plots showing the expression of Ly6C, FcγRIV, and CX3CR1 in CD11b+ Ly6G NK1.1 monocytes/macrophages in the BM of the indicated mice. (b–e) Percentages of iMOs, cMOs, and mMAs in CD45+ hematopoietic cells in the BM, spleen, lung, and liver of the indicated mice (n = 6–9). (f) Dot plots showing EdU uptake and DNA content in the splenic monocyte subsets. (g) Dots show the percentage of monocytes in the S-phase in the indicated organs (n = 3–6). (h) Immunostaining of F4/80 in lung and liver sections from mice that received splenic iMOs from Tsc2Csf1rΔ mice with wild-type BM cells. Scale bars, 200 µm. (i) The volcano plot shows the genes expressed in splenic iMOs from Tsc2csf1rΔ mice 21.5 fold higher and lower than those in BM iMOs from wild-type mice. (j) GSEA of the comparison between splenic iMOs from Tsc2Csf1rΔ mice and BM iMOs from wild-type mice. *P < .05, **P < .01, ***P < .001.
Figure 3.
Figure 3.
iMOs mature into cMOs after migration into the lung and liver. (a) Dot plots showing the expression of CX3CR1 and Ly6C in CD11b+ monocytes/macrophages in the indicated organs from the indicated mice. (b) Dot plots showing the expression of CX3CR1 and EdU uptake by splenic cMOs in the indicated mice. Percentages of EdU+ CX3CR1hi and EdU+ CX3CR1int cells in the BM and spleen are also shown (n = 4). (c) Dot plots showing the expression of CD14 and Ly6C on CD11b+ monocytes/macrophages in the indicated organs from the indicated mice. Percentages of CD14 iMOs are also shown (n = 8). (d) Dot plots showing the expression of CD117, CD115, Ly6C, and CD135 in lineage-negative cells in the spleen of the indicated mice. (e) Dot plots show the expression of CD117, CD115, CD34, and CD16/32 in lineage-negative, Sca-1, and Ly6C cells in the spleen of the indicated mice. (f) Total numbers of indicated monocyte progenitors and monocytes in the spleen of the indicated mice (n = 4). (g) Percentages of EdU+ monocyte progenitors/monocytes in the spleen from the indicated mice (n = 4). (h) Percentages of neutrophil-like monocytes, neutrophils, cDCs, and pDCs in the spleen of the indicated mice (n = 4). *P < .05, **P < .01, ***P < .001.
Figure 4.
Figure 4.
gMAs accumulated in the lung and liver are distinct from mMAs. (a) Dot plots show the forward and side scatter of lung macrophages from the indicated mice. Forward and side scatter of iMOs, cMOs, and mMAs with gates for giant macrophages (gMAs). The percentage of gMAs in CD45-positive hematopoietic cells is also shown (n = 7). (b) Each histograms show expression of cell surface markers in lung mMAs and gMAs from the indicated mice. The staining with isotype control antibody is also presented. (c, d) Immunostaining of the lung and liver sections from the indicated mice to detect MerTK and Slamf7. (e) Dot plots showing forward scatter and Slamf7 expression in F4/80+ macrophages from the indicated organs of the indicated mice. The gates for gMAs and percentages of gMAs in F4/80+ macrophages from the indicated organs are also shown (n = 5–8). *P < .05, **P < .01 and ***P < .001. Scale bars, 200 µm.
Figure 5.
Figure 5.
gMAs express target genes of MITF and LXRα. (a) Dendrogram showing hierarchical clustering of splenic iMOs, splenic cMOs, hepatic mMAs, and hepatic gMAs represented as distance key obtained from (1—correlation coefficient) based on transcriptome analyses. (b) Volcano plot showing the genes upregulated and downregulated by 21.5 fold in comparison of hepatic gMAs to splenic cMOs. (c) GSEA of differentially expressed genes (DEGs) in hepatic gMAs compared with splenic cMOs. KEGG gene sets, which were positively and negatively enriched in hepatic gMAs with FDR lower than 0.05, are shown. (d, e) Heat maps showing the mRNA expression of the indicated genes in the indicated monocyte/macrophage subsets.
Figure 6.
Figure 6.
Sarcoidosis macrophages express gMA-specific genes. (a) Heat map showing the expression of the gMA-specific 432 genes in iMOs, cMOs, mMAs, and gMAs. (b) UMAP plots showing DC and macrophage clusters from three sarcoidosis patients and five healthy subjects. LC, Langerhans cells, cDC1 conventional type 1 dendritic cells; cDC2, conventional type 2 dendritic cells; mregDC, mature dendritic cells enriched in immunoregulatory molecules; NS_MAC, normal skin resident macrophages; SS_MAC, sarcoidosis skin resident macrophages. (c) UMAP plot showing the average expression levels of gMA-specific genes in DCs and macrophages. (d–g) Violin plots show the mean (d) and individual (e–g) expression of indicated genes in myeloid cell subsets.

Similar articles

Cited by

References

    1. Pagán AJ, Ramakrishnan L.. The formation and function of granulomas. Annu Rev Immunol 2018;36:639–65. 10.1146/annurev-immunol-032712-100022 - DOI - PubMed
    1. Grunewald J, Grutters JC, Arkema EV, et al. . Sarcoidosis. Nat Rev Dis Primers 2019;5:45. 10.1038/s41572-019-0096-x - DOI - PubMed
    1. Herrtwich L, Nanda I, Evangelou K, et al. . DNA damage signaling instructs polyploid macrophage fate in granulomas. Cell 2016;167:1264. - PubMed
    1. Lösslein AK, Lohrmann F, Scheuermann L, et al. . Monocyte progenitors give rise to multinucleated giant cells. Nat Commun 2021;12:2027. 10.1038/s41467-021-22103-5 - DOI - PMC - PubMed
    1. Teh YC, Chooi MY, Liu D, et al. . Transitional premonocytes emerge in the periphery for host defense against bacterial infections. Sci Adv 2022;8:eabj4641. 10.1126/sciadv.abj4641 - DOI - PMC - PubMed

Publication types

Substances