. 2024 Jan 2;121(1):e2310685120.
doi: 10.1073/pnas.2310685120. Epub 2023 Dec 26.

ANGPTL4 binds to the leptin receptor to regulate ectopic bone formation

Affiliations

ANGPTL4 binds to the leptin receptor to regulate ectopic bone formation

Hongling Hu et al. Proc Natl Acad Sci U S A. .

Abstract

Leptin protein was thought to be unique to leptin receptor (LepR), but the phenotypes of mice with mutation in LepR [db/db (diabetes)] and leptin [ob/ob (obese)] are not identical, and the cause remains unclear. Here, we show that db/db, but not ob/ob, mice had defect in tenotomy-induced heterotopic ossification (HO), implicating alternative ligand(s) for LepR might be involved. Ligand screening revealed that ANGPTL4 (angiopoietin-like protein 4), a stress and fasting-induced factor, was elicited from brown adipose tissue after tenotomy, bound to LepR on PRRX1+ mesenchymal cells at the HO site, thus promotes chondrogenesis and HO development. Disruption of LepR in PRRX1+ cells, or lineage ablation of LepR+ cells, or deletion of ANGPTL4 impeded chondrogenesis and HO in mice. Together, these findings identify ANGPTL4 as a ligand for LepR to regulate the formation of acquired HO.

Keywords: ANGPTL4; heterotopic ossification; leptin receptor.


Conflict of interest statement

Competing interests statement:The authors declare no competing interest.

Figures
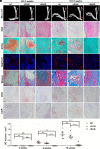
Fig. 1.
Fig. 1.
db/db but not ob/ob mice exhibit defect in the formation of acquired HO. (A) Representative Micro-CT three-dimensional (3D) modeling images of Achilles tendon (sagittal view) of mice in indicated group 3 wk (early chondrogenesis stage, Left) or 8 wk (early osteogenesis stage, Right) after tenotomy. Red ovals indicate ectopic bones. (BG) Representative images for (B) H&E staining, (C) SOFG staining [proteoglycan (red), heterotopic bone and Achilles tendon (green)], (D) IF staining for Aggrecan (red) and DAPI (blue), (E) Masson staining, (F) IHC staining for OCN, and (G) IHC staining for LepR of Achilles tendon of mice in indicated group 3 wk or 8 wk after tenotomy. (Scale bars, 100 μm.) (H) Quantification of Fig. 1A and SI Appendix, Fig. S2 showing HO volumes of mice in indicated group (n = 6 to 8 mice per group). Data are represented as mean ± SEM. ns, no significance; *P < 0.05, **P < 0.01, ***P < 0.001. See also SI Appendix, Figs. S1 and S2.
Fig. 2.
Fig. 2.
LepR+ cells contribute to the formation of acquired HO. (A) Schematic of experimental strategy. (B) Representative Micro-CT 3D modeling images of Achilles tendon (sagittal view) of mice in indicated group 8 wk after tenotomy. Red ovals indicate ectopic bones. (C) Quantification of B showing HO volumes of mice in indicated group (n = 9 to 12 mice per strain). Data are represented as mean ± SEM. ***P < 0.001. (D and E) Representative images for H&E staining, SOFG staining [proteoglycan (red), heterotopic bone and Achilles tendon (green)], and IF staining for DAPI (blue; LepR+ cells express membrane-bound GFP instead of tomato fluorescent protein) of Achilles tendon of mice in indicated group (D) 3 wk or (E) 8 wk after tenotomy. (Scale bars, 100 μm.)
Fig. 3.
Fig. 3.
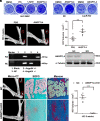
LepR on PRRX1+ mesenchymal cells is required for the formation of acquired HO. (A) Representative genotyping results of Prrx1-Cre;LepRfl/fl or control littermates. Primers used in this experiment are listed in Key Resources Table. (B) Western blotting analysis of LepR expression in primary BMSCs isolated from Prrx1-Cre;LepRfl/fl or control littermates. α-Tubulin was used as loading control. (C) Representative images for IF staining for LepR (red) and DAPI (blue) in primary BMSCs isolated from Prrx1-Cre;LepRfl/fl or control littermates. (Scale bar, 20 µm.) (D) Representative Micro-CT 3D modeling images of Achilles tendon (sagittal view) of mice in indicated group 3 wk, 8 wk, or 16 wk (late osteogenesis stage, Right) after tenotomy. Red ovals indicate ectopic bones. (E) Quantification of D showing HO volumes of mice in indicated group (n = 9 to 12 mice per group). Data are represented as mean ± SEM. ***P < 0.001. (FJ) Representative images for (F) H&E staining, (G) SOFG staining [proteoglycan (red), heterotopic bone and Achilles tendon (green)], (H) IF staining for Aggrecan (red) and DAPI (blue), (I) Masson staining, and (J) IHC staining for LepR of Achilles tendon of mice in indicated group 3 wk, 8 wk, or 16 wk after tenotomy. (Scale bars, 100 μm.) SI Appendix, Fig. S3.
Fig. 4.
Fig. 4.
ANGPTL4 binds to LepR at higher affinity than leptin. (A) Heatmap of the most highly differentially expressed LepR-interacting proteins from “HO 4 wk” or control mice serum. (B) Binding response curves of LepR–Leptin and LepR–ANGPTL4. (C) Binding affinity described in B. (D and E) SPRi assay involving (D) LepR and leptin or (E) LepR and ANGPTL4. (FI) The predicted 3D structure of (F) LepR, (G) ANGPTL4, (H) binding model for ANGPTL4 (purple) with LepR (blue), and (I) detailed interaction model for ANGPTL4 (purple) with LepR (blue), the residues in ANGPTL4 are shown as violet sticks, the residues in LepR are shown as cyan sticks, the red dashes represent hydrogen bond interaction, the blue dashes represent salt bridge. (J) Schematic diagram of LepR and ANGPTL4 constructs: FLAG-tagged LepR amino acids (aa) 22 to 892 (FLAG-LepR), FLAG-tagged LepR N-terminal aa 22 to 496 (FLAG-LepR-N), FLAG-tagged LepR C-terminal aa 497 to 839 (FLAG-LepR-C) and GST-tagged full-length ANGPTL4 aa 1 to 410 (GST- ANGPTL4). (K) Representative results for co-IP assays of exogenous FLAG-tagged LepR with GST-tagged ANGPTL4 or GST-tagged Leptin in HEK293 cells. (L) Representative results for co-IP assays of exogenous FLAG-tagged LepR-N (Upper) or FLAG-tagged LepR-C (Lower) with GST-tagged ANGPTL4 in HEK293 cells. (M) Representative Micro-CT 3D modeling images of Achilles tendon (sagittal view) of mice in indicated group 8 wk after tenotomy. Red ovals indicate ectopic bones. (N) Quantification of L showing HO volumes of mice in indicated group (n = 6 mice per strain). Data are represented as mean ± SEM. ***P < 0.001. (O) Representative IF staining images revealing co-localization of LepR (red) and ANGPTL4 (green) at HO site. (Scale bar, 100 μm.)
Fig. 5.
Fig. 5.
iBAT produces and secretes ANGPTL4 after tenotomy. (A) Representative IF staining images of ANGPTL4 (red) at normal tendon, muscle, and tenotomy 3 wk HO site. T, tendon; M, muscle; HO, heterotopic ossification. (Scale bar, 100 μm.) (B) Representative images for Micro-CT 3D modeling of Achilles tendon (sagittal view) of mice in indicated group 8 wk after tenotomy. Red ovals indicate ectopic bones. (C) Angptl4 mRNA expression level in indicated tissue normalized to β-actin. The fold change was normalized to the expression in iBAT in the NC group. n = 4 mice per group. Data are represented as mean ± SEM. WAT, white adipose tissue; iBAT, interscapular brown adipose tissue; M+T, Muscle and Tendon. **P < 0.01, ***P < 0.001. (D) Enzyme-linked immunosorbent assay analysis of serum ANGPTL4 level in mice from indicated group. n = 6 per group. Data are represented as mean ± SEM. ns, no significance; *P < 0.05, ***P < 0.001. (E) Representative images for SOFG staining [proteoglycan (red), heterotopic bone and Achilles tendon (green)] of Achilles tendon of mice in indicated strain 3 wk after tenotomy. (Scale bars, 100 μm.) (F) Representative images for Micro-CT 3D modeling of Achilles tendon of mice in indicated strain 8 wk after tenotomy. (G) Quantification of F showing HO volumes of mice in indicated strain (n = 6 mice per strain). Data are represented as mean ± SEM. **P < 0.01. See also SI Appendix, Fig. S4.
Fig. 6.
Fig. 6.
ANGPTL4 promotes chondrogenesis of mesenchymal cells and HO development via LepR. (A) Representative toluidine blue staining results of hUC-MSCs in indicated conditions (1% Dimethyl sulfoxide (DMSO), ITS, 10 ng/mL leptin, or 10 ng/mL ANGPTL4 treatment for 7 d) to evaluate chondrogenesis differentiation. (B) Representative Micro-CT 3D modeling images of Achilles tendon (sagittal view) of mice in indicated group 8 wk after tenotomy. Red ovals indicate ectopic bones. (C) Quantification of B showing HO volumes of mice in indicated group (n = 6 mice per group). Data are represented as mean ± SEM. **P < 0.01. (D) Representative toluidine blue staining results of primary BMSCs, which were isolated from control (termed NC) or LepR-KO mice, in indicated condition (1% DMSO or 10 ng/mL ANGPTL4) for 7 d. (E) Representative genotyping results of ANGPTL4-KO mice and control littermates (termed NC). Primers used in this experiment are listed in Key Resources Table. (F) Western blotting analysis of ANGPTL4 expression in BAT collected from ANGPTL4-KO (termed KO) or control littermates (Termed NC). α-Tubulin was used as loading control. (G) Representative images for Micro-CT 3D modeling (Left), SOFG staining [Middle; proteoglycan (red), heterotopic bone and Achilles tendon (green)], and Masson staining (Right) of Achilles tendon of mice in indicated strain 8 wk after tenotomy. (Scale bars, 100 μm.) (H) Quantification of (G, Left) showing HO volumes of mice in indicated strain (n = 6 mice per strain). Data are represented as mean ± SEM. *** P < 0.001. See also SI Appendix, Fig. S5.
Fig. 7.
Fig. 7.
ANGPTL4–LepR activates STAT3 to promote chondrogenesis in MSCs. (A) Molecular function pathway enrichment analysis of hUC-MSCs treated with ANGPTL4 (10 ng/mL for 30 min) or PBS. (B) Scatter plot and statistics of differentially phosphorylated proteins in hUC-MSCs. (C) Western blotting analysis of STAT3 phosphorylation/total protein, AKT phosphorylation/total protein, and ERK1/2 phosphorylation/total protein in hUC-MSCs stimulated with indicated conditions for 30 min. α-Tubulin was used as loading control. (D) Western blotting analysis of STAT3 phosphorylation/total protein in primary BMSCs isolated from db/db or control (termed NC) mice and stimulated with indicated conditions for 30 min. α-Tubulin was used as loading control. (E) Representative toluidine blue staining results of hUC-MSCs in indicated conditions (1% DMSO, ITS, 10 ng/mL ANGPTL4, or 10 ng/mL ANGPTL4 plus 2.5 μM STAT3 inhibitor Stattic treatment for 7 d) to evaluate chondrogenesis differentiation. (F) Western blotting analysis of COL2A1 and SOX9 in hUC-MSCs stimulated with 1% DMSO, ITS, 10 ng/mL ANGPTL4, or 10 ng/mL ANGPTL4 plus 2.5 μM STAT3 inhibitor Stattic for 7 d. α-Tubulin was used as loading control.

References

    1. Zhang Y., et al. , Positional cloning of the mouse obese gene and its human homologue. Nature 372, 425–432 (1994). - PubMed
    1. Friedman J. M., Halaas J. L., Leptin and the regulation of body weight in mammals. Nature 395, 763–770 (1998). - PubMed
    1. Lee G. H., et al. , Abnormal splicing of the leptin receptor in diabetic mice. Nature 379, 632–635 (1996). - PubMed
    1. Perry R. J., et al. , Leptin mediates a glucose-fatty acid cycle to maintain glucose homeostasis in starvation. Cell 172, 234–248.e17 (2018). - PMC - PubMed
    1. Fischer A. W., Cannon B., Nedergaard J., Leptin: Is it thermogenic? Endocrine Rev. 41, 232–260 (2020). - PMC - PubMed

LinkOut - more resources