. 2024 Feb 13;8(3):766-779.
doi: 10.1182/bloodadvances.2022008926.

Collaborative effect of Csnk1a1 haploinsufficiency and mutant p53 in Myc induction can promote leukemic transformation

Affiliations

Collaborative effect of Csnk1a1 haploinsufficiency and mutant p53 in Myc induction can promote leukemic transformation

Stijn N R Fuchs et al. Blood Adv. .

Abstract

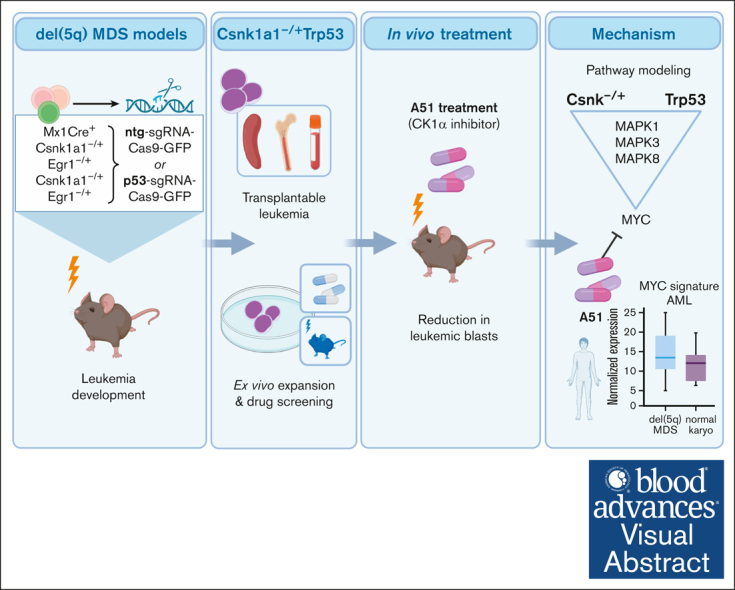
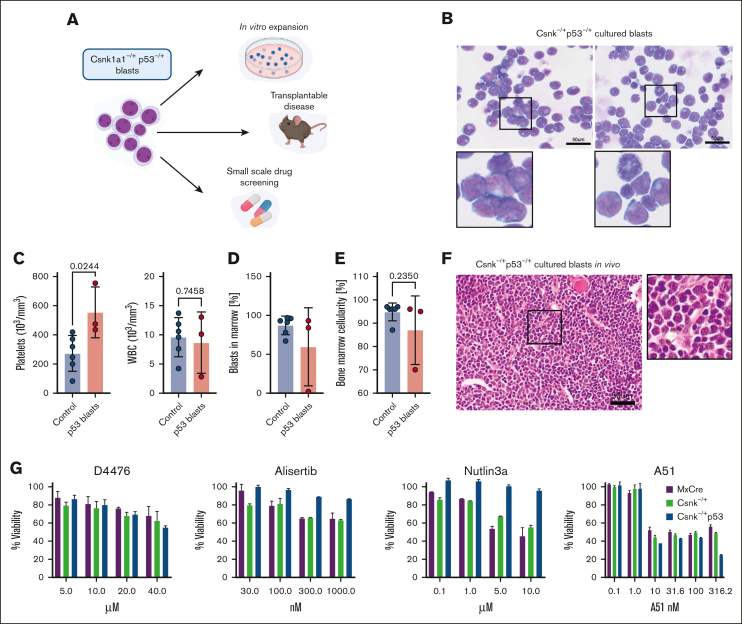
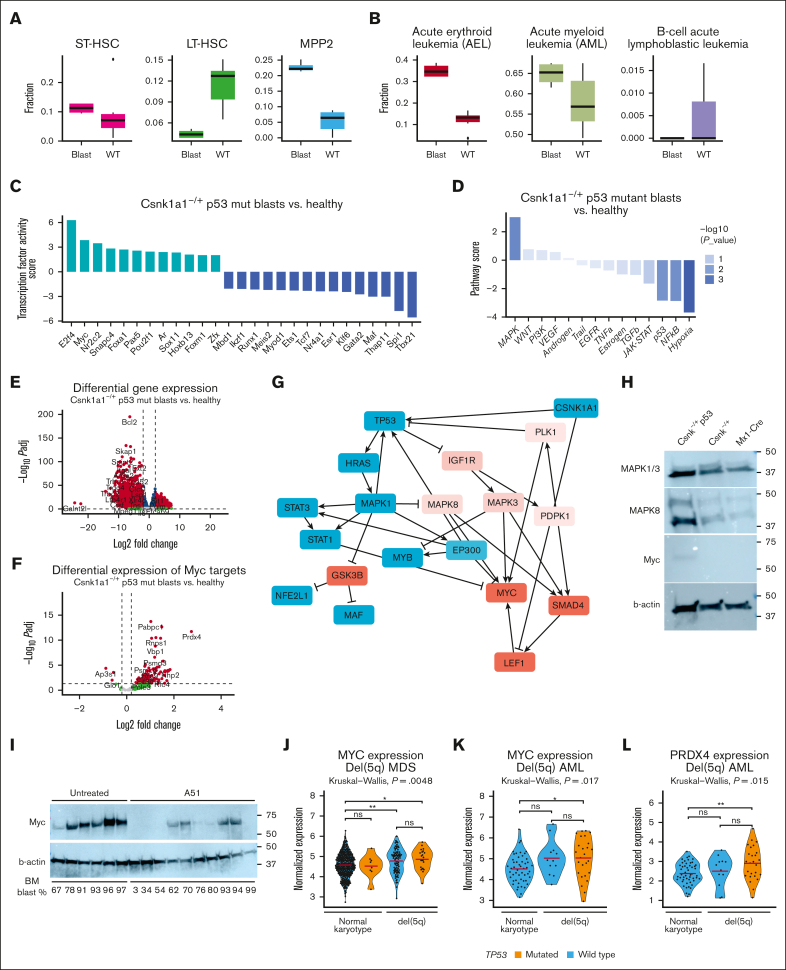
It is still not fully understood how genetic haploinsufficiency in del(5q) myelodysplastic syndrome (MDS) contributes to malignant transformation of hematopoietic stem cells. We asked how compound haploinsufficiency for Csnk1a1 and Egr1 in the common deleted region on chromosome 5 affects hematopoietic stem cells. Additionally, Trp53 was disrupted as the most frequently comutated gene in del(5q) MDS using CRISPR/Cas9 editing in hematopoietic progenitors of wild-type (WT), Csnk1a1-/+, Egr1-/+, Csnk1a1/Egr1-/+ mice. A transplantable acute leukemia only developed in the Csnk1a1-/+Trp53-edited recipient. Isolated blasts were indefinitely cultured ex vivo and gave rise to leukemia after transplantation, providing a tool to study disease mechanisms or perform drug screenings. In a small-scale drug screening, the collaborative effect of Csnk1a1 haploinsufficiency and Trp53 sensitized blasts to the CSNK1 inhibitor A51 relative to WT or Csnk1a1 haploinsufficient cells. In vivo, A51 treatment significantly reduced blast counts in Csnk1a1 haploinsufficient/Trp53 acute leukemias and restored hematopoiesis in the bone marrow. Transcriptomics on blasts and their normal counterparts showed that the derived leukemia was driven by MAPK and Myc upregulation downstream of Csnk1a1 haploinsufficiency cooperating with a downregulated p53 axis. A collaborative effect of Csnk1a1 haploinsufficiency and p53 loss on MAPK and Myc upregulation was confirmed on the protein level. Downregulation of Myc protein expression correlated with efficient elimination of blasts in A51 treatment. The "Myc signature" closely resembled the transcriptional profile of patients with del(5q) MDS with TP53 mutation.


Conflict of interest statement

Conflict-of-interest disclosure: Y.B.-N. is a consultant for Edgewood Oncology, a company advancing A51 clinical development for AML/high-risk MDS. The remaining authors declare no competing financial interests.

Figures

None
Graphical abstract
Figure 1.
Figure 1.
Stem cell phenotype of Csnk1a1fl/+, Egr1–/+ and Csnk1a1fl/+Egr1–/+ mice. (A) White blood cell counts recorded at 4, 7, 11, 16, and 20 weeks after transplant. (B) Frequency of CD11b+ myeloid cells of viable blood cells at 20 weeks after transplant (euthanize). (C) Frequency of CD45.2+ cells in bone marrow LK (Lin and ckit+) and LSK (Lin Sca1+ ckit+) in bone marrow at 20 weeks after transplant (euthanize). (D) Frequency of MPP (CD48+CD150LSK), ST-HSC (CD48-CD150- LSK), and long-term hematopoietic stem cells (CD48-CD150+ LSK) in CD45.2+ LSK cells in the bone marrow at harvest. (E) Colony forming potential of sorted LSK cells from Mx1Cre, Csnk1a1fl/+, Egr1–/+, and Csnk1a1fl/+Egr1–/+ mice plated in methylcellulose at first and second plating. (F) Gene set enrichment analysis of Hallmark pathways on RNA sequencing data of sorted LSK; columns signify enriched pathways of contrast Egr1–/+ vs Mx1Cre+, Csnk1a1fl/+ vs Mx1Cre+, and Csnk1a1fl/+Egr1–/+ vs Mx1Cre+. (G) Characterization of cell type proportions of sorted LSK based on Cibersort tumor profiling. (H) Ridgeline plot comparing gene distribution of G2M- and S-phase genes based on Cibersort tumor profiling. (I) Intracellular Ki67 and 7-AAD staining to discriminate the cell cycle phases G0, G1, S-G2-M) within Mx1Cre, Csnk1a1fl/+, Egr1–/+ and Csnk1a1fl/+Egr1–/+ HoxB8-Flt3 cells. (J) Flow cytometric analysis of the competitive coculture assay of HOXB8 cells derived from Mx1Cre (GFP+) against HOXB8 cells derived from Csnk1a1fl/+, Egr1–/+, and Csnk1a1fl/+Egr1–/+ HoxB8-Flt3 cells (GFP) over 6 days. Data represent the mean ± standard error of the mean. Statistical test was performed by 1-way analysis of variance with Dunnet post hoc test to compare each genotype to control (Mx1Cre). Only significant results are marked and all other comparisons were nonsignificant. HGB, hemoglobin; IFN, interferon; PBS, phosphate-buffered saline; WBC, white blood cell.
Figure 2.
Figure 2.
Introduction of Trp53 mutations into bone marrow progenitors of del(5q) MDS mouse models leads to leukemic transformation in Csnk1a1–/+ p53mut mouse. (A) Schematic experimental design: WT recipients received transplantation with Mx1-Cre+, Csnk1a1–/+, Egr1–/+, and Csnk1a1–/+Egr1–/+ bone marrow progenitor cells (ckit+) transduced ex vivo with p53-sgRNA+Cas9 or ntg-sgRNA+Cas9. (B) Frequency of mice alive after 156 days. (C) Differential blood counts in MGG stained blood smears of recipient mice at the time of euthanization (156 days after transplant). (D) MGG staining of peripheral blood smear and bone marrow cytospins of leukemic mouse (00-1). Scale bars, 10 μm in blood smear and 50 μm in bone marrow cytospin. (E) Leukemic mouse 00-1 with peripheral blood blasts exhibited splenomegaly but no thymus tumor. Scale bar denotes 10 mm. (F) Pie charts showing indel distribution among mice with matched samples from peripheral blood, sampled 4 weeks after transplantation (left pie chart), and bone marrow was sampled at harvest (right pie chart). Genomic DNA was extracted, Trp53 amplified, and Sanger sequencing performed. Indel distribution was inferred using Tracking of Indels by Decomposition decomposition of sequence traces. Wild-type Trp53 sequence are in purple, and indels of different bp length are in other colors. (G) Flow cytometry of bone marrow of leukemic mouse (00-1) and nonleukemic control mouse (99-1) shows accumulation of large lineage negative CD48+ blasts and depletion of lineage markers expressing differentiated cells. (H) Sanger sequencing of Trp53 amplicon in leukemic mouse (00-1) bone marrow cells reveals 13bp deletion within DNA-binding domain of Trp53 compared with unedited donor bone marrow sequence (BM before transduction with Trp53 sgRNA-Cas9 construct) and Trp53 amplicon of nonleukemic control mouse 99-1. BM, bone marrow.
Figure 3.
Figure 3.
Leukemia is transplantable and rapidly progressing in secondary recipients. (A) Schematic representation of the secondary transplant, in which primary Csnk–/+p53 leukemic bone marrow was transplanted into 5 sublethally irradiated WT recipients and euthanized after 28 days. Secondary recipients of bone marrow cells received sublethal irradiation (6 Gy) and received transplantation with 2.5 × 106 bone marrow cells from leukemic mouse (00-1) each. All mice developed disease rapidly and were moribund within 4 weeks after transplant. (B) Peripheral blood counts at time of euthanasia show leukocytosis and elevated hemoglobin (HGB) levels in 3 of 5 mice. Platelet counts were normal. Reference levels are highlighted by purple rectangles. (C) Peripheral blood smears with MGG staining show infiltration with large basophil blasts. Scale bar, 100 μm. (D) Bone marrow cytospins with MGG staining show basophil blasts; scale bar, 50 μm. (E) Histograms demonstrating the surface marker expression profile of leukemic blasts analyzed by flow cytometry gated on alive/lineage negative cells. Blue curve represents healthy control bone marrow, and red curve represents bone marrow of leukemic secondary recipients. (F) Hematoxylin and eosin (HE) stainings of femur (scale bar, 100 μm) and spleen (scale bar, 200 μm) sections. (G) Total number of single nucleotide variants and small insertions and deletions identified by whole exome sequencing of immortalized blasts (IMMs), primary transplants (leukemic vs nonleukemic), and secondary transplants (transformed vs nontransformed) after indicated filtering steps.
Figure 4.
Figure 4.
Leukemic blasts can be cultured ex vivo and retransplanted and are susceptible to direct Csnk1a1 and CDK7/9 inhibition. (A) Scheme showing the potential applications of leukemic blasts: Csnk–/+p53 were expanded in vitro, transplanted into sublethally irradiated recipients, and used for small-scale drug screening based on viability. (B) In vitro expanded Csnk1a1–/+ p5mut blasts retain morphology of initial disease. Scale bar, 50 μm. (C) Platelet and white blood cell counts of sublethally irradiated (6 Gy) WT recipients of leukemic p53 blasts expanded in vitro (n = 3 mice) compared with controls with transplanted secondary leukemias. (D) Blast cells in the bone marrow were detected in 2 out of 3 mice that received transplantation with leukemic p53 blasts and compared to secondary leukemia transplants. (E) Bone marrow cellularity in mice that received transplantation with leukemic p53 blasts expanded in vitro. (F) HE staining of bone marrow (femur) section of mice transplanted with leukemic p53 blasts expanded in vitro. (G) Cell proliferation and survival (percentage viability) measured by MTT assay of cultured blasts (Csnk1a1–/+p53), Csnk1a1–/+ Hoxb8-Flt3, and WT Hoxb8-Flt3 cells subjected to increasing doses of D4476, A51, Alisertib, and Nutlin3a.
Figure 5.
Figure 5.
Csnk1a1–/+Trp53 mutant leukemias in tertiary transplants are sensitive to A51 treatment. (A) Schematic representation of tertiary sublethally irradiated (6 Gy) WT recipients of secondary Csnk–/+p53-transformed bone marrow cells (untreated controls, n = 6; A51-treated, n = 10). A51-treated mice received A51 compound (5 mg/kg per day) starting at 8 days after transplant, 5 days per week until 4 weeks after transplant (euthanasia). (B) White blood cell and platelet counts of control and A51-treated mice at 4 weeks after transplant (euthanasia). (C) Spleen-to-bodyweight ratio in control and A51-treated mice. (D) Percentage of blasts in peripheral blood and bone marrow, and bone marrow cellularity in control and A51-treated mice at 4 weeks after transplant (euthanasia). (E) HE staining of bone marrow (femur) sections (scale bar, 50 μm).
Figure 6.
Figure 6.
Leukemic growth is driven by MAPK signaling and Myc activation. (A) Transcriptional blast identified based on Cibersort profiling using published single cell data sets, specifically focusing on short-term and long-term stem cells, and multipotent progenitors. (B) Characterization of disease similarity of p53 blasts based on Cibersort profiling, published RNA sequencing data sets of murine leukemias with focus on acute erythroid leukemia (AEL), AML, and B-cell acute lymphoblastic leukemia (B-ALL). (C) Estimating the activity of transcription factors based on abundance changes of their targets (input: full list of differentially expressed gene blasts vs control) as a proxy of their activity using method DoRothEA positive scores to determine transcription factor (TF) in blasts compared with the nonleukemic controls. (D) Pathway response signature scores for 14 pathways inferred from differentially expressed genes between Csnk1a1–/+ p53mut leukemic blasts vs nonleukemic control using the method PROGENy (pathway responsive genes for activity inference). (E) Volcano plot showing differentially expressed genes between leukemic blasts vs control. Positive Log2FC: overexpressed in blasts; negative Log2FC: downregulated in blasts. (F) Volcano plot showing differentially expressed genes between Csnk1a1–/+ p53mut leukemic blasts vs control with genes belonging to Hallmark pathway “MYC targets.” Positive Log2FC: overexpressed in blasts; negative Log2FC: downregulated in blasts. (G) Putative interactome downstream of p53 dysfunction and Csnk1a1 haploinsufficiency inferred using method CARNIVAL (CAusal Reasoning for Network identification using Integer VALue programming). (H) Western blot analysis of MAPK1/3, MAPK8, Myc, and b-actin in Csnk–/+ p53 blasts, Csnk1a1fl/+ or Mx1-Cre HoxB8-Flt3 cells. (I) Western blot analysis of Myc and B-actin on bone marrow samples of mice that underwent tertiary transplantation and were untreated or treated with A51 compound (related to Figure 5). Blast percentage found in bone marrow is depicted at the bottom of the blot. (J) MYC expression in RNA sequencing data of 114 samples from patients with del(5q) MDS (p53 mutation, n = 22; p53 WT, n = 92) and 400 samples of MDS with normal karyotype (p53 mutation, n = 8; p53 WT, n = 392). (K) MYC expression in RNA sequencing data of 38 samples from patients with AML with del(5q) (p53 mutation, n = 26; p53 WT, n = 12) and 51 samples from patients with AML with normal karyotype and wild-type p53. (L) PRDX4 expression in RNA sequencing data of 38 samples from patients with AML with del(5q) (p53 mutation, n = 26; p53 WT, n = 12) and 51 samples from patients with AML with normal karyotype and wild-type p53.

References

    1. Haase D, Germing U, Schanz J, et al. New insights into the prognostic impact of the karyotype in MDS and correlation with subtypes: evidence from a core dataset of 2124 patients. Blood. 2007;110(13):4385–4395. - PubMed
    1. Christiansen DH, Andersen MK, Pedersen-Bjergaard J. Mutations with loss of heterozygosity of p53 are common in therapy-related myelodysplasia and acute myeloid leukemia after exposure to alkylating agents and significantly associated with deletion or loss of 5q, a complex karyotype, and a poor prognosis. J Clin Oncol. 2001;19(5):1405–1413. - PubMed
    1. Lindsley RC, Mar BG, Mazzola E, et al. Acute myeloid leukemia ontogeny is defined by distinct somatic mutations. Blood. 2015;125(9):1367–1376. - PMC - PubMed
    1. McNerney ME, Godley LA, Le Beau MM. Therapy-related myeloid neoplasms: when genetics and environment collide. Nat Rev Cancer. 2017;17(9):513–527. - PMC - PubMed
    1. Rücker FG, Schlenk RF, Bullinger L, et al. TP53 alterations in acute myeloid leukemia with complex karyotype correlate with specific copy number alterations, monosomal karyotype, and dismal outcome. Blood. 2012;119(9):2114–2121. - PubMed

Publication types