. 2024 Apr;37(4):e5090.
doi: 10.1002/nbm.5090. Epub 2023 Dec 26.

Single-shot diffusion trace-weighted MR spectroscopy: Comparison with unipolar and bipolar diffusion-weighted point-resolved spectroscopy

Affiliations

Single-shot diffusion trace-weighted MR spectroscopy: Comparison with unipolar and bipolar diffusion-weighted point-resolved spectroscopy

Andres Saucedo et al. NMR Biomed. 2024 Apr.

Abstract

This study demonstrates the feasibility and performance of the point-resolved spectroscopy (PRESS)-based, single-shot diffusion trace-weighted sequence in quantifying the trace apparent diffusion coefficient (ADC) in phantom and in vivo using a 3-T MRI/MRS scanner. The single-shot diffusion trace-weighted PRESS sequence was implemented and compared with conventional diffusion-weighted (DW)-PRESS variants using bipolar and unipolar diffusion-sensitizing gradients. Nine phantom datasets were acquired using each sequence, and seven volunteers were scanned in three different brain regions to determine the range and variability of trace ADC values, and to allow a comparison of trace ADCs among the sequences. This sequence results in a comparatively stable range of trace ADC values that are statistically significantly higher than those produced from unipolar and bipolar DW-PRESS sequences. Only total n-acetylaspartate, total creatine, and total choline were reliably estimated in all sequences with Cramér-Rao lower bounds of, at most, 20%. The larger trace ADCs from the single-shot sequences are probably attributable to the shorter diffusion time relative to the other sequences. Overall, this study presents the first demonstration of the single-shot diffusion trace-weighted sequence in a clinical scanner at 3 T. The results show excellent agreement of phantom trace ADCs computed with all sequences, and in vivo ADCs agree well with the expected differences between gray and white matter. The diffusion trace-weighted sequence could provide an estimate of the trace ADC in a shorter scan time (by nearly a factor of 3) compared with conventional DW-PRESS approaches that require three separate orthogonal directions.

Keywords: b-value; diffusion tensor; diffusion-weighting; point-resolved spectroscopy; trace apparent diffusion coefficient.


Conflict of interest statement

Conflict of Interest: The authors declare no conflict of interest.

Figures

Figure 1:
Figure 1:
Pulse sequence diagrams for the (A) Bipolar, (B) Unipolar, and (C) the single-shot diffusion trace-weighted (Trace) DW-PRESS sequences. The configuration for direction 1 ([1.0, 1.0, −0.5]) is shown here for the Bipolar and Unipolar DW-PRESS sequences. In general, TE = TE1 + TE2 for PRESS sequences. For the Bipolar and Trace DW-PRESS sequences, TE1 = TE2 = TE/2. The unipolar sequence was implemented with the minimum TE1 and the rest of the time evenly distributed within the TE2 period. The gradient ramp time is ζ, the duration is δ, and the separation between the start time of the dephasing and rephrasing lobes is Δ.
Figure 2:
Figure 2:
In vivo localization images for voxel locations in (A) frontal gray matter (FG) (B) occipital gray matter (OG), and (C) occipital (subcortical) white matter (OW). Due to the relatively large voxel size of 15.6 mL, the voxels in each region actually contain partial volumes of white and gray matter. The panel in (D) shows voxel placement in the GE Braino phantom.
Figure 3:
Figure 3:
Effect of cross-terms originating from the interaction of the diffusion-sensitizing gradients with a static background gradient G0 (shown in green). The diffusion direction corresponding to the vector [1.0, 1.0, −0.5] is shown. The gradient moments (F0, Fx, Fy, and Fz) are plotted along with the cross terms (F0Fx, F0Fy, and F0Fz), for the Bipolar, Unipolar, and Trace (diffusion trace-weighted) DW-PRESS sequences. The cross terms FxFy, FyFz, and FxFz that contribute to off-diagonal elements in the b-matrix are also shown. Note that the Bipolar and Trace DW-PRESS sequences have equal contributions of negative and positive areas in the F0Fx, F0Fy, and F0Fz plots, leading to cancellation of cross terms originating from the G0. The Unipolar DW-PRESS sequences, in contrast, retains a large net cross term contribution. For simplicity, the localization and crusher gradients were omitted in the computation of F0, Fj, and F0Fj (j = x, y, z).
Figure 4:
Figure 4:
(A) Representative spectra acquired with the Bipolar, Unipolar, and diffusion-trace weighted (Trace) DW-PRESS sequences. Spectra from all three b-values (b0, b1, b2) are shown. The spectra from the Bipolar and Unipolar DW-PRESS sequences acquired at all three directions with positive (d1+, d2+, d3+) and negative (d1−, d2−, d3−) polarities are shown. (B) The standard deviations (SD) of the zero-order phase corrections for the NAA peak (before application of eddy current phase correction). This SD is a measure of the effect of eddy currents on the acquired signal. (C) Percent difference of the water peak integral values between water spectra acquired with negative and positive polarities – mean and standard deviations (error bars) are shown for all three directions and for the two b-values greater than the b0. The unipolar sequence has markedly higher differences in b-values between the two polarities.
Figure 5:
Figure 5:
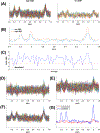
Post-processing procedures demonstrated from in vivo data: (A) Separation of the low- and high-SNR averages. (B) Comparison of the averaged spectra from the sets of low-SNR and high-SNR averages, showing that a reduction in peak intensities will result if the low-SNR averages are not removed. (C) The threshold criterion based on the SNR of the NAA singlet determines which specific averages to remove. (D) Raw spectra before zero-order phase correction. (E) The spectra after zero-order phase correction. (F) Frequency-drift correction after zero-order phasing. (G) Comparison between the uncorrected and corrected spectra.
Figure 6:
Figure 6:
In vivo spectra from Bipolar, Unipolar, and Trace DW-PRESS sequences, shown from acquisitions in occipital gray matter (OG). For Bipolar and Unipolar DW-PRESS, spectra are shown at b0 (null) and b2, for both gradient polarities (+, −) and all three directions (d1, d2, d3). An additional b-value (b1) was acquired for Trace DW-PRESS.
Figure 7:
Figure 7:
Average trace ADC values for the three main metabolite groups (tNAA, tCr, and tCho) in (A) frontal gray (FG) matter, (B) occipital gray (OG) matter, and (C) occipital (subcortical) white (OW) matter. (D) Average trace ADC value of water ADC in FG, OG, and OW. Note the overall larger trace ADC’s of water and metabolites from Trace DW-PRESS compared to the other sequences (Bipolar and Unipolar). * significantly different with respect to the Bipolar ADC (p < 0.05); # significantly different with respect to the Unipolar ADC (p < 0.05); significantly different with respect to ADC− (p < 0.05); significantly different with respect to ADC in OW (p < 0.05).
Figure 8:
Figure 8:
(A) Representative spectra from the Bipolar, Unipolar and Trace DW-PRESS acquisitions, from a healthy volunteer in the occipital gray (OG) matter region. (B) Plots of the NAA singlet at 2.01 ppm. For the Unipolar and Bipolar DW-PRESS sequences, the various spectra from two b-values (b0, b2), both gradient polarities (+, −), and three diffusion directions (d1, d2, d3) are overlaid. The NAA singlet is shown for the Trace DW-PRESS sequence at three b-values. (C) The water peak from the null to the highest diffusion-weighting. Note the greater degree of signal attenuation in the Trace DW-PRESS acquisitions, for the same b-value range (b0 and b2) as those shown for the Unipolar and Bipolar DW-PRESS spectra. (D) Zoom-in on the water spectra, indicating the greater reduction in water signal in the Trace DW-PRESS acquisitions.

Similar articles

Cited by

References

    1. Palombo M, Shemesh N, Ronen I, Valette J. Insights into brain microstructure from in vivo DW-MRS. NeuroImage. 2018;182:97–116. doi:10.1016/j.neuroimage.2017.11.028 - DOI - PubMed
    1. Ligneul C, Palombo M, Hernández-Garzón E, et al. Diffusion-weighted magnetic resonance spectroscopy enables cell-specific monitoring of astrocyte reactivity in vivo. NeuroImage. 2019;191:457–469. doi:10.1016/j.neuroimage.2019.02.046 - DOI - PubMed
    1. Harada M, Uno M, Hong F, Hisaoka S, Nishitani H, Matsuda T. Diffusion-weighted in vivo localized proton MR spectroscopy of human cerebral ischemia and tumor. NMR Biomed. 2002;15(1):69–74. doi:10.1002/nbm.759 - DOI - PubMed
    1. Zheng DD, Liu ZH, Fang J, Wang XY, Zhang J. The Effect of Age and Cerebral Ischemia on Diffusion-Weighted Proton MR Spectroscopy of the Human Brain. Am J Neuroradiol. 2012;33(3):563–568. doi:10.3174/ajnr.A2793 - DOI - PMC - PubMed
    1. Genovese G, Diaz-Fernandez B, Lejeune FX, et al. Longitudinal Monitoring of Microstructural Alterations in Cerebral Ischemia with in Vivo Diffusion-weighted MR Spectroscopy. Radiology. 2022:220430. - PMC - PubMed

MeSH terms