

CAR-Aptamers Enable Traceless Enrichment and Monitoring of CAR-Positive Cells and Overcome Tumor Immune Escape
- PMID: 38148412
- PMCID: PMC10933668
- DOI: 10.1002/advs.202305566
CAR-Aptamers Enable Traceless Enrichment and Monitoring of CAR-Positive Cells and Overcome Tumor Immune Escape
Abstract
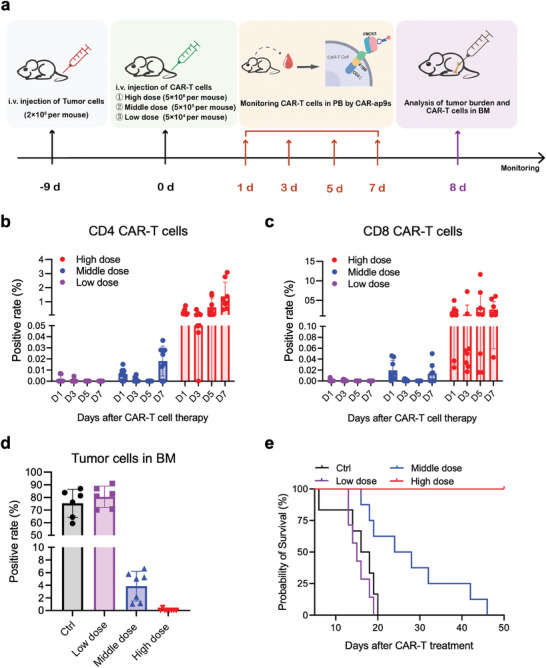
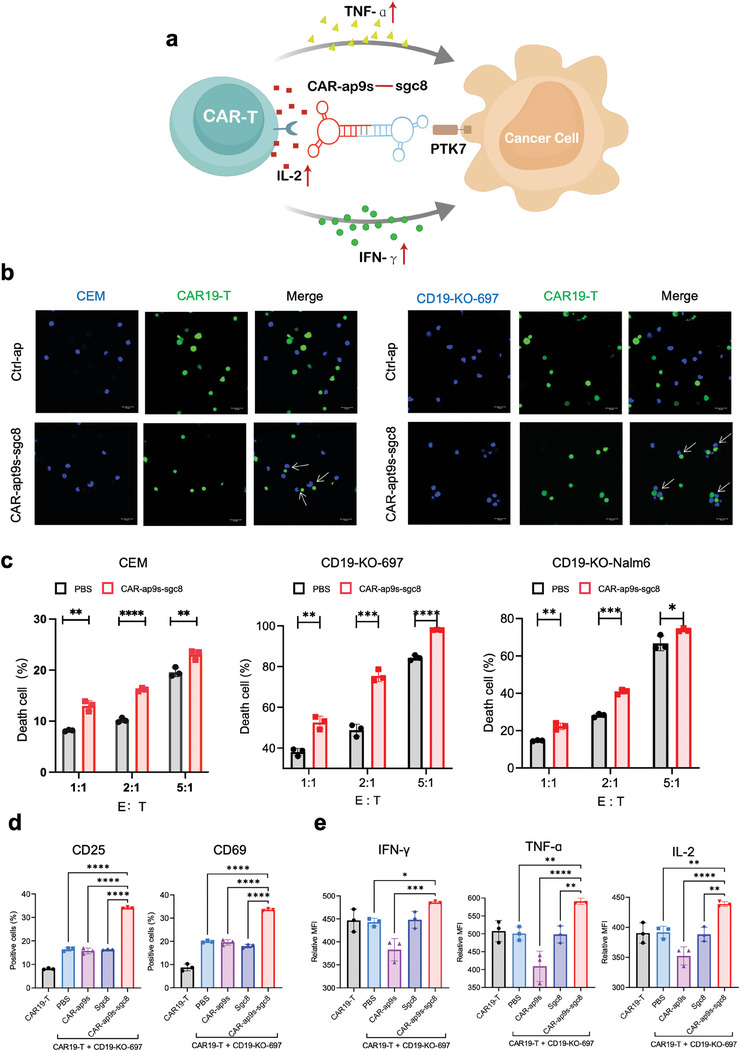
Chimeric antigen receptor (CAR)-positive cell therapy, specifically with anti-CD19 CAR-T (CAR19-T) cells, achieves a high complete response during tumor treatment for hematological malignancies. Large-scale production and application of CAR-T therapy can be achieved by developing efficient and low-cost enrichment methods for CAR-T cells, expansion monitoring in vivo, and overcoming tumor escape. Here, novel CAR-specific binding aptamers (CAR-ap) to traceless sort CAR-positive cells and obtain a high positive rate of CAR19-T cells is identified. Additionally, CAR-ap-enriched CAR19-T cells exhibit similar antitumor capacity as CAR-ab (anti-CAR antibody)-enriched CAR-T cells. Moreover, CAR-ap accurately monitors the expansion of CAR19-T cells in vivo and predicts the prognosis of CAR-T treatment. Essentially, a novel class of stable CAR-ap-based bispecific circular aptamers (CAR-bc-ap) is constructed by linking CAR-ap with a tumor surface antigen (TSA): protein tyrosine kinase 7 (PTK7) binding aptamer Sgc8. These CAR-bc-aps significantly enhance antitumor cytotoxicity with a loss of target antigens by retargeting CAR-T cells to the tumor in vitro and in vivo. Overall, novel CAR-aptamers are screened for traceless enrichment, monitoring of CAR-positive cells, and overcoming tumor cell immune escape. This provides a low-cost and high-throughput approach for CAR-positive cell-based immunotherapy.
Keywords: CAR-T cells; aptamers; monitor; retargeting; traceless enrichment.
© 2023 The Authors. Advanced Science published by Wiley-VCH GmbH.
Conflict of interest statement
The authors declare no conflict of interest.
Figures


Similar articles
-
Anti-CD79b/CD3 bispecific antibody combined with CAR19-T cells for B-cell lymphoma treatment.Cancer Immunol Immunother. 2023 Nov;72(11):3739-3753. doi: 10.1007/s00262-023-03526-z. Epub 2023 Sep 14. Cancer Immunol Immunother. 2023. PMID: 37707586 Free PMC article.
-
PTK7-Targeting CAR T-Cells for the Treatment of Lung Cancer and Other Malignancies.Front Immunol. 2021 Aug 12;12:665970. doi: 10.3389/fimmu.2021.665970. eCollection 2021. Front Immunol. 2021. PMID: 34475869 Free PMC article.
-
A tandem CD19/CD20 CAR lentiviral vector drives on-target and off-target antigen modulation in leukemia cell lines.J Immunother Cancer. 2017 May 16;5:42. doi: 10.1186/s40425-017-0246-1. eCollection 2017. J Immunother Cancer. 2017. PMID: 28515942 Free PMC article.
-
Chimeric antigen receptor-engineered T-cell therapy for liver cancer.Hepatobiliary Pancreat Dis Int. 2018 Aug;17(4):301-309. doi: 10.1016/j.hbpd.2018.05.005. Epub 2018 May 24. Hepatobiliary Pancreat Dis Int. 2018. PMID: 29861325 Review.
-
Antigen escape in CAR-T cell therapy: Mechanisms and overcoming strategies.Biomed Pharmacother. 2024 Sep;178:117252. doi: 10.1016/j.biopha.2024.117252. Epub 2024 Aug 3. Biomed Pharmacother. 2024. PMID: 39098176 Review.
Cited by
-
Recent insights into the therapeutic strategies targeting the pseudokinase PTK7 in cancer.Oncogene. 2024 Jun;43(26):1973-1984. doi: 10.1038/s41388-024-03060-x. Epub 2024 May 21. Oncogene. 2024. PMID: 38773263 Free PMC article. Review.
-
PTK7: an underestimated contributor to human cancer.Front Oncol. 2024 Oct 15;14:1448695. doi: 10.3389/fonc.2024.1448695. eCollection 2024. Front Oncol. 2024. PMID: 39474113 Free PMC article. Review.
-
Novel insights into the heterogeneity of FOXP3 + Treg cells in drug-induced allergic reactions through single-cell transcriptomics.Immunol Res. 2024 Oct;72(5):1071-1085. doi: 10.1007/s12026-024-09509-1. Epub 2024 Jul 29. Immunol Res. 2024. PMID: 39073709
-
Aptamer based immunotherapy: a potential solid tumor therapeutic.Front Immunol. 2025 Feb 17;16:1536569. doi: 10.3389/fimmu.2025.1536569. eCollection 2025. Front Immunol. 2025. PMID: 40034705 Free PMC article. Review.
-
Development of a DNA Aptamer-Based Approach to Noninvasively Image CAR-T Cells In Vivo and Traceless Enrichment In Vitro.Adv Sci (Weinh). 2025 Jul;12(28):e2506746. doi: 10.1002/advs.202506746. Epub 2025 May 11. Adv Sci (Weinh). 2025. PMID: 40349166 Free PMC article.
References
-
- a) Martino M., Alati C., Canale F. A., Musuraca G., Martinelli G., Cerchione C., Int. J. Mol. Sci. 2021, 22; - PMC - PubMed
- b) Brudno J. N., Maric I., Hartman S. D., Rose J. J., Wang M., Lam N., Stetler‐Stevenson M., Salem D., Yuan C., Pavletic S., Kanakry J. A., Ali S. A., Mikkilineni L., Feldman S. A., Stroncek D. F., Hansen B. G., Lawrence J., Patel R., Hakim F., Gress R. E., Kochenderfer J. N., J. Clin. Oncol. 2018, 36, 2267. - PMC - PubMed
-
- a) Lee D. W., Kochenderfer J. N., Stetler‐Stevenson M., Cui Y. K., Delbrook C., Feldman S. A., Fry T. J., Orentas R., Sabatino M., Shah N. N., Steinberg S. M., Stroncek D., Tschernia N., Yuan C., Zhang H., Zhang L., Rosenberg S. A., Wayne A. S., Mackall C. L., Lancet 2015, 385, 517; - PMC - PubMed
- b) Mahadeo K. M., Khazal S. J., Abdel‐Azim H., Fitzgerald J. C., Taraseviciute A., Bollard C. M., Tewari P., Duncan C., Traube C., Mccall D., Steiner M. E., Cheifetz I. M., Lehmann L. E., Mejia R., Slopis J. M., Bajwa R., Kebriaei P., Martin P. L., Moffet J., Mcarthur J., Petropoulos D., O'hanlon Curry J., Featherston S., Foglesong J., Shoberu B., Gulbis A., Mireles M. E., Hafemeister L., Nguyen C., Kapoor N., et al., Nat. Rev. Clin. Oncol. 2019, 16, 45. - PMC - PubMed
-
- a) Center for Biologics Evaluation and Research, Food and Drug Administration (FDA), 2017, https://www.fda.gov/media/106989/download;
- b) Center for Biologics Evaluation and Research, Food and Drug Administration (FDA), 2017, https://www.fda.gov/media/108458/download;
- c) Center for Biologics Evaluation and Research, Food and Drug Administration (FDA) 2020, https://www.fda.gov/media/140415/download;
- d) Food and Drug Administration (FDA), Food and Drug Administration (FDA), 2021, https://www.fda.gov/media/145712/download
Publication types
MeSH terms
Substances
Grants and funding
LinkOut - more resources
Full Text Sources
Research Materials
Miscellaneous