. 2024 Mar;20(3):1894-1912.
doi: 10.1002/alz.13604. Epub 2023 Dec 26.

Tau seeds from Alzheimer's disease brains trigger tau spread in macaques while oligomeric-Aβ mediates pathology maturation

Affiliations

Tau seeds from Alzheimer's disease brains trigger tau spread in macaques while oligomeric-Aβ mediates pathology maturation

Morgane Darricau et al. Alzheimers Dement. 2024 Mar.

Abstract

Introduction: The "prion-like" features of Alzheimer's disease (AD) tauopathy and its relationship with amyloid-β (Aβ) have never been experimentally studied in primates phylogenetically close to humans.

Methods: We injected 17 macaques in the entorhinal cortex with nanograms of seeding-competent tau aggregates purified from AD brains or control extracts from aged-matched healthy brains, with or without intracerebroventricular co-injections of oligomeric-Aβ.

Results: Pathological tau injection increased cerebrospinal fluid (CSF) p-tau181 concentration after 18 months. Tau pathology spreads from the entorhinal cortex to the hippocampal trisynaptic loop and the cingulate cortex, resuming the experimental progression of Braak stage I to IV. Many AD-related molecular networks were impacted by tau seeds injections regardless of Aβ injections in proteomic analyses. However, we found mature neurofibrillary tangles, increased CSF total-tau concentration, and pre- and postsynaptic degeneration only in Aβ co-injected macaques.

Discussion: Oligomeric-Aβ mediates the maturation of tau pathology and its neuronal toxicity in macaques but not its initial spreading.

Highlights: This study supports the "prion-like" properties of misfolded tau extracted from AD brains. This study empirically validates the Braak staging in an anthropomorphic brain. This study highlights the role of oligomeric Aβ in driving the maturation and toxicity of tau pathology. This work establishes a novel animal model of early sporadic AD that is closer to the human pathology.

Keywords: Alzheimer's disease; beta-amyloid; non-human primate; prion-like; tau; tauopathy.


Conflict of interest statement

Erwan Bezard is a director and shareholder of Motac Neuroscience Ltd. During the past 3 years, Vincent Planche was a local unpaid investigator or sub‐investigator for clinical trials granted by Novo Nordisk, Biogen, TauRx Pharmaceuticals, Janssen, Green Valley Pharmaceuticals, and Alector. Vincent Planche served as a consultant for Motac Neuroscience Ltd, outside the submitted work. The other authors declare no conflict of interest. Author disclosures are available in the supporting information.

Figures

FIGURE 1
FIGURE 1
Tau seeds extraction, selection, and characterization. (A) Schematic summary of the extraction/purification protocol used to purify tau aggregates from post mortem Alzheimer's disease (AD) and control (CTL) brains. The final sucrose gradient purification procedure leads to the isolation of 21 fractions of 500 μL. (B) Examples of filter retardation assay probed with AT8 antibody to assess the presence of pathological phospho‐tau aggregates in the different fractions isolated in the sucrose gradient. Red rectangles indicate the fractions selected to prepare AD and CTL samples (fractions 13 and 14, where tau aggregates are most frequently found, according to Greenberg et al. 30 ). (C) Schematic representation of the HTRF® Tau aggregation assay (left panel). Fluorescence signal intensity reflects the number of tau aggregates in each 12 AD or 6 CTL samples (pooled fractions 13 and 14) screened for this study (middle panel). Based on this assay, we pooled the samples from four AD patients (F, G, H, and N) and four CTL (I, K, O, and Q) to obtain an “AD mix” and a “CTL mix” (right panel) that were further characterized and used for primates experiments. Dotted rectangles indicate the selected samples. (D) Western blot characterization of “AD‐tau mix” and “CTL‐tau mix” solutions using the pan‐tau KJ9A antibody. (E) Representative fluorescent images of the high throughput tau seeding assay using the tau P301S‐Venus cell line transfected with AD‐mix or CTL‐mix. Scale bar: 50 μm. (F) Quantitative results of the assay (number of tau‐venus‐positive punctae/aggregates per cell, 48 h after adding seeds or control material). The p‐values refer to the results of a two‐way analysis of variance (ANOVA). (G) Schematic and timeline of the macaque experiments with the presentation of the five experimental conditions
FIGURE 2
FIGURE 2
Injections of Alzheimer's disease (AD) patients‐derived tau aggregates increased cerebrospinal fluid (CSF) ptau‐181 and total‐tau concentrations in macaques. Quantification of p‐tau181 (A), total tau (B), and amyloid‐β (Aβ) 42/40 ratio (C) concentrations 18 months after injection with the clinical‐grade Lumipulse technology (Fujirebio). Quantitative results are represented in the five experimental groups using bar and dot plots. They are also represented with estimation plots where sham animals and the two control (CTL)‐tau groups were pooled (“pooled CTL”) and compared to AD‐tau/sham or AD‐tau/Aβ groups. The p‐values refer to the results of Mann‐Whitney tests
FIGURE 3
FIGURE 3
Injections of Alzheimer's disease (AD) patients‐derived tau aggregates induced tau pathology in macaques. (A) Representative images of AT8 staining in whole brain slides. Left slide: Segmentation of each region of interest (ROI) for quantitative analyses. CG: cingulate cortex, S2: somatosensory cortex, Pu: putamen, DG: dentate gyrus, SuB: subiculum, Ent: entorhinal cortex, and TE: temporal cortex. Scale bar: 1.45 mm. (B–H) Illustrative images of AT8‐positive lesions: (B–D) AT8‐positive neurofibrillary tangles, (E) mature tangle stained by thioflavin‐S, and (F–H) AT8‐positive neuropils threads. (I) Quantification of AT8‐positive neuropils density in different ROIs. (J) Quantification of AT8‐positive tangles density. Quantitative results are represented in the five experimental groups using bar and dot plots. They are also represented with estimation plots where sham animals and the two control (CTL)‐tau groups were pooled (“pooled CTL”) and compared to AD‐tau/sham or AD‐tau/Aβ groups. The p‐values refer to the results of Mann‐Whitney tests. Scale bar: 20 μm
FIGURE 4
FIGURE 4
Injections of oligomeric amyloid‐β (Aβ) did not induce plaque formation but amyloid angiopathy. (A) Representative images of amyloid pathology in whole brain slides using 6E10 staining. Scale bar: 1.45 mm. (B, C) Amyloid plaques (6E10) were found in macaques with or without oligomeric Aβ injections. (D and E) Thioflavin‐S positive amyloid plaque (white arrow) and capillary (white arrowhead). (F, G) Cerebral amyloid angiopathy (6E10) was found only in macaques injected with oligomeric Aβ. (H) Quantitative analyses of amyloid plaque density. Quantitative results are represented in the five experimental groups using bar and dot plots. They are also represented with estimation plots where sham animals and the two CTL‐tau groups were pooled (“pooled CTL”) and compared to AD‐tau/sham or AD‐tau/Aβ groups. Scale bar: 20 μm
FIGURE 5
FIGURE 5
Injections of Alzheimer's disease (AD) patients‐derived tau aggregates induced brain inflammation. (A) Representative images of microglial staining (Iba‐1) and quantification of microglial fractal dimension for each experimental condition in brain areas affected by tauopathy. Right: Estimation plots of the quantification in the pooled region of interest. (B) Representative images of astrocytic staining (GFAP/S‐100) and quantitative analyses of the surface intensity of staining in brain areas affected by tauopathy. (A, B) Quantitative results are represented in each of the five experimental groups in brain areas affected by tauopathy using bar and dot plots. They are also represented with estimation plots showing quantification in all regions of interest. Sham animals and the two control (CTL)‐tau groups were pooled (“pooled CTL”) and compared to AD‐tau/sham or AD‐tau/Aβ groups. The p‐values refer to the results of Mann–Whitney tests. Scale bar: 20 μm
FIGURE 6
FIGURE 6
Injections of Alzheimer's disease (AD) patients‐derived tau aggregates induced synaptic loss in the CA1 subfield of the hippocampus. (A) Representative images of synaptophysin, β‐actin, and PSD95 immunoblotting for each macaque. (B, C) Quantitative analyses of PSD‐95 (B) and synaptophysin (C) expression level. Quantitative results are represented in the five experimental groups using bar and dot plots. They are also represented with estimation plots where sham animals and the two control (CTL)‐tau groups were pooled (“pooled CTL”) and compared to AD‐tau/sham or AD‐tau/Aβ groups. The p‐values refer to the results of Mann–Whitney tests
FIGURE 7
FIGURE 7
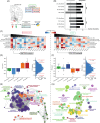
Proteomic analyses highlighted neuronal dysfunction and spreading‐related pathways in macaques. (A) Schematic of the overall design of proteomic analyses with experimental groups and regions (ENT: entorhinal cortex). (B) Summary of the differentially expressed proteins observed in the different groups and brain regions (reference: Sham/sham animals). (C) Heatmap of the correlation coefficient between pathological variables and principal component analysis computed on the whole proteome. Principal components (PCs) are ranked according to the amount of explained variance. The black square illustrates the PC selected for pathway enrichment analysis. (D, F) Individual scores on the selected PC per group (left). Distribution of the variable (i.e., proteins) loadings in the selected PC (right), red lines illustrate the boundaries for selecting relevant proteins. (E, G) Gene ontology network enrichment analysis. Node size illustrates the number of proteins belonging to a given term. Edge length illustrates the similarity between nodes. An edge‐weighted force‐directed layout was applied to cluster nodes by similarity

References

    1. 2022 Alzheimer's disease facts and figures. Alzheimers Dement. 2022;18(4):700‐789. doi:10.1002/alz.12638 - DOI - PubMed
    1. Hyman BT, Phelps CH, Beach TG, et al. National Institute on Aging‐Alzheimer's Association guidelines for the neuropathologic assessment of Alzheimer's disease. Alzheimers Dement. 2012;8(1):1‐13. 10.1016/j.jalz.2011.10.007 - DOI - PMC - PubMed
    1. Hardy JA, Higgins GA. Alzheimer's disease: the amyloid cascade hypothesis. Science. 1992;256(5054):184‐185. doi:10.1126/science.1566067 - DOI - PubMed
    1. Frisoni GB, Altomare D, Thal DR, et al. The probabilistic model of Alzheimer disease: the amyloid hypothesis revised. Nat Rev Neurosci. 2022;23(1):53‐66. doi:10.1038/s41583-021-00533-w - DOI - PMC - PubMed
    1. Jack CR, Bennett DA, Blennow K, et al. NIA‐AA research framework: toward a biological definition of Alzheimer's disease. Alzheimers Dement. 2018;14(4):535‐562. doi:10.1016/j.jalz.2018.02.018 - DOI - PMC - PubMed

Publication types