. 2023 Dec 12:14:1304537.
doi: 10.3389/fphys.2023.1304537. eCollection 2023.

Differential Myosin 5a splice variants in innervation of pelvic organs

Affiliations

Differential Myosin 5a splice variants in innervation of pelvic organs

Josephine A Carew et al. Front Physiol. .

Abstract

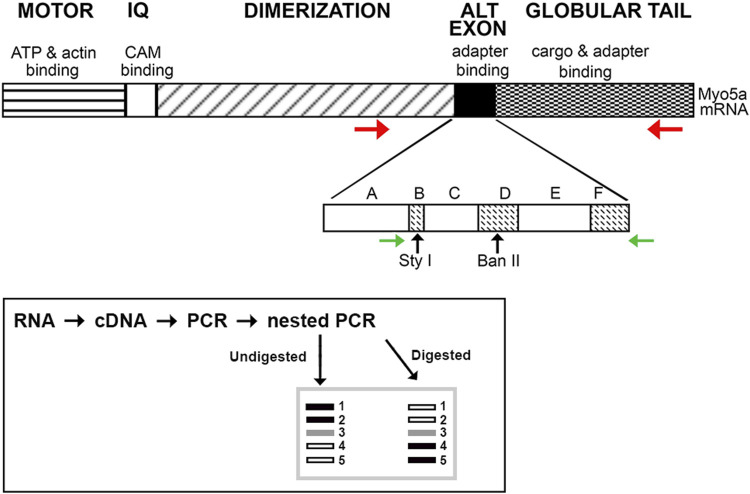
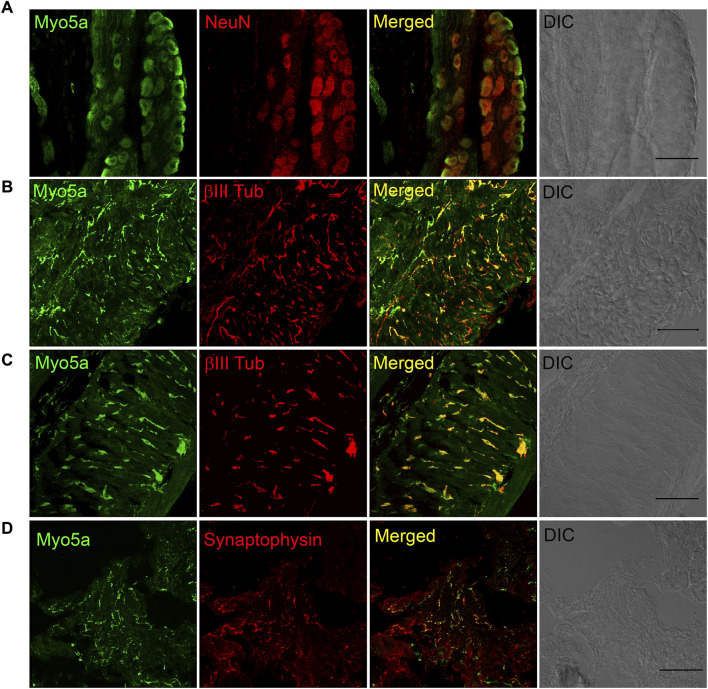
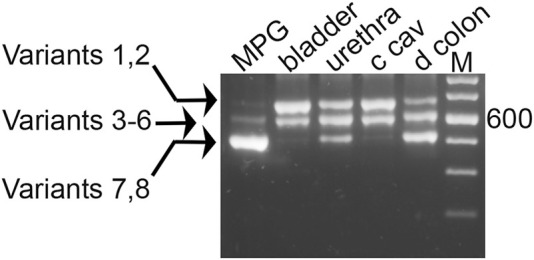
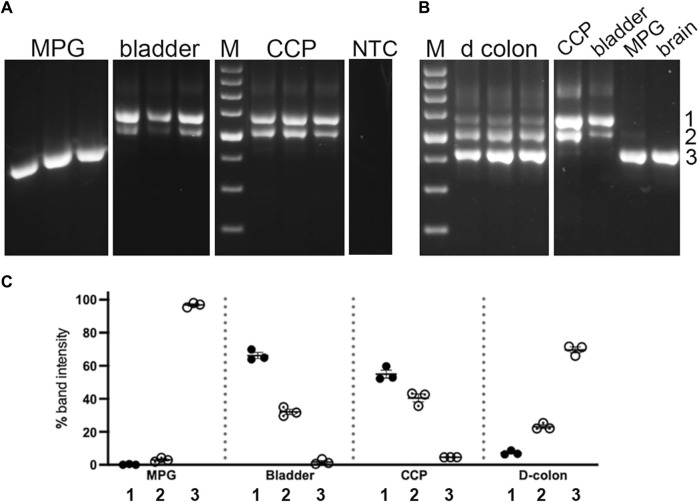
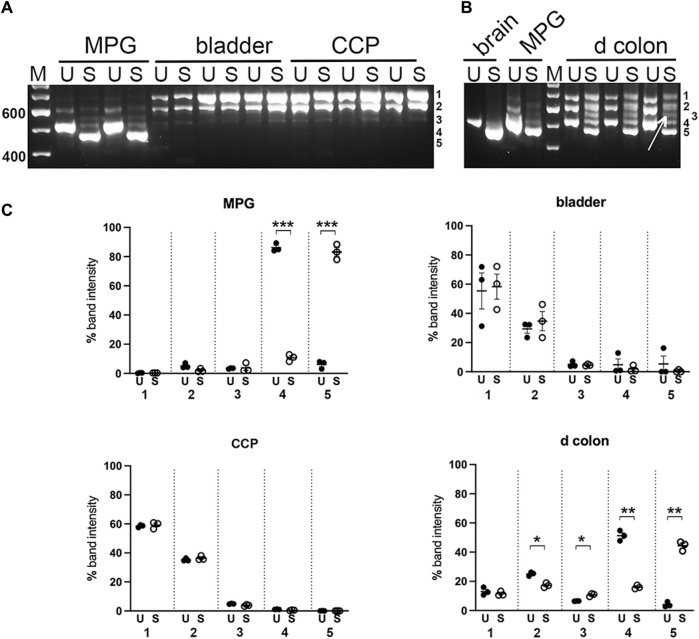
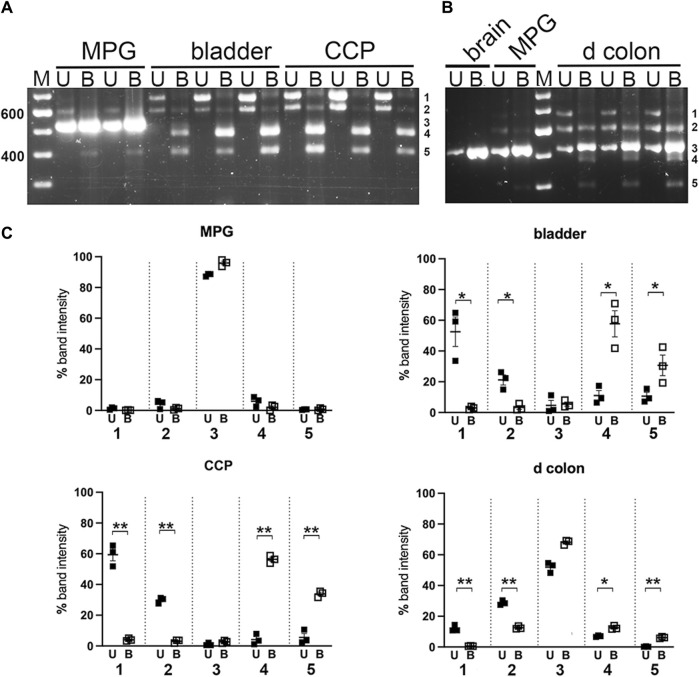
Introduction: Myosin proteins interact with filamentous actin and translate the chemical energy generated by ATP hydrolysis into a wide variety of mechanical functions in all cell types. The classic function of conventional myosins is mediation of muscle contraction, but myosins also participate in processes as diverse as exocytosis/endocytosis, membrane remodeling, and cytokinesis. Myosin 5a (Myo5a) is an unconventional motor protein well-suited to the processive transport of diverse molecular cargo within cells and interactions with multiprotein membrane complexes that facilitate exocytosis. Myo5a includes a region consisting of six small alternative exons which can undergo differential splicing. Neurons and skin melanocytes express characteristic splice variants of Myo5a, which are specialized for transport processes unique to those cell types. But less is known about the expression of Myo5a splice variants in other tissues, their cargos and interactive partners, and their regulation. Methods: In visceral organs, neurotransmission-induced contraction or relaxation of smooth muscle is mediated by Myo5a. Axons within urogenital organs and distal colon of rodents arise from cell bodies located in the major pelvic ganglion (MPG). However, in contrast to urogenital organs, the distal colon also contains soma of the enteric nervous system. Therefore, the rodent pelvic organs provide an opportunity to compare the expression of Myo5a splice variants, not only in different tissues innervated by the pelvic nerves, but also in different subcellular compartments of those nerves. This study examines the expression and distribution of Myo5a splice variants in the MPG, compared to the bladder, corpus cavernosum of the penis (CCP) and distal colon using immunohistochemistry and mRNA analyses. Results/discussion: We report detection of characteristic Myo5a variants in these tissues, with bladder and CCP displaying a similar variant pattern but one which differed from that of distal colon. In all three organs, Myo5a variants were distinct compared to the MPG, implying segregation of one variant within nerve soma and its exclusion from axons. The expression of distinct Myo5a variant arrays is likely to be adaptive, and to underlie specific functions fulfilled by Myo5a in those particular locations.

Keywords: myosin motor; neurotransmission; pelvic organ; peripheral nerve; protein splice variants.


Conflict of interest statement

The authors declare that the research was conducted in the absence of any commercial or financial relationships that could be construed as a potential conflict of interest.

Figures

FIGURE 1
FIGURE 1
Schematic of Myo5a. The regions of Myo5a encoding the ATP binding, motor, calmodulin-binding (IQ), alternative exon and globular tail domains, and the known functions of each, are portrayed at top. The expansion depicts organization of the alternative exon domain; exons A, C and E are constitutively expressed in all variants, whereas exons B, D and F are optional. Horizontal arrows represent positions of PCR primers (red, initial reaction; green, nested reaction) while approximate positions of unique Sty I and Ban II restriction enzyme sites within exons B and D, respectively, are indicated by vertical arrows. The inset depicts the PCR and restriction enzyme methodology used to assess the presence and proportion of Myo5a splice variants.
FIGURE 2
FIGURE 2
Distribution of Myosin 5a (Myo5a) in different murine organs innervated by the pelvic plexus. (A) Whole-mount preparation of the MPG displays abundant staining for Myo5a which was extensively co-localized with the neuronal marker NeuN. Myo5a immunoreactivity was also detectable on fibers running throughout the bladder (B) and the distal colon (C) Co-localization of Myo5a signal with β-III tubulin confirmed the neuronal nature of myo5a distribution in these tissues. (D) Myo5a immunoreactivity was abundantly detected and co-localized with the synaptic-vesicle marker synaptophysin in the CCP. Tissue topography was shown in the differential interference contrast (DIC) image from each preparation. Magnification ×40; scale bars = 50 μm.
FIGURE 3
FIGURE 3
Myo5a PCR product sizes of pelvic tissues. Nested PCR was performed with a representative sample from each of four tissues, and compared by 2% agarose gel electrophoresis. An intervening lane was removed (white line). Three distinct bands were observed per sample, and in comparison to the DNA size markers (M, 100 bp ladder, with weighted 600 bp standard) they were of approximate mass 700, 600, and 500 bp. The arrows at left indicate the possible variants corresponding to each band, from Table 1.
FIGURE 4
FIGURE 4
Undigested PCR products of pelvic tissues. Nested PCR was performed on three replicates of each tissue type, which were analyzed by 2% agarose gel electrophoresis, Panel (A) shows replicates from MPG, bladder and CCP. In parallel with experimental reactions, a control reaction which included all PCR reaction components except cDNA, was run. An aliquot of this reaction was then included as a template in a control nested PCR reaction. No PCR product was detected in this reaction (NTC). Panel (B) shows replicates from distal colon, as well as a single sample each from CCP, bladder, MPG and brain for comparison with the samples from panel (A). For both panels, white lines indicate the removal of intervening lanes from the images. Standards differing by 100 bp increments (with weighted 600 bp standard) were run on each gel (M). Numbers 1 through 3 at the far right indicate band identities. (C) Relative percentages of these three PCR products were determined, then replicates were average and graphed +/- SEM. ∼700 bp band 1, filled circles; ∼600 bp band 2, dotted circles; ∼500 bp band 3, open circles.
FIGURE 5
FIGURE 5
Sty I digestion of PCR products from pelvic tissues. Undigested (U) and Sty I digested (S) nested PCR pairs from replicates of MPG, bladder, CCP (A), or from distal colon (d colon) and MPG, with brain for reference (B) were electrophoresed and analyzed as described in Methods. For mass estimation, a 100 bp DNA ladder with weighted 600 bp standard was run (M). Numbers 1 through 5 at the right of each image correspond to band identities. Bands 1, 2 and 4 correspond to the upper (∼700 bp), middle (∼600 bp), and lower (∼500 bp) bands present in undigested samples and remaining undigested by Sty I. Band 3, indicated by arrow in panel B, represents a Sty I cleavage product of band 2; band 5 represents a cleavage product of band 4. (C), Fluorescence was quantitated at each of the five band positions and converted to the percentage of total fluorescence recovered in that lane. Replicates at each band position were averaged and graphed +/- SEM, (U = undigested, closed circles; S = Sty I digestion, open circles). n = 3 per tissue. Significant changes in fluorescence at each band position due to Sty I digestion are indicated (*p < 0.05; **p < 0.01; ***p < 0.001).
FIGURE 6
FIGURE 6
Ban II digestion of PCR products from pelvic tissues. Undigested (U) and Ban II digested (B) nested PCR pairs from replicates of MPG, bladder, CCP (A), or from distal colon with MPG and brain for reference (B) were electrophoresed and analyzed as described in Methods. For mass estimation, a 100 bp DNA ladder with weighted 600 bp standard was run (M). Numbers 1 through 5 at the right of each image correspond to band identities. Bands 1, 2 and 3 correspond to the upper (∼700 bp), middle (∼600 bp), and lower (∼500 bp) bands present in undigested samples and remaining undigested by Ban II. Band 4 represents a cleavage product of band 1; band 5 represents a cleavage product of band 2. (C) Fluorescence was quantitated at each of the five band positions and expressed as a percentage of total fluorescence recovered in that lane. Replicates at each band position were averaged and graphed +/- SEM. (U = undigested, closed squares; B = Ban II digestion, open squares). n = 3 per tissue. Significant changes in fluorescence at each band position due to Ban II digestion are indicated (*p < 0.05; **p < 0.01).

Similar articles

Cited by

References

    1. Au J. S., Huang J. D. (2002). A tissue-specific exon of myosin Va is responsible for selective cargo binding in melanocytes. Cell Motil. Cytoskelet. 53 (2), 89–102. 10.1002/cm.10061 - DOI - PubMed
    1. Black M. M. (2016). Axonal transport: the orderly motion of axonal structures. Methods Cell Biol. 131, 1–19. 10.1016/bs.mcb.2015.06.001 - DOI - PubMed
    1. Bridgman P. C. (2009). Myosin motor proteins in the cell biology of axons and other neuronal compartments. Results Probl. Cell Differ. 48, 91–105. 10.1007/400_2009_10 - DOI - PubMed
    1. Brooks S. A., Gabreski N., Miller D., Brisbin A., Brown H. E., Streeter C., et al. (2010). Whole-genome SNP association in the horse: identification of a deletion in myosin Va responsible for Lavender Foal Syndrome. PLoS Genet. 6 (4), e1000909. 10.1371/journal.pgen.1000909 - DOI - PMC - PubMed
    1. Buttow N. C., Espreafico E. M., de Souza R. R., Romano E. B. (2006). Immunolocalization of myosin-V in the peribronchial, intrapulmonary peritracheal plexuses of the Wistar rat. J. Neurosci. Methods 152 (1-2), 274–277. 10.1016/j.jneumeth.2005.09.012 - DOI - PubMed

LinkOut - more resources