. 2023 Dec 15;11(6):481-499.
eCollection 2023.

Investigating the effects of storage conditions on urinary volatilomes for their reliability in disease diagnosis

Affiliations

Investigating the effects of storage conditions on urinary volatilomes for their reliability in disease diagnosis

Kiana L Holbrook et al. Am J Clin Exp Urol. .

Abstract

Background: Cancer detection presents challenges regarding invasiveness, cost, and reliability. As a result, exploring alternative diagnostic methods holds significant clinical importance. Urinary metabolomic profiling has emerged as a promising avenue; however, its application for cancer diagnosis may be influenced by sample preparation or storage conditions.

Objective: This study aimed to assess the impact of sample storage and processing conditions on urinary volatile organic compounds (VOCs) profiles and establish a robust standard operating procedure (SOP) for such diagnostic applications.

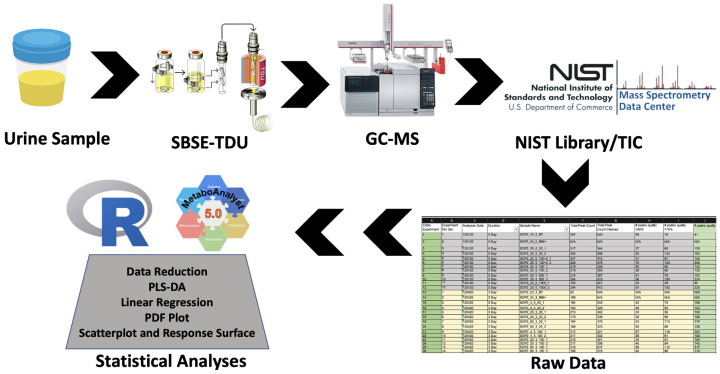
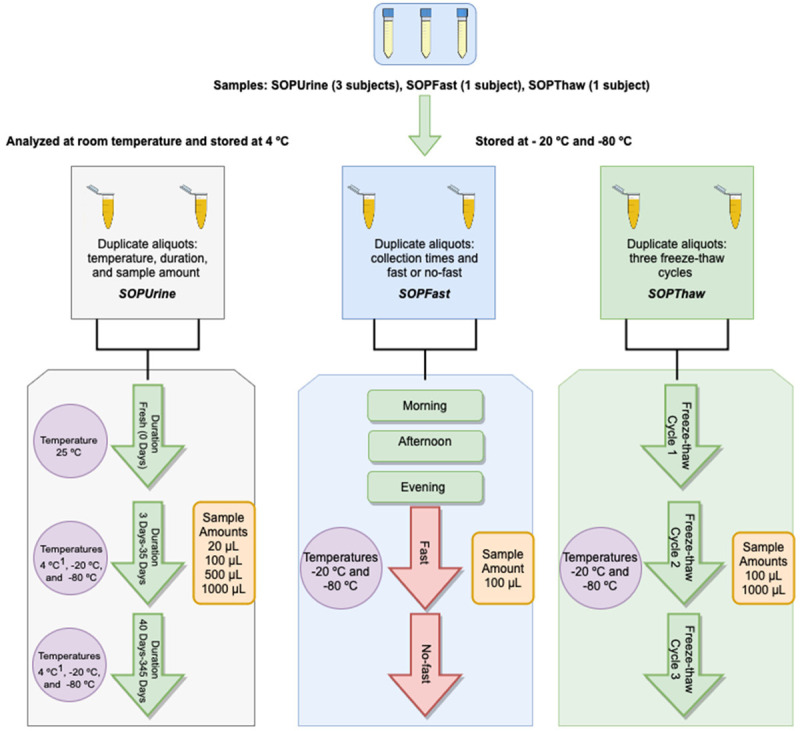
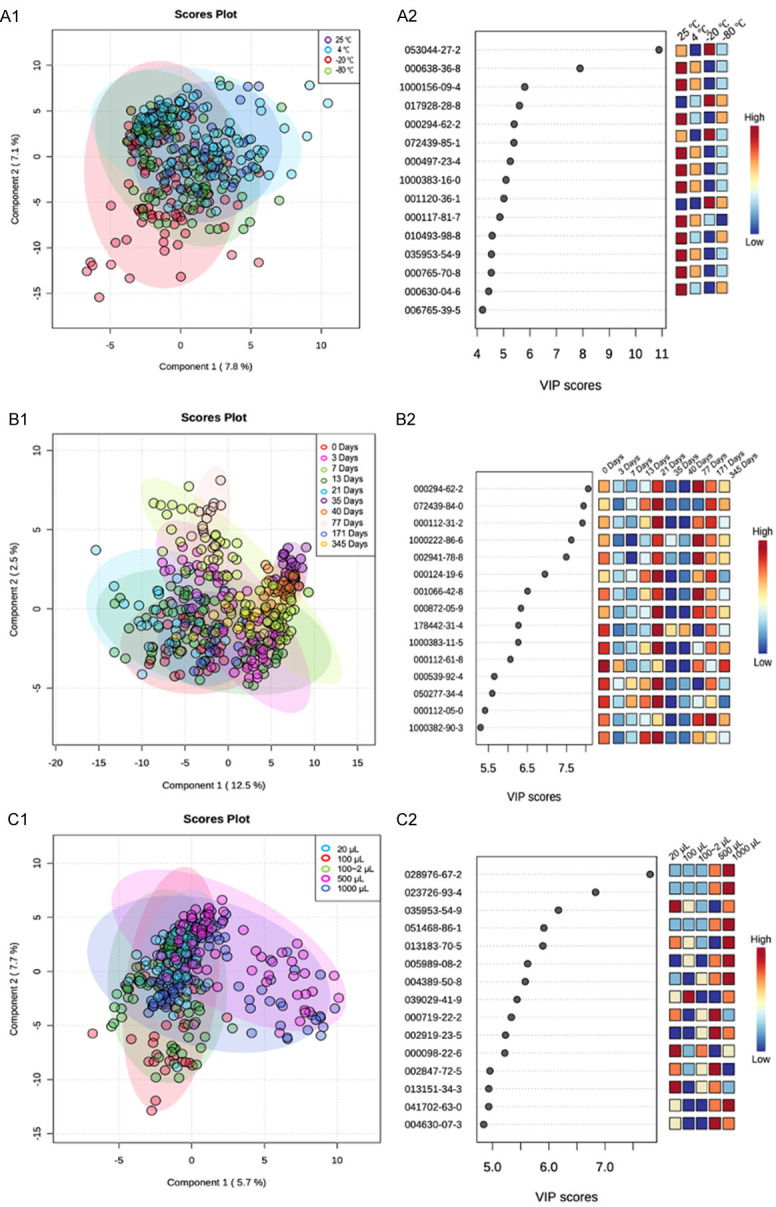
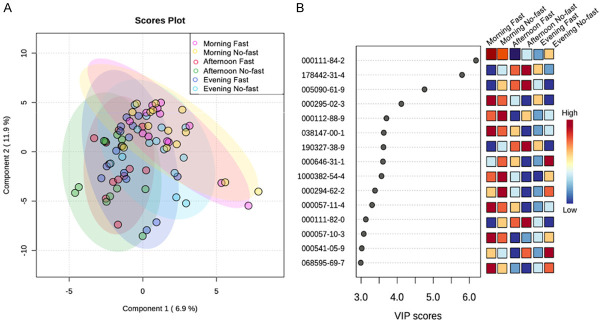
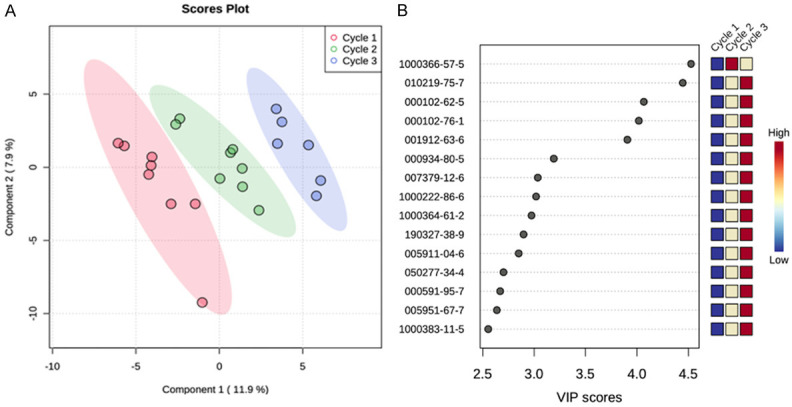
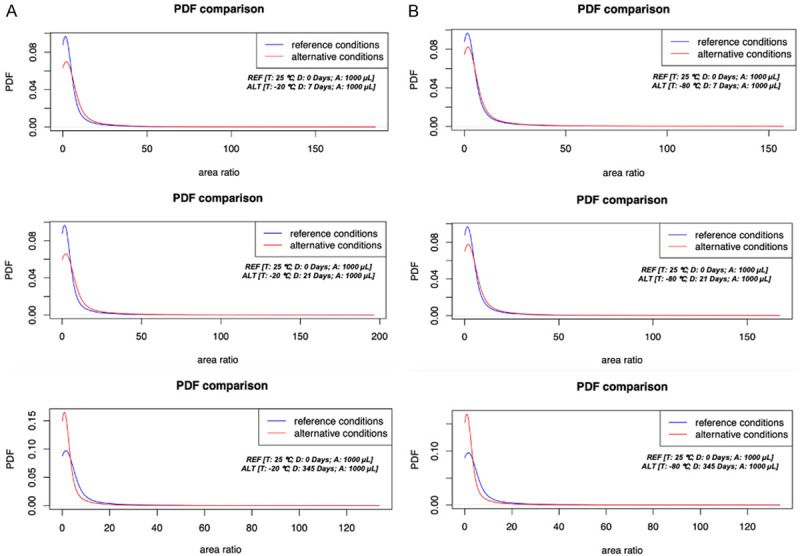
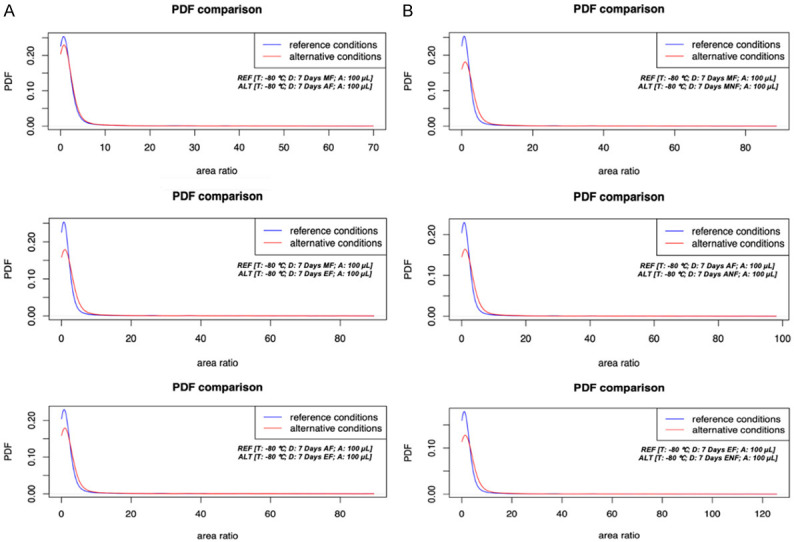
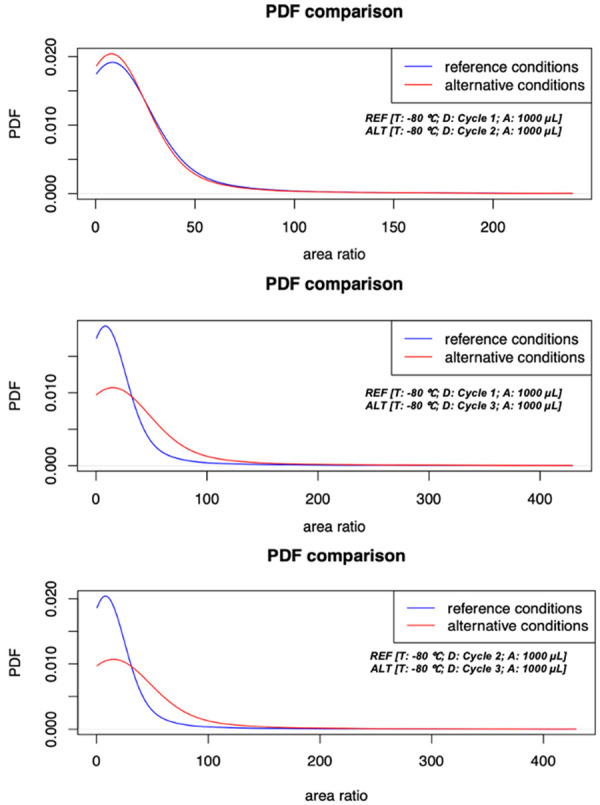
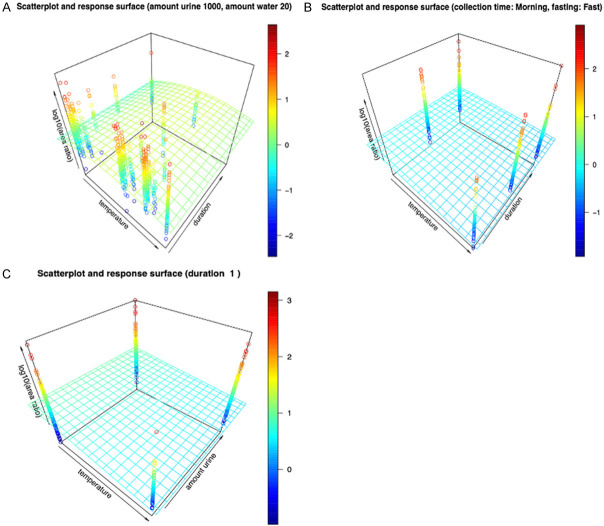
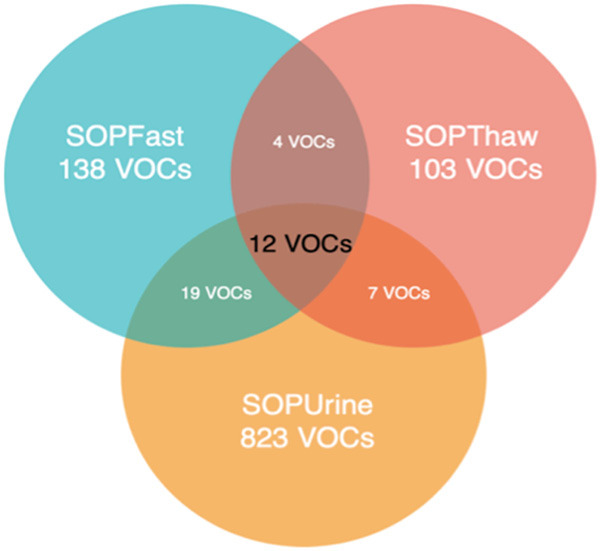
Methods: Five key variables were investigated: storage temperatures, durations, freeze-thaw cycles, sample collection conditions, and sample amounts. The analysis of VOCs involved stir bar sorptive extraction coupled with thermal desorption-gas chromatography/mass spectrometry (SBSE-TD-GC-MS), with compound identification facilitated by the National Institute of Standards and Technology Library (NIST). Extensive statistical analysis, including combined scatterplot and response surface (CSRS) plots, partial least squares-discriminant analysis (PLS-DA), and probability density function plots (PDFs), were employed to study the effects of the factors.

Results: Our findings revealed that urine storage duration, sample amount, temperature, and fasting/non-fasting sample collection did not significantly impact urinary metabolite profiles. This suggests flexibility in urine sample collection conditions, enabling individuals to contribute samples under varying circumstances. However, the influence of freeze-thaw cycles was evident, as VOC profiles exhibited distinct clustering patterns based on the number of cycles. This emphasizes the effect of freeze-thaw cycles on the integrity of urinary profiles.

Conclusions: The developed SOP integrating SBSE-TD-GC-MS and statistical analyses can serve as a valuable tool for analyzing urinary organic compounds with minimal preparation and sensitive detection. The findings also support that urinary VOCs for cancer screening and diagnosis could be a feasible alternative offering a robust, non-invasive, and sensitive approach for cancer screening.

Keywords: SBSE-GC-MS; metabolomics; standard operating procedures; urinary biomarkers; volatile organic compounds.


Conflict of interest statement

None.

Figures

Figure 1
Figure 1
Experimental design flowchart for analyzing variables of interest for all experiments. Abbreviations: SBSE-TDU, stir bar sorptive extraction-thermal desorption unit; GC-MS, gas chromatography-mass spectrometry; NIST, national institute of standards and technology; TIC, total ion chromatogram; VOC, volatile organic compound; PCA, principal component analysis; PLS-DA, partial least squares-discriminant analysis.
Scheme 1
Scheme 1
Experimental flowchart indicating storage variables of interest for all three experiments (Samples at 4°C were not stored longer than two weeks).
Figure 2
Figure 2
PLS-DA plots of the investigated storage variables and their effects on VOC profiles, and their corresponding VIP Score Plots (MetaboAnalyst). (A1) Analysis of the impact of storage temperature on VOC profiles; (A2) The top 15 VOCs contributed to generating PLS-DA SOPUrine-Temperatures VIP Score Plot; (B1) Analysis of the effect of storage duration on VOC profiles; (B2) The top 15 VOCs contributed to SOPUrine-Duration VIP Score Plot; (C1) Analysis of the impact of sample amount on VOC profiles; and (C2) The top 15 VOCs contributed to SOPUrine-Sample Amount VIP Score Plot. VIP scores were calculated and filtered by scores greater than and equal to 1, where Red indicates the highest concentration and Blue indicates the lowest concentration.
Figure 3
Figure 3
(A) PLS-DA plots of the SOPFast target variables on their effects on VOC profiles and (B) the top 15 VOCs out of 138 contributed to generating PLS-DA plots. VIP scores were calculated and filtered by scores greater than and equal to 1, where red indicates the highest concentration and blue indicates the lowest concentration.
Figure 4
Figure 4
A. PLS-DA plots of SOPThaw target variables on their effects on VOC profiles (MetaboAnalyst). B. The top 15 VOCs out of 103 contributed to generating PLS-DA plots. VIP scores were calculated and filtered by scores greater than and equal to 1; Red indicates the highest concentration and blue indicates the lowest concentration.
Figure 5
Figure 5
PDF Comparison Plots of SOPUrine to reference condition (i.e., Temperature 25°C, 0 days, and 1000 μL of urine). A. Temperature -20°C; B. Temperature -80°C [Three durations: 0, 7, 21, 345 days; performed using 1000 μL of urine]. Additional PDF comparisons were generated (data not shown) [Reference Conditions: REF; Alternative Conditions: ALT; Temperature: T; Duration: D; Sample Amount: A].
Figure 6
Figure 6
PDF Comparison Plots of SOPFast to reference condition (i.e., Temperature 25°C, 0 days, and 1000 μL of urine). A. Collection Times and Fast; B. Collection Times and No-fast [Three collection times: morning (M), afternoon (A), evening (E), and two Fast: fast (F) and no-fast (NF); performed at 100 μL]. Additional PDF comparisons were generated (data not shown) [Reference Conditions: REF; Alternative Conditions: ALT; Temperature: T; Duration: D; Sample Amount: A].
Figure 7
Figure 7
PDF Comparison Plots of SOPThaw Cycles to reference condition (i.e., Temperature 25°C, 0 days, and 1000 μL of urine) [Three freeze-thaw cycles 1-3, performed with 1000 μL urine]. [Reference Conditions: REF; Alternative Conditions: ALT; Temperature: T; Duration: D; Sample Amount: A].
Figure 8
Figure 8
Combined scatterplot and response surface for selected variables comparing all three experiments. A color spectrum is applied to area response improvements (blue [least improvement] to red [greatest improvement]). Estimated by smoothing multidimensional spline method (R-Studio). (A) SOPUrine (sample amount 1000 μL urine in 20 mL water) in response to targeted variables and area response used from a comparison in SOPFast and SOPThaw plots. (B) SOPFast (morning-fasted and sample amount 100 μL urine in 2 mL water). (C) SOPThaw response to optimal condition (freeze-thaw Cycle 1 and sample amount 1000 μL urine in 20 mL water). Three-dimensional combined scatterplot and response surface of transformed temperature (y-axis; × 2 - consecutive response in sample amount), duration (x-axis; × 3 (duration) - successive response in sample amount), and area ratio response (z-axis; (log10(area ratio)) - change from baseline) no significant improvement between (B) and (C) plots.
Figure 9
Figure 9
Venn Diagram of Cohorts Overlapping VOCs generated from PLS-DA VIP Scores.

Similar articles

Cited by

References

    1. Abate-Shen C, Shen MM. Diagnostics: the prostate-cancer metabolome. Nature. 2009;457:799–800. - PubMed
    1. Silva CL, Passos M, Câmara JS. Solid phase microextraction, mass spectrometry and metabolomic approaches for detection of potential urinary cancer biomarkers--a powerful strategy for breast cancer diagnosis. Talanta. 2012;89:360–368. - PubMed
    1. Bax C, Taverna G, Eusebio L, Sironi S, Grizzi F, Guazzoni G, Capelli L. Innovative diagnostic methods for early prostate cancer detection through urine analysis: a review. Cancers (Basel) 2018;10:123. - PMC - PubMed
    1. Srivastava A, Creek DJ. Discovery and validation of clinical biomarkers of cancer: a review combining metabolomics and proteomics. Proteomics. 2019;19:e1700448. - PubMed
    1. Sole C, Arnaiz E, Manterola L, Otaegui D, Lawrie CH. The circulating transcriptome as a source of cancer liquid biopsy biomarkers. Semin Cancer Biol. 2019;58:100–108. - PubMed

LinkOut - more resources