. 2023 Dec 12:14:1251102.
doi: 10.3389/fendo.2023.1251102. eCollection 2023.

Chronological age enhances aging phenomena and protein nitration in oocyte

Affiliations

Chronological age enhances aging phenomena and protein nitration in oocyte

Pravin T Goud et al. Front Endocrinol (Lausanne). .

Abstract

Background: The average age of childbearing has increased over the years contributing to infertility, miscarriages, and chromosomal abnormalities largely invoked by an age-related decline in oocyte quality. In this study, we investigate the role of nitric oxide (NO) insufficiency and protein nitration in oocyte chronological aging.

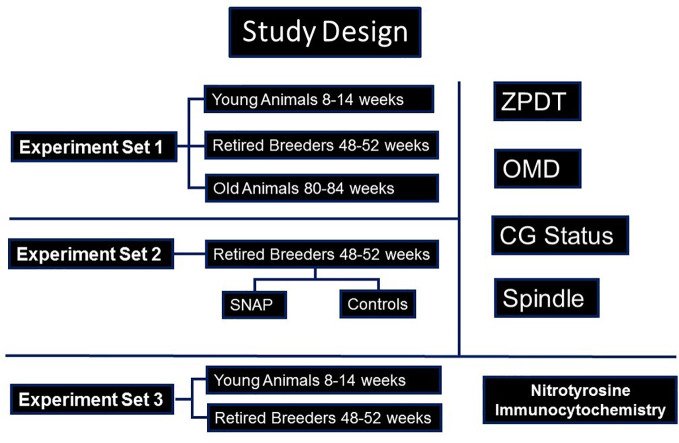
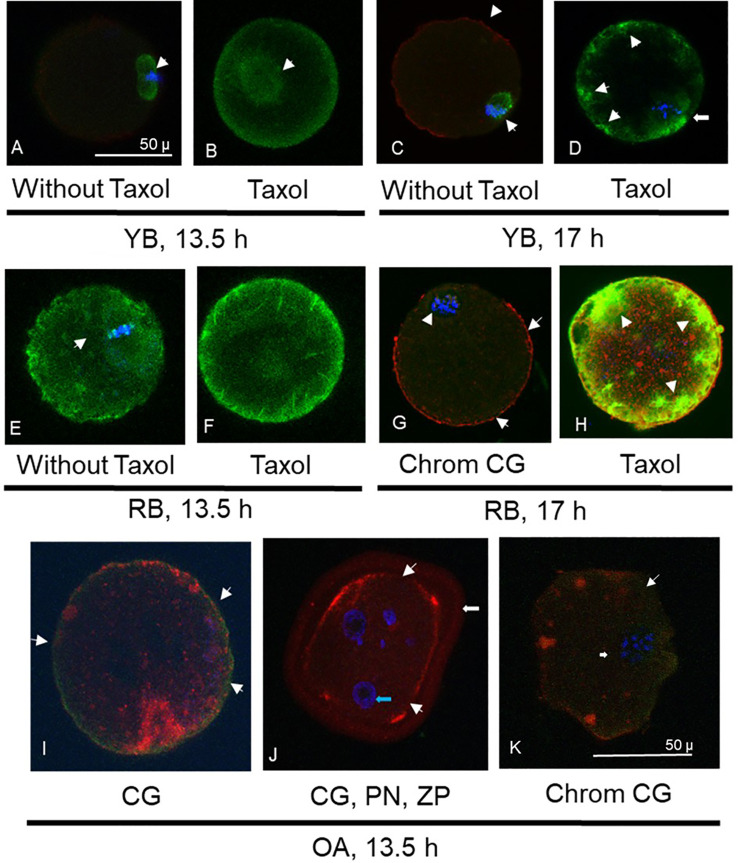
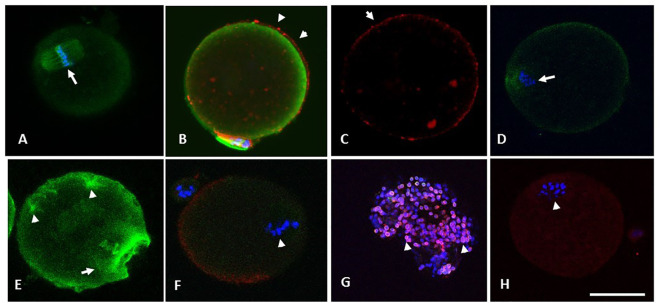
Methods: Mouse oocytes were retrieved from young breeders (YB, 8-14 weeks [w]), retired breeders (RB, 48-52w) and old animals (OA, 80-84w) at 13.5 and 17 hours after ovulation trigger. They were assessed for zona pellucida dissolution time (ZPDT); ooplasmic microtubule dynamics (OMD); cortical granule (CG) status and spindle morphology (SM), as markers of oocyte quality. Sibling oocytes from RB were exposed to NO supplementation and assessed for aging phenomena (AP). All oocyte cumulus complexes were subjected to fluorescence nitrotyrosine (NT) immunocytochemistry and confocal microscopy to assess morphology and protein nitration.

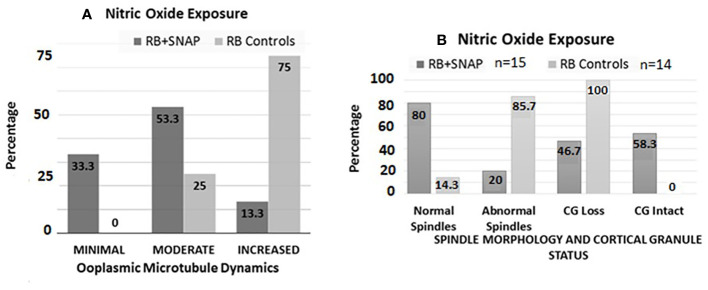
Results: At 13.5 h from hCG trigger, oocytes from RB compared to YB had significantly increased ZPDT (37.8 ± 11.9 vs 22.1 ± 4.1 seconds [s]), OMD (46.9 vs 0%), CG loss (39.4 vs 0%), and decreased normal SM (30.3 vs 81.3%), indicating premature AP that worsened among oocytes from RB at 17 hours post-hCG trigger. When exposed to SNAP, RB AP significantly decreased (ZPDT: 35.1 ± 5.5 vs 46.3 ± 8.9s, OMD: 13.3 vs 75.0% and CG loss: 50.0 vs 93.3%) and SM improved (80.0 vs 14.3%). The incidence of NT positivity was significantly higher in cumulus cells (13.5 h, 46.7 ± 4.5 vs 3.4 ± 0.7%; 17 h, 82.2 ± 2.9 vs 23.3 ± 3.6%) and oocytes (13.5 h, 57.1 vs 0%; 17 h, 100.0 vs 55.5%) from RB compared to YB. Oocytes retrieved decreased with advancing age (29.8 ± 4.1 per animal in the YB group compared to 10.2 ± 2.1 in RB and 4.0 ± 1.6 in OA). Oocytes from OA displayed increased ZPDT, major CG loss, increased OMD and spindle abnormalities, as well as pronuclear formation, confirming spontaneous meiosis to interphase transition.

Conclusions: Oocytes undergo zona pellucida hardening, altered spindle and ooplasmic microtubules, and premature cortical granule release, indicative of spontaneous meiosis-interphase transition, as a function of chronological aging. These changes are also associated with NO insufficiency and protein nitration and may be alleviated through supplementation with an NO-donor.

Keywords: advanced reproductive age; nitric oxide; oocyte aging; oocyte quality; oocyte temporal window.


Conflict of interest statement

The authors declare that the research was conducted in the absence of any commercial or financial relationships that could be construed as a potential conflict of interest.

Figures

Figure 1
Figure 1
A flow-chart is presented, depicting the study design. As shown, three sets of experiments were performed. Accordingly, in experiment set 1, oocytes from young (YB) and retired breeders (RB), as well as old animals (OA) were assessed for cortical granules (CG), Spindles and ooplasmic microtubules (OM), as well as zona pellucida dissolution time (ZPDT), a parameter to assess zona pellucida hardening. In experiment set 2, sibling oocytes retrieved from RB were subjected to an NO-donor, SNAP, or its end product, penicillamine, prior to assessing aging phenomena. In experiment set 3, oocytes and cumulus cells were subjected to fluorescence immunocytochemistry for nitrotyrosine (NT).
Figure 2
Figure 2
Photomicrographs are presented, depicting optical sections of oocytes labeled with fluorescent stains for α-tubulin (FITC conjugated, green, A-H), cortical granules (CG, rhodamine conjugated, red, C, G-K) and chromatin (Chrom, DAPI, blue, A, C-E, G-K). Photomicrographs in (A) and (B) depict spindle and ooplasmic microtubule configurations in oocytes from young breeders (YB) retrieved at 13.5 h. Arrow in (A) depicts normal microtubular spindle and chromosome metaphase plate. (B) Depicts taxol treated oocyte with enhancement of spindle microtubules (arrow) but not ooplasmic microtubules. Oocyte in (C) is from the YB group, retrieved at 17h post-hCG, depicting abnormal spindle morphology (arrow) and minimal cortical granule loss (arrowheads). In (D), oocyte from the YB group retrieved at 17 h post-hCG has spindle irregularity as well as ooplasmic microtubule enhancement (OME), indicating effect of post-ovulatory aging. Oocytes in (E, F) were retrieved from RB at 13.5 h post-hCG trigger. In (E), the abnormal spindle and OME are noted without taxol treatment, while in (F), spindle and ooplasmic microtubule enhancement is visible (arrowheads). Oocyte in (G) depicts mostly intact cortical granules with minimal loss (arrows) and abnormal chromosome metaphase is seen (arrowhead). Oocyte in (H) was retrieved at 17 h post-hCG and shows marked enhancement of ooplasmic microtubules following taxol treatment (arrowheads). Oocytes retrieved at 13.5 h post hCG in the OA group are depicted in (I-K), where major cortical granule loss is noted (arrowheads). Oocyte in (J) depicts pronuclear formation (PN, blue arrow) and undissolved zona pellucida (ZP, white arrow), indicating spontaneous oocyte activation and zona pellucida hardening. In (K), apart from major moderate cortical granule loss (arrowheads), an abnormal chromosome metaphase plate is noted (arrow). Original magnification is 600×, bar in (A) and represents 50 µm, applicable to (A-H), bar in (K) and represents 50 µm, applicable to (I-K).
Figure 3
Figure 3
Panel I (A, B) are bar charts representing categorical data presented in form of percentages. In (A), percentages of oocytes with minimal, moderate, and increased ooplasmic microtubules are presented within the oocytes in the YB and RB groups, retrieved at 13.5 and 17 h post-hCG. Significant differences in mild, moderate and increased ooplasmic microtubules were noted within the YB and RB groups with respect to post-ovulatory age (minimal and increased, YB: 13.5 vs 17 h, P<0.0001 for both respectively; increased, RB: 13.5 h vs 17 h, P=0.0002; minimal and increased, YB vs RB, 13.5 h, P<0.0001; YB 13.5 h, RB 13.5 h and RB 17 h vs OA, P<0.0001 for each respectively; Moderate: YB 13.5 h vs RB 13.5 h, P=0.0333; RB 13.5 vs 17 h, P=0.013; YB 13.5 h and 17 h vs OA, P<0.0001 for both respectively; RB 13.5 vs OA, P=0.0119). In (B), Percentages of oocytes with intact spindles and intact cortical granules decreased with post-ovulatory age in both YB and RB groups (P<0.0001 for both), and among oocytes retrieved at 13.5 h from YB, RB and OA groups respectively (P<0.0001). Panel II (A, B) are box-whiskers plots depicting zona pellucida dissolution time (ZPDT) in seconds on the Y axis, On the X axis in (A), oocyte groups are included. YB: young breeders, RB: retired breeders, OA: Old animals. A significant increase is noted in ZPDT among oocytes retrieved at 17 h compared to 13.5 h within the YB and RB (P<0.0001). Similarly, a significantly higher ZPDT is noted among RB oocytes retrieved at 13.5 h and 17 h, when compared with their corresponding subgroups (13.5 and 17 h respectively) in the YB group (P<0.0001). (C, D) depict nitrotyrosine staining in cumulus cells and oocytes from YB and RB. A significant increase in NT staining is noted among oocytes retrieved at 17 h compared to 13.5 h post hCG trigger in both YB and RB groups among oocytes from RB compared to YB oocytes at 13.5 and 17 h post hCG trigger (P<0.0001 in all).
Figure 4
Figure 4
Bar chart (A) depicts percentages of oocytes with minimal, moderate and increased microtubule dynamics after exposure to the NO donor S-Nitroso-N-acetyl-DL-penicillamine (SNAP, test groups) versus penicillamine (control group). Significantly higher numbers of oocytes with minimal (P=0.0177), and significantly decreased numbers of oocytes with increased OMD were noted in the RB group oocytes exposed to SNAP compared to controls (P=0.001). Bar chart (B) depicts the status of spindle morphology and cortical granules in RB oocytes exposed to SNAP versus controls, similar to (A). Significantly higher number of RB oocytes exposed to SNAP had normal spindle morphology compared to the control oocytes ((P=0.0007). RB oocytes exposed to SNAP also had significantly lower number of oocytes with cortical granule loss compared to the control oocytes (P=0.022).
Figure 5
Figure 5
(A) through (F) are photomicrographs showing optical sections of oocytes depicting microtubules (green), chromosomes (blue) and CG (red). Oocytes in (A) through (C) were retrieved from the RB group at 13.5 h and were treated with SNAP (100 µM, 3 hours, 37°C, 5% CO2), whereas their sibling control oocytes were exposed to penicillamine under similar conditions (D-F). Optical section (A) passes through the cortical cytoplasm depicting the spindle apparatus with normal morphology (arrowhead in A). Oocyte in (B) has minimal OMD despite treatment with Taxol. Intact CG are noted along and immediately beneath the oolemma (arrowheads in B and C). Oocyte in (D) shows a control oocyte untreated with NO-donor, with disrupted spindle and the metaphase plate. Similar control oocyte treated with taxol is depicted in (E), with significant enhancement in ooplasmic microtubules (arrowheads in E). Photomicrograph (F) depicts abnormal morphology of spindle apparatus with disruption of the chromosome metaphase plates (arrow). A moderate loss of CG was noted in the same oocyte on 3-D image reconstruction, while a CG free domain is depicted. Photomicrograph (G) is obtained from an optical section on a specimen of cumulus cells separated from a cumulus cell-oocyte complex retrieved from the RB group at 13.5 h. The cumulus cells depict the presence of nitrotyrosine (NT, red), while the nuclei are stained with DAPI (blue). Oocyte in (H) is from RB, showing the presence of positive staining for NT (arrowhead depicts abnormal metaphase). Original magnification 600×, bar in H represents 50 µm.

Similar articles

Cited by

References

    1. Cox CM, Thoma ME, Tchangalova N, Mburu G, Bornstein MJ, Johnson CL, et al. . Infertility prevalence and the methods of estimation from 1990 to 2021: a systematic review and meta-analysis. Hum Reprod Open (2022) 2022(4):hoac051. doi: 10.1093/hropen/hoac051 - DOI - PMC - PubMed
    1. Why American Women Everywhere Are Delaying Motherhood (2021). Available at: https://www.nytimes.com/2021/06/16/us/declining-birthrate-motherhood.htm....
    1. Liu K, Case A. Advanced reproductive age and fertility. J Obstet Gynaecol Can (2011) 33(11):1165–75. doi: 10.1016/S1701-2163(16)35087-3 - DOI - PubMed
    1. Eichenlaub-Ritter U. Genetics of oocyte ageing. Maturitas (1998) 30(2):143–69. doi: 10.1016/S0378-5122(98)00070-X - DOI - PubMed
    1. Faddy MJ. Follicle dynamics during ovarian ageing. Mol Cell Endocrinol (2000) 163(1-2):43–8. doi: 10.1016/S0303-7207(99)00238-5 - DOI - PubMed

Publication types