

Enhanced Electron Transfer Rates by AC Voltammetry for Ferrocenes Attached to the End of Embedded Carbon Nanofiber Nanoelectrode Arrays
- PMID: 38149103
- PMCID: PMC10750967
- DOI: 10.1002/elan.201100088
Enhanced Electron Transfer Rates by AC Voltammetry for Ferrocenes Attached to the End of Embedded Carbon Nanofiber Nanoelectrode Arrays
Abstract
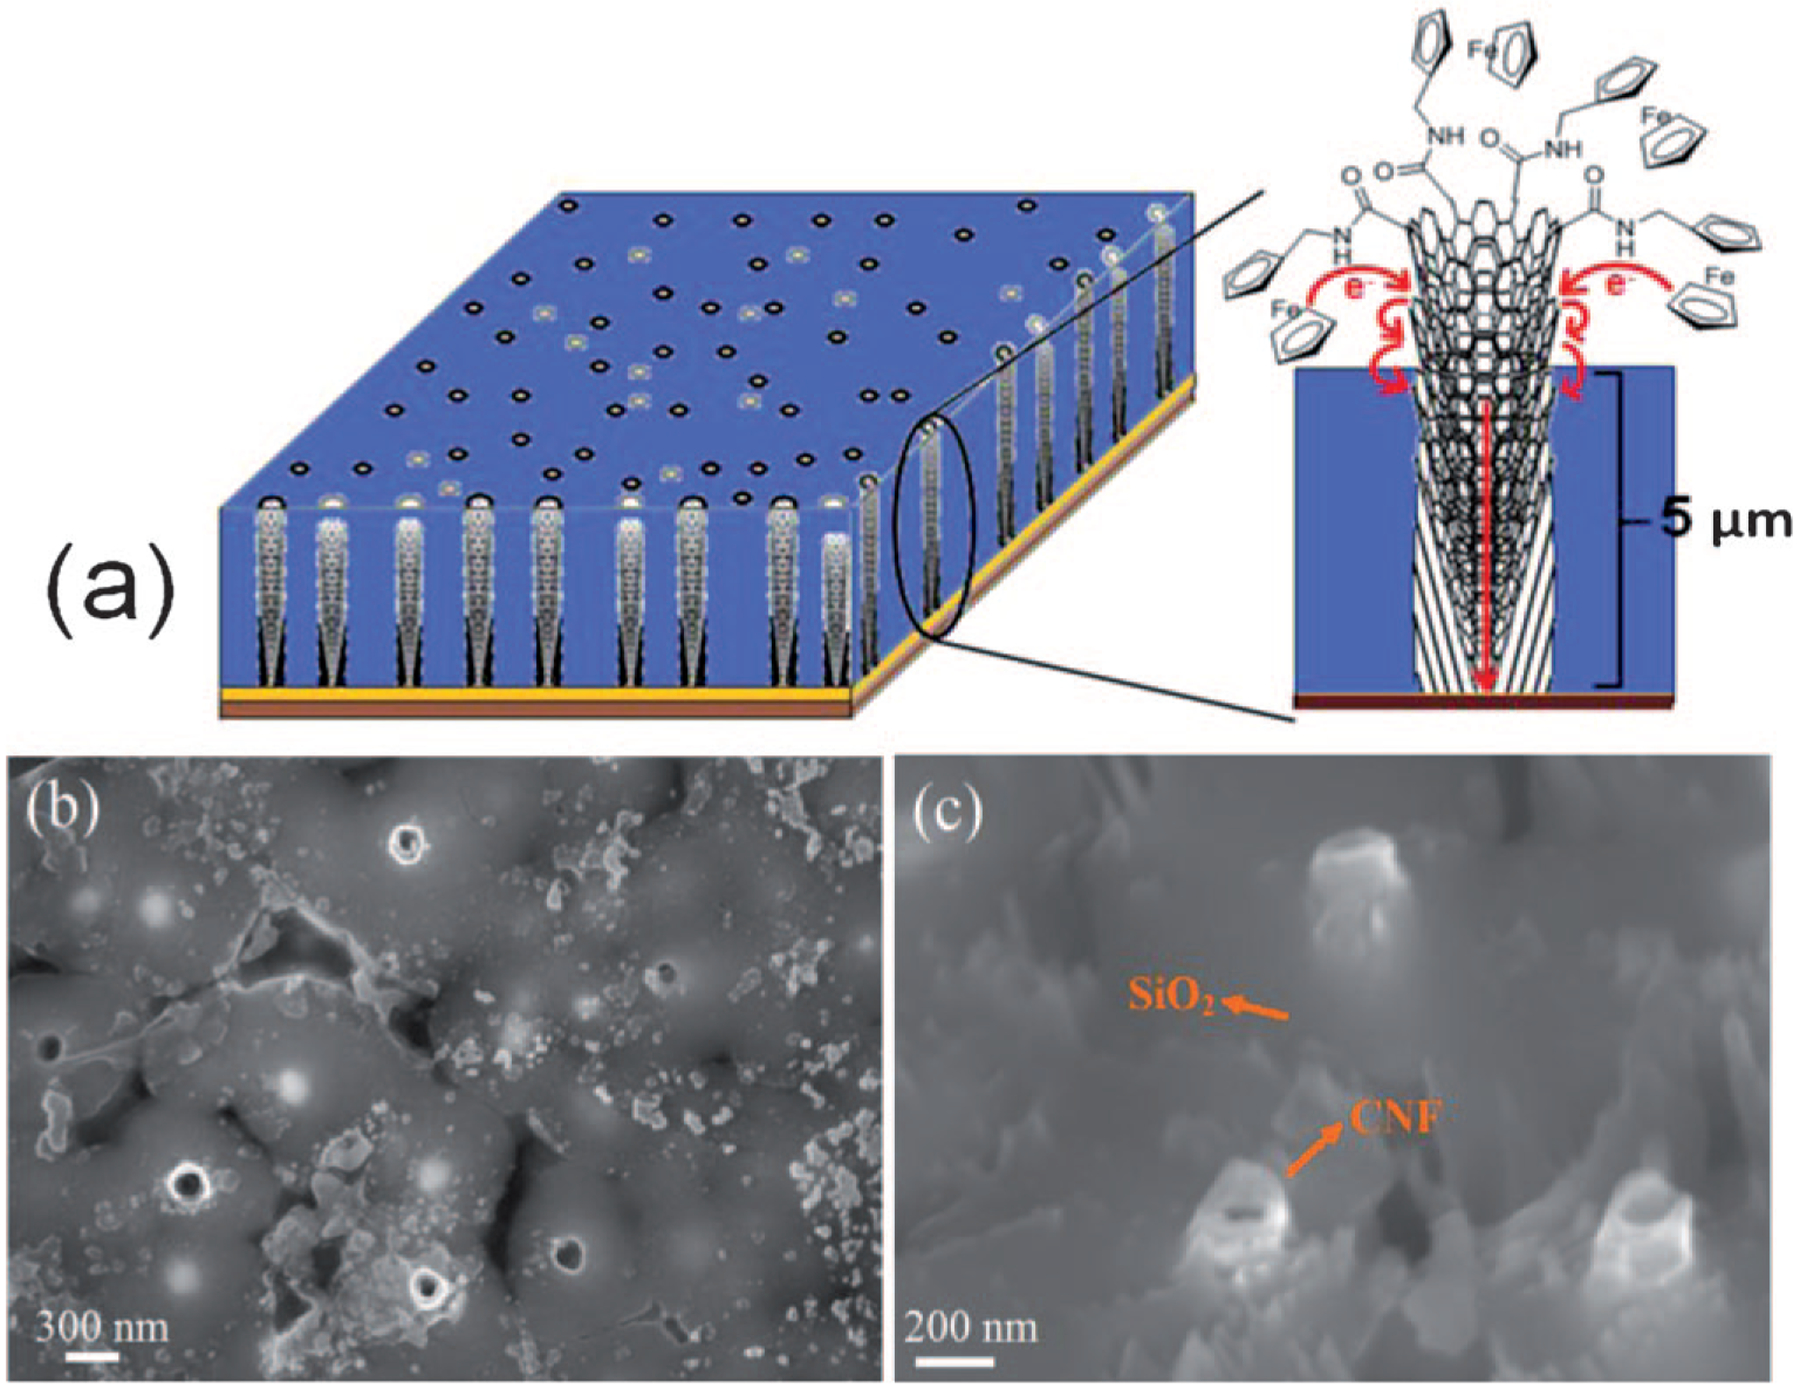
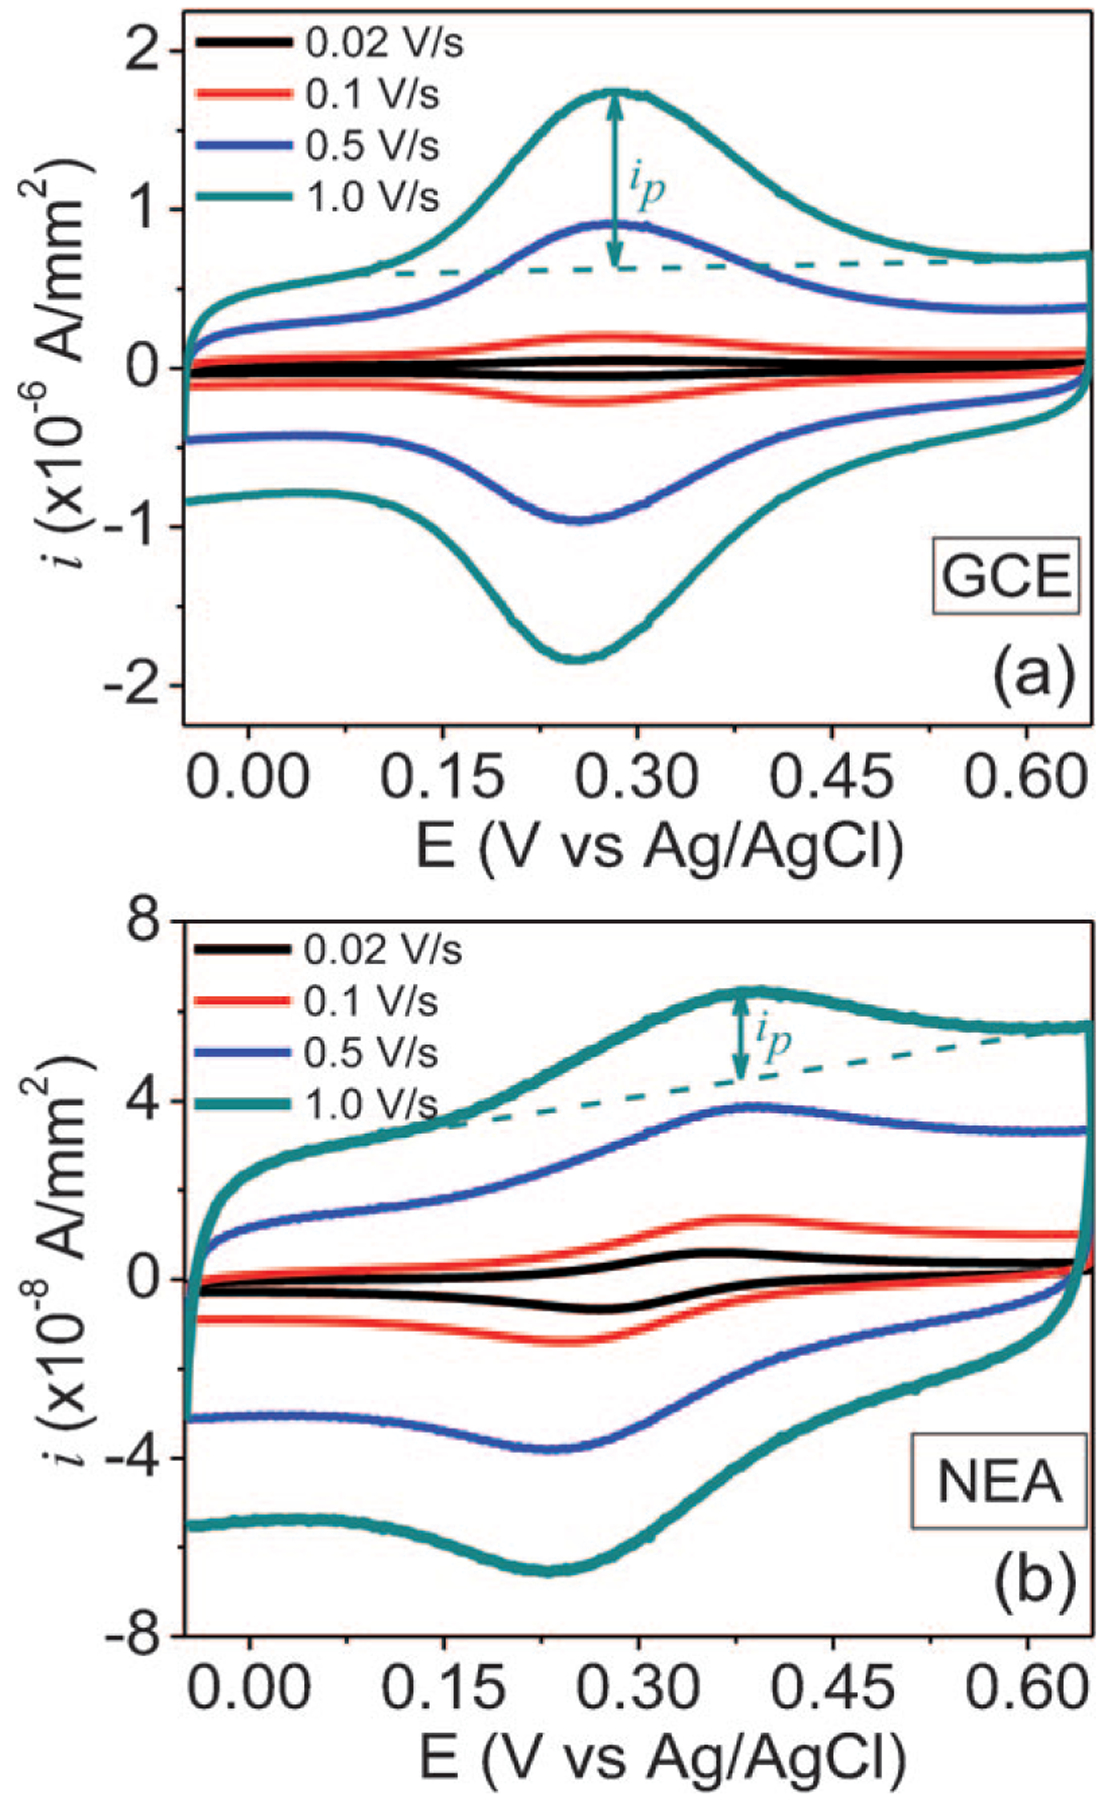
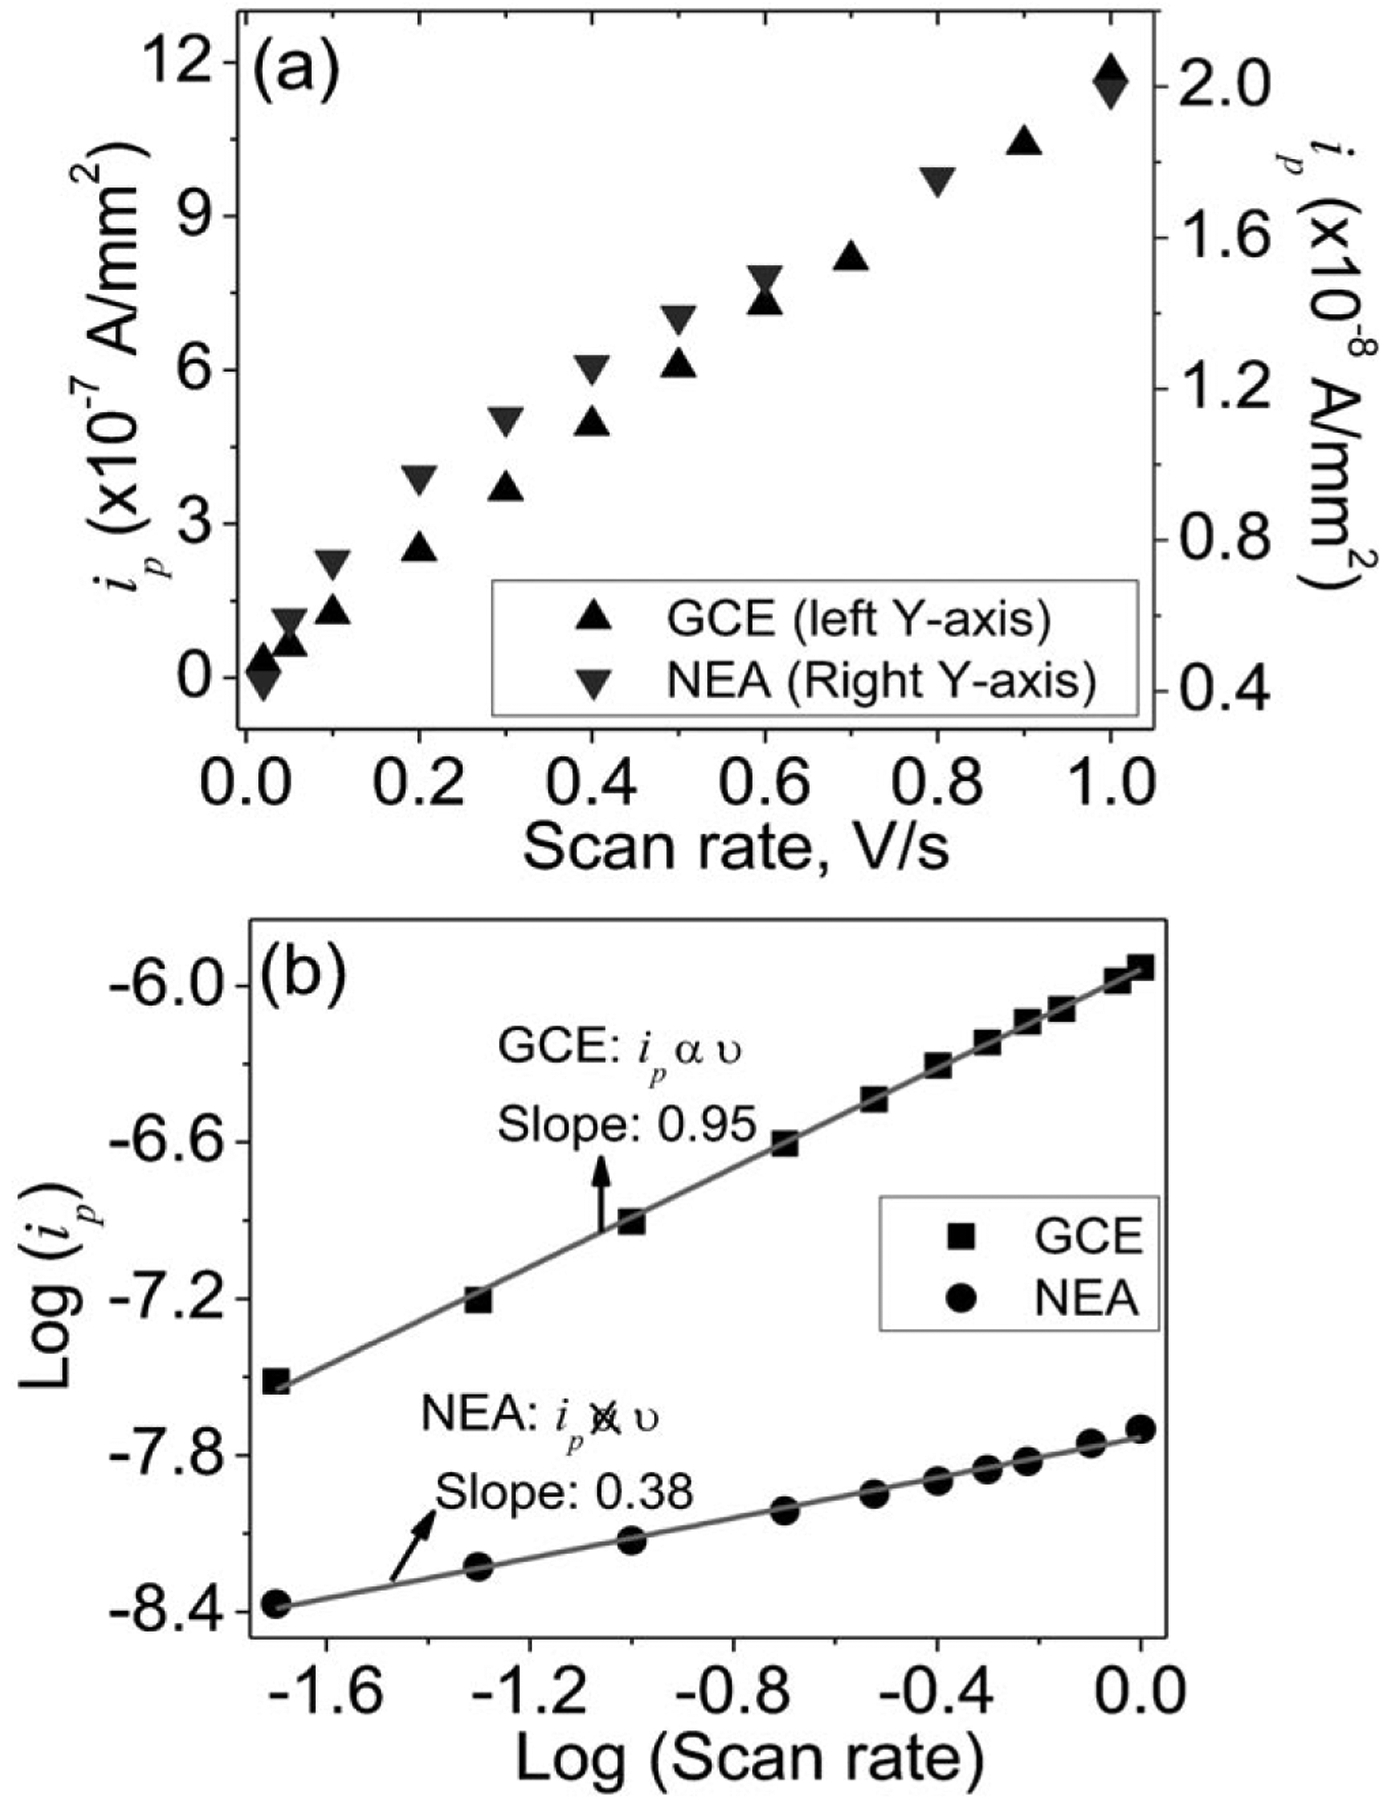
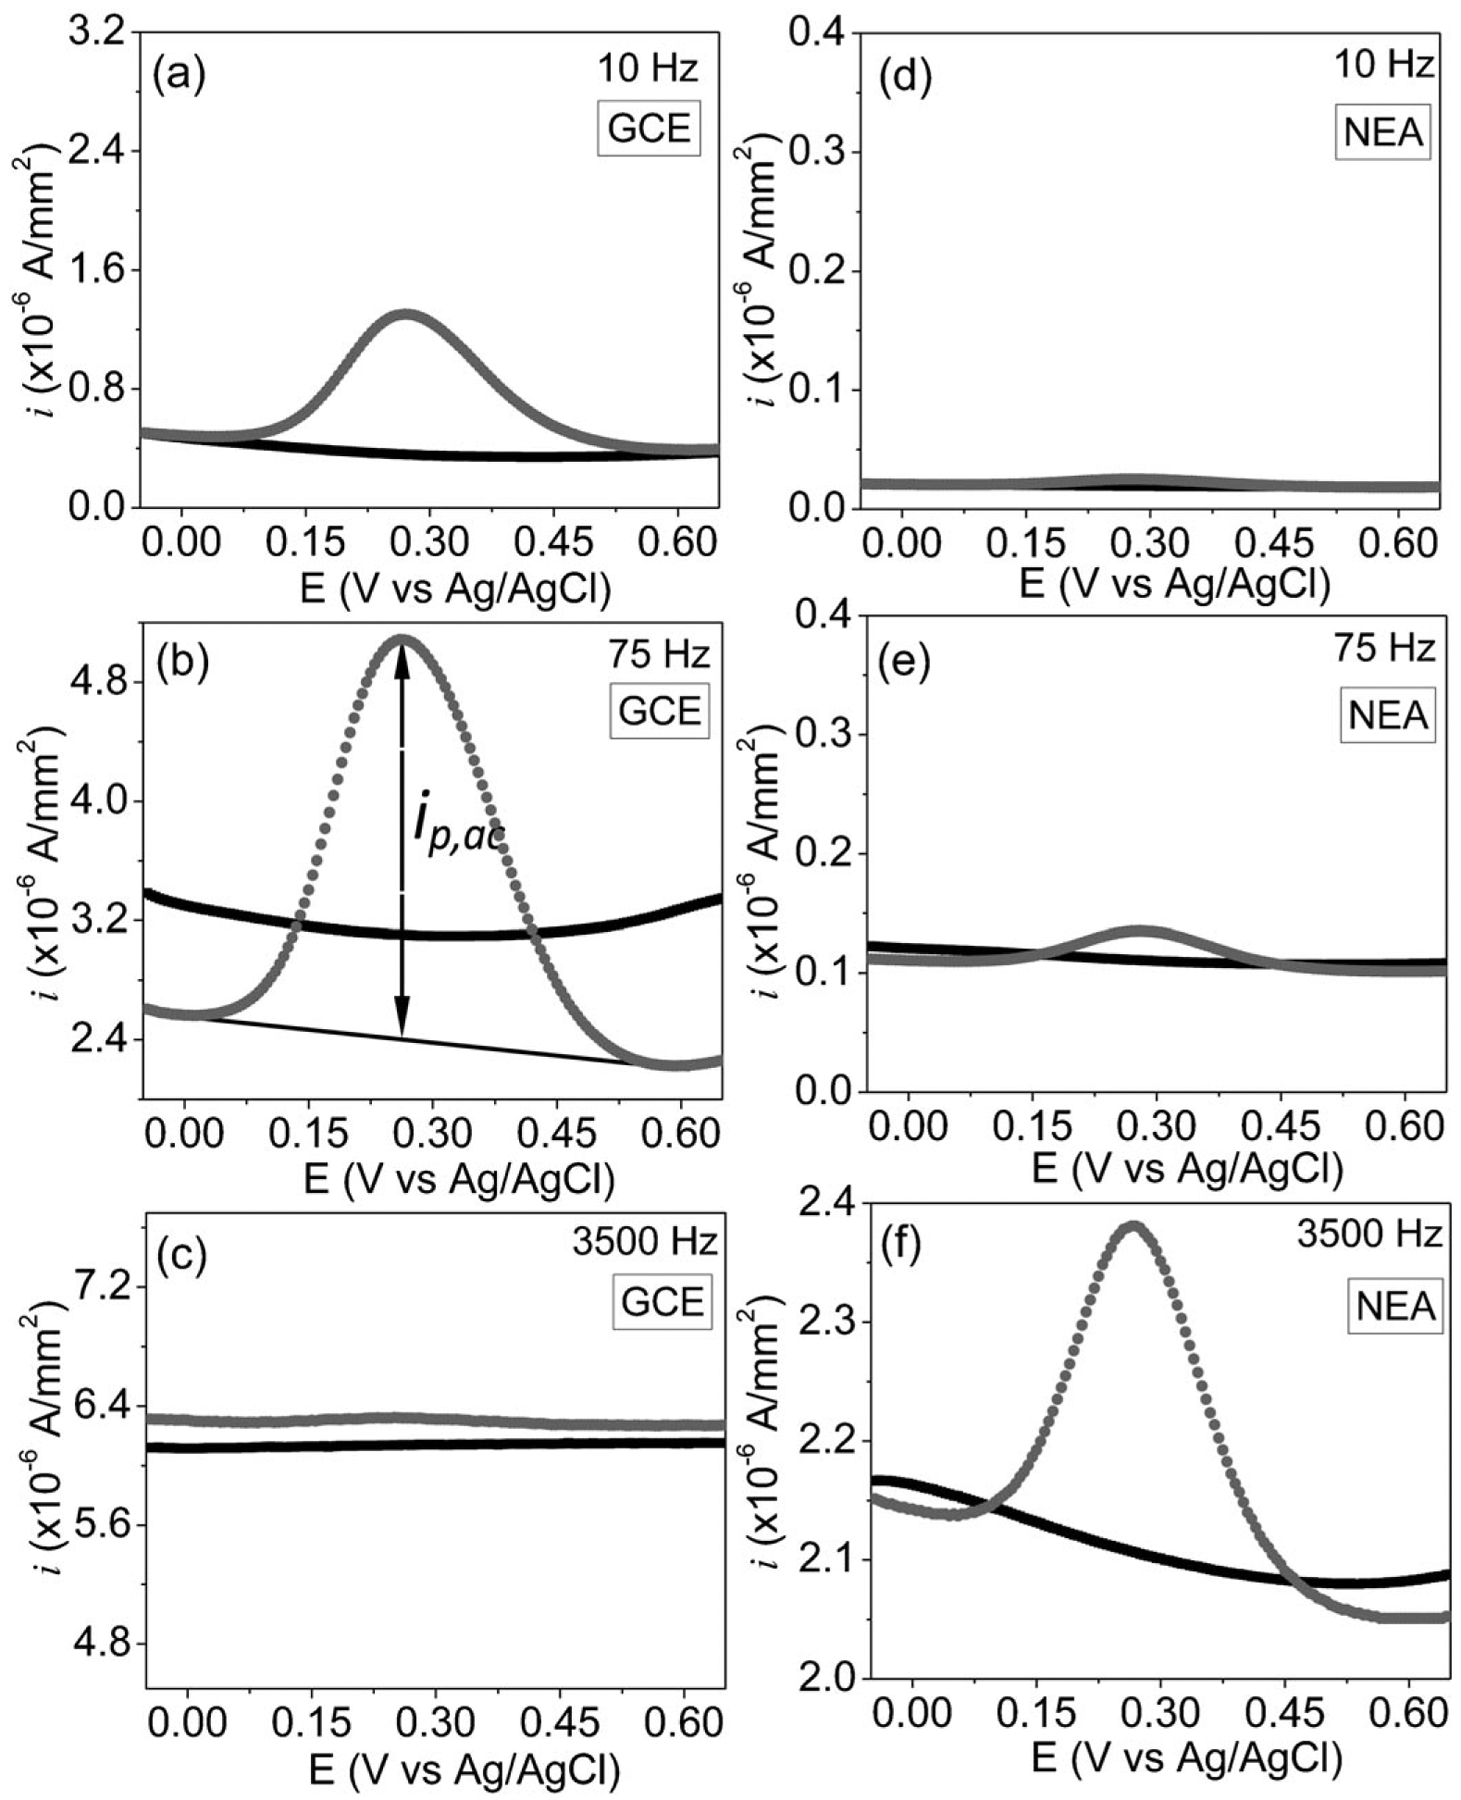
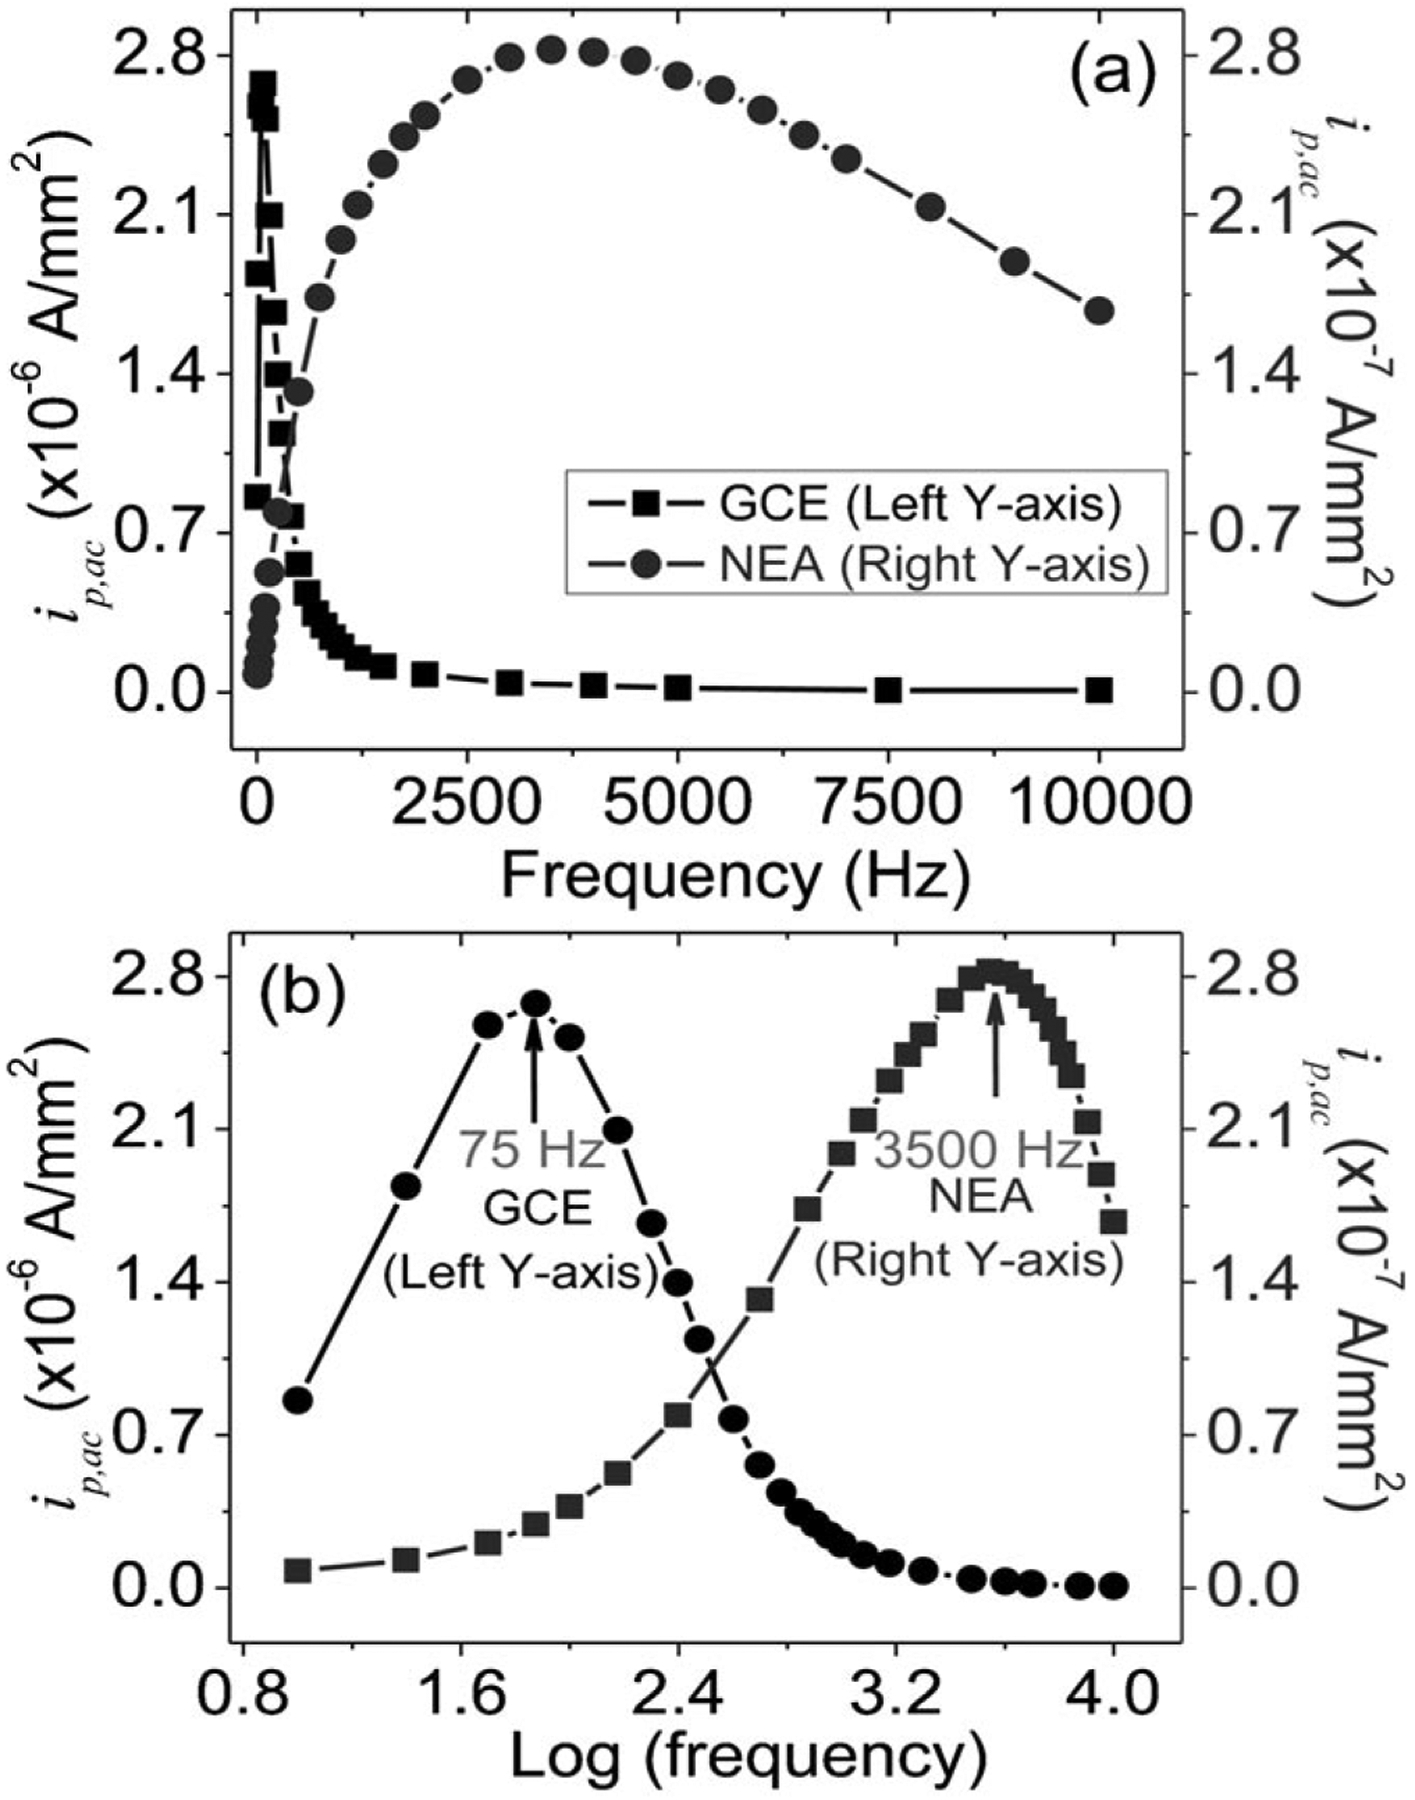
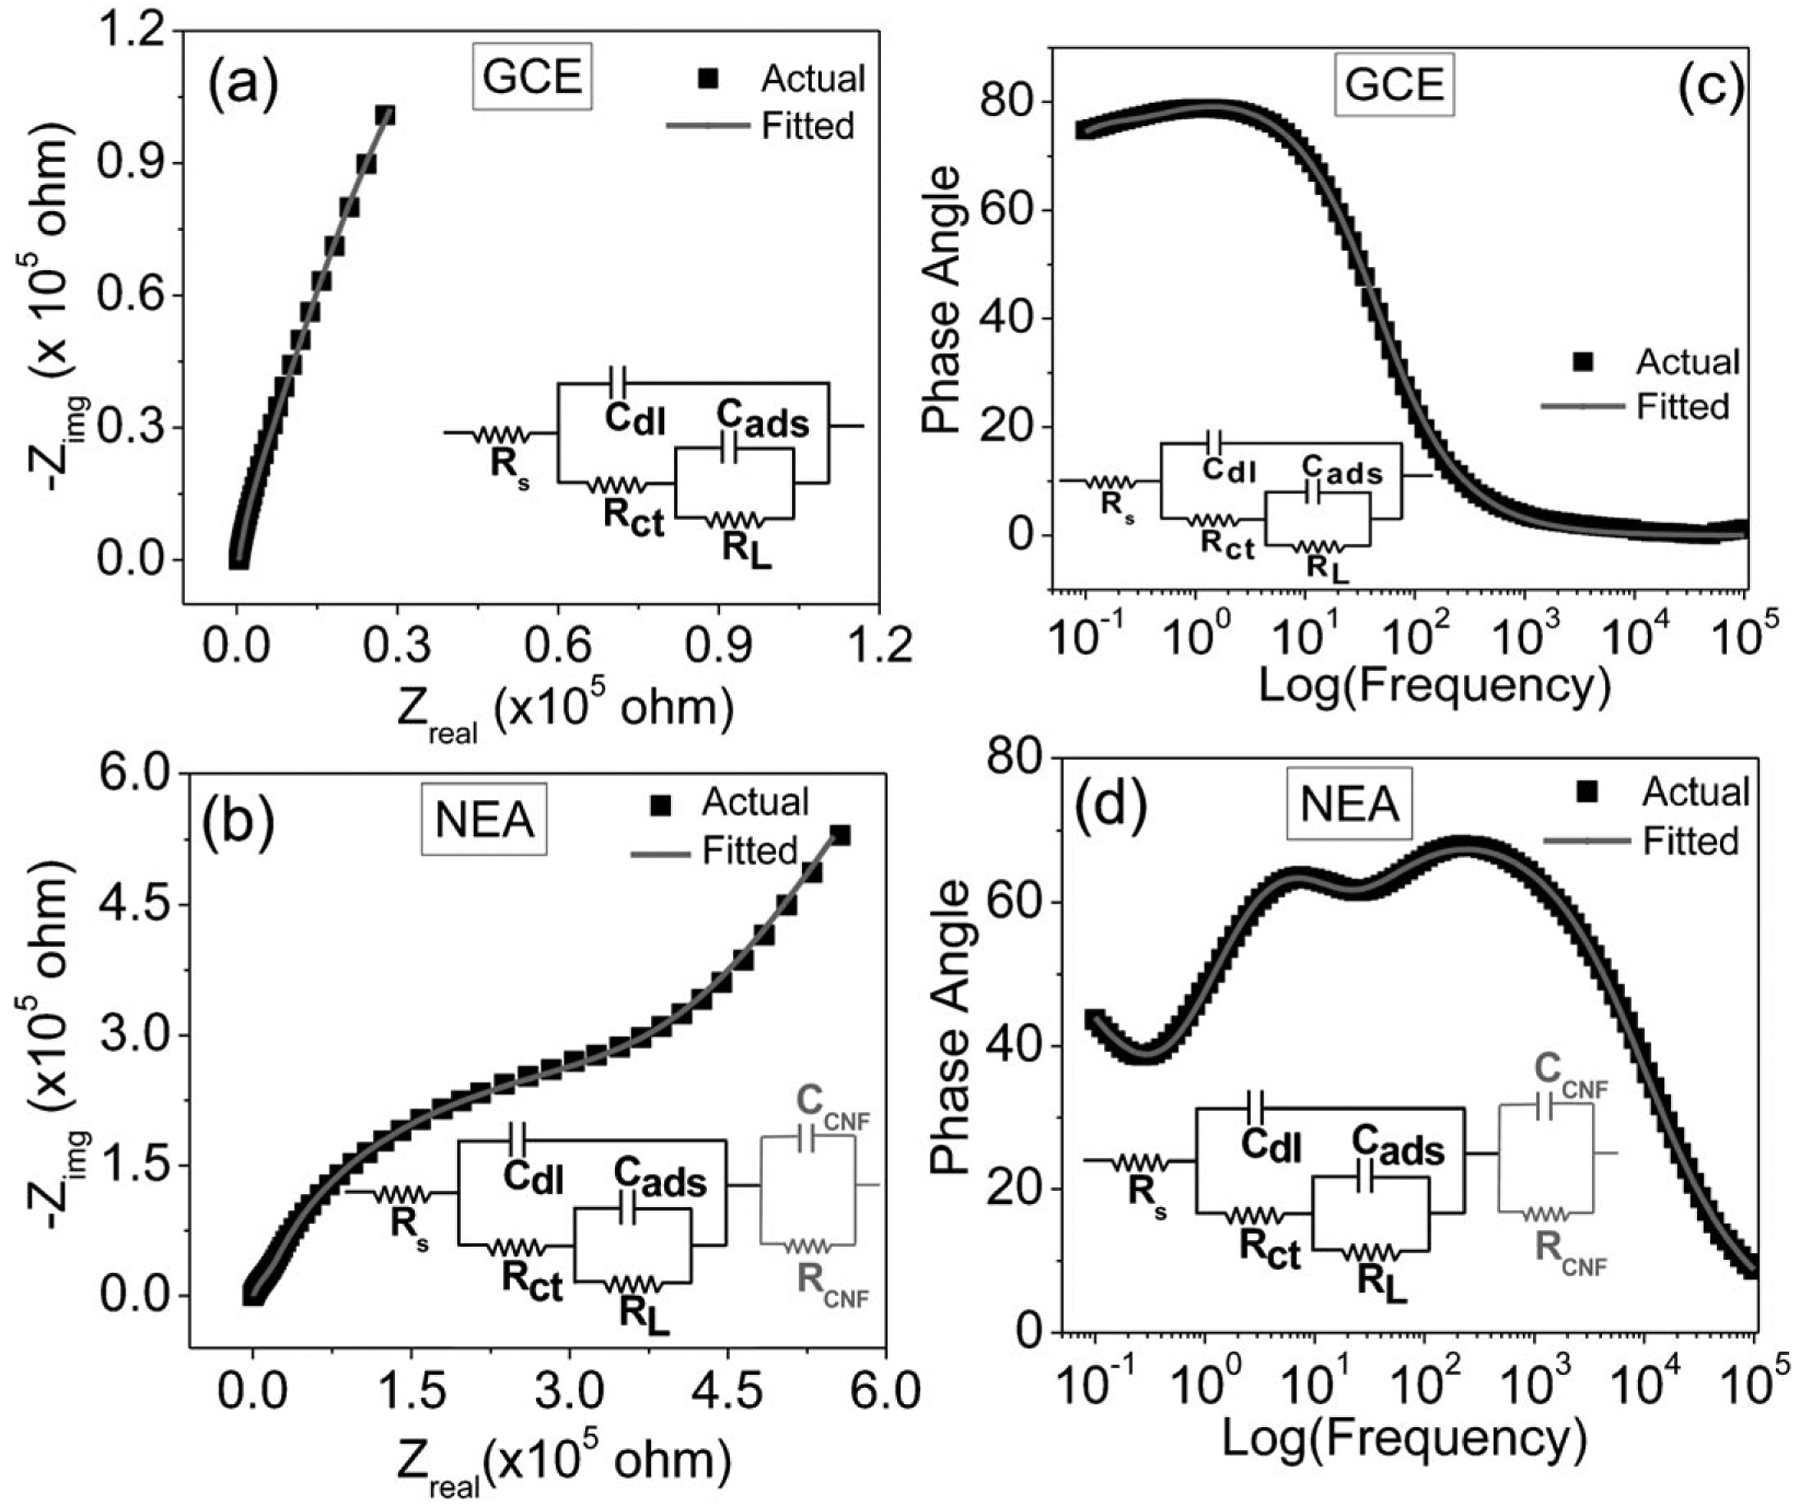
The effect of the interior structure of carbon nanomaterials on their electrochemical properties is not well understood. We report here the electron transfer rate (ETR) of ferrocene (Fc) molecules covalently attached to the exposed end of carbon nanofibers (CNFs) in an embedded nanoelectrode array. The ETR in normal DC voltammetry was found to be limited by the conical graphitic stacking structure interior of CNFs. AC voltammetry, however, can cope with this intrinsic materials property and provide over 100 times higher ETR, likely by a new capacitive pathway. This provides a new method for high-performance electroanalysis using CNF nanoelectrodes.
Keywords: Biosensors; Electron transfer rate; Microstructural electrical network; Nanoelectrode array; Vertically aligned carbon nanofibers.
Figures
Similar articles
-
Quantitative electrochemical detection of cathepsin B activity in complex tissue lysates using enhanced AC voltammetry at carbon nanofiber nanoelectrode arrays.Biosens Bioelectron. 2014 Jun 15;56:129-36. doi: 10.1016/j.bios.2014.01.002. Epub 2014 Jan 10. Biosens Bioelectron. 2014. PMID: 24480132 Free PMC article.
-
Electrochemical Protease Biosensor Based on Enhanced AC Voltammetry Using Carbon Nanofiber Nanoelectrode Arrays.J Phys Chem C Nanomater Interfaces. 2013 Feb 28;117(8):4268-4277. doi: 10.1021/jp312031u. J Phys Chem C Nanomater Interfaces. 2013. PMID: 23814632 Free PMC article.
-
Vertically aligned carbon nanofiber nanoelectrode arrays: electrochemical etching and electrode reusability.RSC Adv. 2014 May 7;4(43):22642-22650. doi: 10.1039/C4RA01779J. RSC Adv. 2014. PMID: 25089188 Free PMC article.
-
Carbon Nanofibers and Their Composites: A Review of Synthesizing, Properties and Applications.Materials (Basel). 2014 May 15;7(5):3919-3945. doi: 10.3390/ma7053919. Materials (Basel). 2014. PMID: 28788657 Free PMC article. Review.
-
Carbon Nanofiber-Based Functional Nanomaterials for Sensor Applications.Nanomaterials (Basel). 2019 Jul 22;9(7):1045. doi: 10.3390/nano9071045. Nanomaterials (Basel). 2019. PMID: 31336563 Free PMC article. Review.
Cited by
-
Quantitative electrochemical detection of cathepsin B activity in breast cancer cell lysates using carbon nanofiber nanoelectrode arrays toward identification of cancer formation.Nanomedicine. 2015 Oct;11(7):1695-704. doi: 10.1016/j.nano.2015.04.014. Epub 2015 May 8. Nanomedicine. 2015. PMID: 25959927 Free PMC article.
-
Quantitative electrochemical detection of cathepsin B activity in complex tissue lysates using enhanced AC voltammetry at carbon nanofiber nanoelectrode arrays.Biosens Bioelectron. 2014 Jun 15;56:129-36. doi: 10.1016/j.bios.2014.01.002. Epub 2014 Jan 10. Biosens Bioelectron. 2014. PMID: 24480132 Free PMC article.
-
Electrochemical Protease Biosensor Based on Enhanced AC Voltammetry Using Carbon Nanofiber Nanoelectrode Arrays.J Phys Chem C Nanomater Interfaces. 2013 Feb 28;117(8):4268-4277. doi: 10.1021/jp312031u. J Phys Chem C Nanomater Interfaces. 2013. PMID: 23814632 Free PMC article.
References
-
- Penner RM, Heben MJ, Longin LT, Lewis NS, Science 1990, 250, 1118. - PubMed
-
- Fan F-RF, Bard AJ, Science 1995, 267, 871. - PubMed
-
- Menon VP, Martin CR, Anal. Chem 1995, 67, 1920.
-
- Wei D, Bailey MJA, Andrew P, Ryhanen T, Lab Chip 2009, 9, 2123. - PubMed
-
- Lapierre-Devlin MA, Asher CL, Taft BJ, Gasparac R, Roberts MA, Kelley SO, Nano Lett. 2005, 5, 1051. - PubMed
Grants and funding
LinkOut - more resources
Full Text Sources