. 2023 Dec 8:14:1296580.
doi: 10.3389/fimmu.2023.1296580. eCollection 2023.

Cellular and transcriptome signatures unveiled by single-cell RNA-Seq following ex vivo infection of murine splenocytes with Borrelia burgdorferi

Affiliations

Cellular and transcriptome signatures unveiled by single-cell RNA-Seq following ex vivo infection of murine splenocytes with Borrelia burgdorferi

Venkatesh Kumaresan et al. Front Immunol. .

Abstract

Introduction: Lyme disease, the most common tick-borne infectious disease in the US, is caused by a spirochetal pathogen Borrelia burgdorferi (Bb). Distinct host responses are observed in susceptible and resistant strains of inbred of mice following infection with Bb reflecting a subset of inflammatory responses observed in human Lyme disease. The advent of post-genomic methodologies and genomic data sets enables dissecting the host responses to advance therapeutic options for limiting the pathogen transmission and/or treatment of Lyme disease.

Methods: In this study, we used single-cell RNA-Seq analysis in conjunction with mouse genomics exploiting GFP-expressing Bb to sort GFP+ splenocytes and GFP- bystander cells to uncover novel molecular and cellular signatures that contribute to early stages of immune responses against Bb.

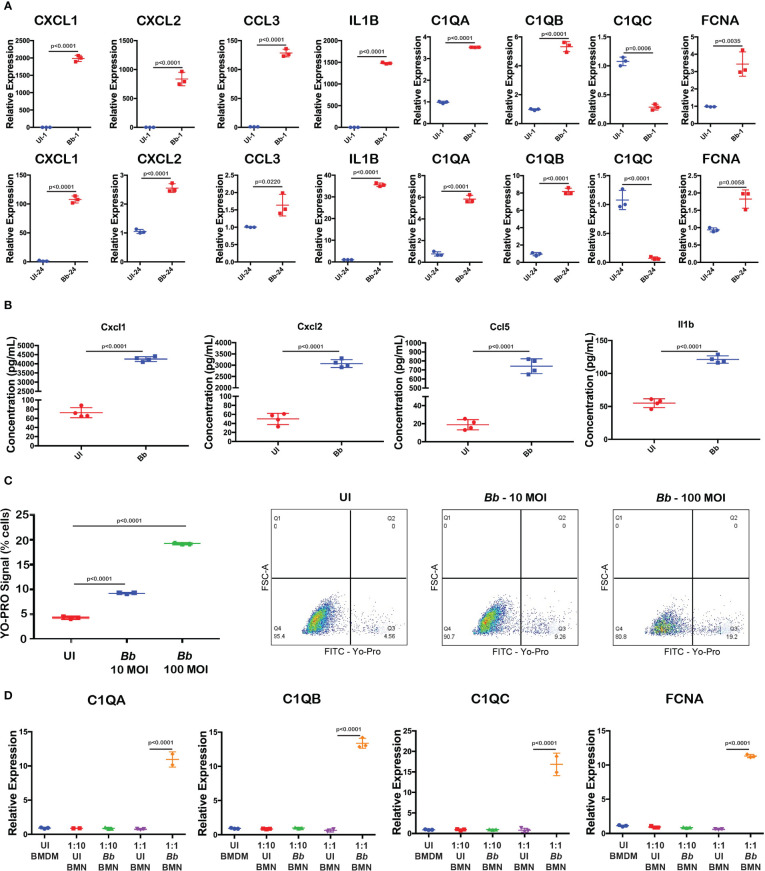
Results: These data decoded the heterogeneity of splenic neutrophils, macrophages, NK cells, B cells, and T cells in C3H/HeN mice in response to Bb infection. Increased mRNA abundance of apoptosis-related genes was observed in neutrophils and macrophages clustered from GFP+ splenocytes. Moreover, complement-mediated phagocytosis-related genes such as C1q and Ficolin were elevated in an inflammatory macrophage subset, suggesting upregulation of these genes during the interaction of macrophages with Bb-infected neutrophils. In addition, the role of DUSP1 in regulating the expression of Casp3 and pro-inflammatory cytokines Cxcl1, Cxcl2, Il1b, and Ccl5 in Bb-infected neutrophils were identified.

Discussion: These findings serve as a growing catalog of cell phenotypes/biomarkers among murine splenocytes that can be exploited for limiting spirochetal burden to limit the transmission of the agent of Lyme disease to humans via reservoir hosts.

Keywords: complement; cytokines; lyme disease; myeloid immune response; neutrophil apoptosis; single-cell RNA-Seq.


Conflict of interest statement

The authors declare that the research was conducted in the absence of any commercial or financial relationships that could be construed as a potential conflict of interest. The author(s) declared that they were an editorial board member of Frontiers, at the time of submission. This had no impact on the peer review process and the final decision.

Figures

Figure 1
Figure 1
Infection of splenocytes with GFP+ Bb. (A) Overview of the study, (B) flow cytometry analysis of splenocytes infected with GFP+Bb. Total splenocytes were screened for single cells and further subjected to Live/Dead stain analysis, where APChi indicates dead cells, while APC-indicate live cells. Live, FITChi cells were designated as GFP+ (Bb infected cells), and FITCneg cells were categorized as GFP− (bystander cells).
Figure 2
Figure 2
Cell cluster analysis of total splenocytes. Barcodes obtained from Bb-infected and bystander splenocytes from two experiments were integrated together to identify the cell clusters. (A) tSNE plot showing 28 cell clusters among the total splenocytes, (B) annotated clusters of total splenocytes, (C) expression of cell-specific marker genes in total splenocytes, (D) heatmap of DEGs between the overall 28 clusters. Scale represents the differential expression of genes (upregulated—red, downregulated—blue) as log2 fold changes where the cluster numbers are mentioned on the top of each column and the gene names at the right of each row. Violin plots showing the Log2 expression level of TLR2 gene (E) in overall 28 clusters, and (F) in Ly6G+ barcodes compared between Bb-infected and bystander.
Figure 3
Figure 3
Cell cluster analysis of neutrophils. Barcodes filtered for PTPRC+ CD11b+ Ly6G+ were defined as neutrophils. (A) tSNE plot of neutrophils showing four clusters marked as C1, C2, C3, and C4. (B) Violin plots showing the log2 expression and cellular distribution of the selected neutrophil specific marker genes, and the gene names are mentioned at the top of each plot. (C) Heatmap showing the DEGs among the four clusters of neutrophils, and the putative names of each cluster were mentioned over the respective blocks. (D) Violin plots showing the log2 expression and cellular distribution of the selected cluster-specific genes.
Figure 4
Figure 4
Comparison of the infected and bystander neutrophil clusters. (A) tSNE plot of Bb-infected and bystander neutrophils showing four clusters. (B) The violin plots showing the log2 expression (height) and cellular distribution (width) of the selected DEGs compared between the Bb-infected and bystander in each neutrophil cluster. (C) STRING-protein network showing the interaction of the selected DEGs identified from the Bb-infected cluster 3 neutrophils. (D) Bar graph showing the functional pathways enriched within the identified DEGs from the Bb-infected cluster 3 neutrophils, where each bar represents the number of genes enriched in each pathway. Colors of each circle (C) and bar (D) represent the corresponding functional pathway of each gene.
Figure 5
Figure 5
Bb induce pro-inflammatory cytokines and apoptosis in BMNs. (A) Gene expression analysis of selected genes using qRT-PCR analysis comparing uninfected and Bb-infected BMNs at 1,16, and 24 hpi represented as relative folds compared to the uninfected neutrophils at 1 hpi, (B) schematic representation of the gating used to determine the FITC (YO-PRO)-positive cells. (C) Percentage of cells positive for YO-PRO signals in BMNs infected with Bb (10 MOI) and Bb (100 MOI) compared to the uninfected control. (D) Histogram showing the pattern of YO-PRO signal in uninfected BMNs and BMNs treated with 0.1, 1, and 10 µg of BbLp and infected with Bb at 100 MOI, determined at 1 hpi (left) and 24 hpi (right). (E) Graph showing the distribution of FSC-lo, FSC-hi, and FSC-SSC-hi populations in BMNs during Bb infection with or without BCI treatment. (F) BMNs treated with or without BCI were infected with Bb and stained with YO-PRO, and flow cytometry analysis was performed. Graph showing the FITC-lo and FITC-hi population in BCI-treated or untreated BMNs with or without infection. (G) Dot plot showing the distribution of FSC-lo, FSC-hi, and FSC-SSC-hi populations in BMNs. (H) Histogram showing the FITC-lo and FITC-hi levels in BMNs. (I) Gene expression analysis of selected pro-inflammatory cytokines using qRT-PCR comparing uninfected and Bb-infected BMNs at 1 hpi, 16 hpi, and 24 hpi represented as relative folds compared to the uninfected neutrophils at 1 hpi. (J) Levels of cytokines Cxcl1, Cxcl2, Ccl5, and Il1b were determined by ELISA from the culture supernatant of BMNs infected with Bb (100 MOI) with or without BCI inhibitor treatment. BMNs infected with Bb at 100 MOI were stained with YO-PRO stain at 1 and 24 hpi, flow cytometry analysis was performed, and the signals were recorded using FITC channel. All qRT-PCR experiments were performed independently twice, and the data displayed are representative of one experiment showing the average values of at least three technical replicates. Data from second experiment are presented in Supplementary Figure S4 . Error bar represents the standard deviation between the technical replicates. The p-values in each graph represents the significance of differences between the Bb-infected and bystander populations.
Figure 6
Figure 6
Cell cluster analysis of macrophages. Cells filtered for PTPRC+ ITGAM+ CSF1R+ were annotated as macrophages. (A) tSNE plot of macrophages showing five clusters marked as C1, C2, C3, C4, and C5. (B) Violin plots showing the log2 expression and cellular distribution of the macrophage-specific marker genes, and the gene names are mentioned at the top of each plot. Uniform expression of CSF1R and ITGAM genes in both infected (Bb) and bystander (UI) populations of each cluster. (C) Heatmap showing the DEGs among the four clusters of macrophages, and the putative names of each cluster were mentioned over the respective blocks. (D) Violin plots showing the log2 expression and cellular distribution of the selected cluster-specific genes between the infected (Bb) and bystander (UI) populations in each cluster.
Figure 7
Figure 7
Comparison of the infected and bystander macrophages clusters. Violin plots showing the log2 expression and cellular distribution of the selected DEGs compared between the infected (Bb) and bystander (UI) in (A) cluster 3 macrophages. (B) Cxcl2 in cluster 1 and Cxcl1 in cluster 2. STRING-protein network of upregulated genes identified from the Bb infected cluster 3 macrophages, showing the (C) functional pathways enriched where each bar indicates the number of identified genes involved in each pathway and (D) protein–protein interaction map, where colors in the spheres corresponds to the bar (C) representing the functional pathway.
Figure 8
Figure 8
Validation of Bb-induced gene modulation in BMNs. (A) Gene expression analysis of selected complement and cytokine encoding genes using qRT-PCR analysis comparing uninfected and Bb-infected BMDMs at 1 and 24 hpi. (B) Levels of cytokines Cxcl1, Cxcl2, Ccl5, and Il1b were determined by ELISA from the culture supernatant of BMDM with or without Bb infection. (C) Percentage of cells positive for YO-PRO signals in BMNs infected with Bb (10 MOI) and Bb (100 MOI) compared to the uninfected control. In Dot-Plots, Q3 represents YO-PROhi cells, and Q4 represents YO-PRO cells, and the values in each quadrant represent the percentage of cells. (D) Gene expression analysis of complement genes in BMDMs co-cultured with Bb-infected BMNs at two different ratios of BMN:BMDM—1:10 and 1:1. All qRT-PCR experiments were performed independently twice, and the data displayed are representative of one experiment showing the average values of at least three technical replicates. Data from second experiment are presented in Supplementary Figures 5 , 6 . Error bar represents the standard deviation between the technical replicates. The p-values in each graph represents the significance of differences between the Bb-infected and bystander populations.
Figure 9
Figure 9
Cell cluster analysis of B cells. Cells filtered for PTPRC+ CD19+ were annotated as B cells. (A) tSNE plot of B cells showing 10 clusters marked as C1–C10. (B) Heatmap showing the DEGs among the 10 clusters of B cells, and the putative names of each cluster were mentioned over the respective blocks. (C) Violin plots showing the log2 expression and cellular distribution of the selected cluster-specific genes.
Figure 10
Figure 10
Cell cluster analysis of T cells. Cells filtered for PTPRC+ CD3e+ were annotated as T cells. (A) tSNE plot of B cells showing seven clusters marked as C1–C7. (B) Heatmap showing the DEGs among the seven clusters of T cells, and the putative names of each cluster were mentioned over the respective blocks. (C) Violin plots showing the log2 expression and cellular distribution of CD4 and CD8a genes and other selected cluster-specific genes.

Similar articles

Cited by

References

    1. Kugeler KJ, Schwartz AM, Delorey MJ, Mead PS, Hinckley AF. Estimating the frequency of lyme disease diagnoses, United States, 2010-2018. Emerg Infect Dis (2021) 27(2):616–9. doi: 10.3201/eid2702.202731 - DOI - PMC - PubMed
    1. Radolf JD, Caimano MJ, Stevenson B, Hu LT. Of ticks, mice and men: understanding the dual-host lifestyle of Lyme disease spirochaetes. Nat Rev Microbiol (2012) 10(2):87–99. doi: 10.1038/nrmicro2714 - DOI - PMC - PubMed
    1. Steere AC, Coburn J, Glickstein L. The emergence of Lyme disease. J Clin Invest (2004) 113(8):1093–101. doi: 10.1172/JCI21681 - DOI - PMC - PubMed
    1. Radolf JD, Strle K, Lemieux JE, Strle F. Lyme disease in humans. Curr Issues Mol Biol (2021) 42:333–84. doi: 10.21775/cimb.042.333 - DOI - PMC - PubMed
    1. Bockenstedt LK, Gonzalez DG, Haberman AM, Belperron AA. Spirochete antigens persist near cartilage after murine Lyme borreliosis therapy. J Clin Invest (2012) 122(7):2652–60. doi: 10.1172/JCI58813 - DOI - PMC - PubMed

Publication types