. 2024 Jan 1;17(1):dmm050211.
doi: 10.1242/dmm.050211. Epub 2024 Jan 25.

Conditional in vivo deletion of LYN kinase has little effect on a BRCA1 loss-of-function-associated mammary tumour model

Affiliations

Conditional in vivo deletion of LYN kinase has little effect on a BRCA1 loss-of-function-associated mammary tumour model

Giusy Tornillo et al. Dis Model Mech. .

Abstract

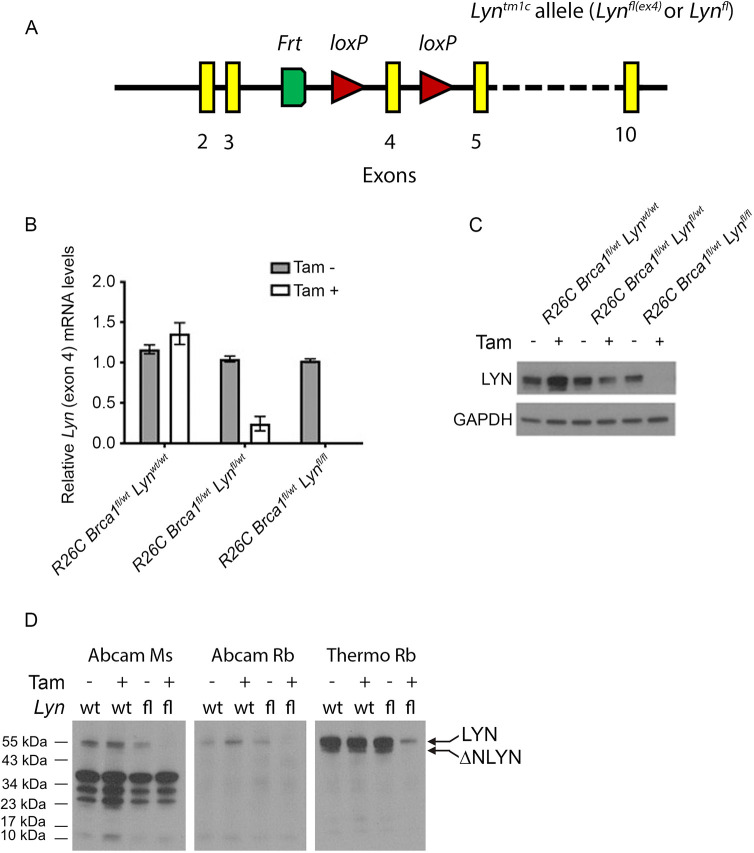
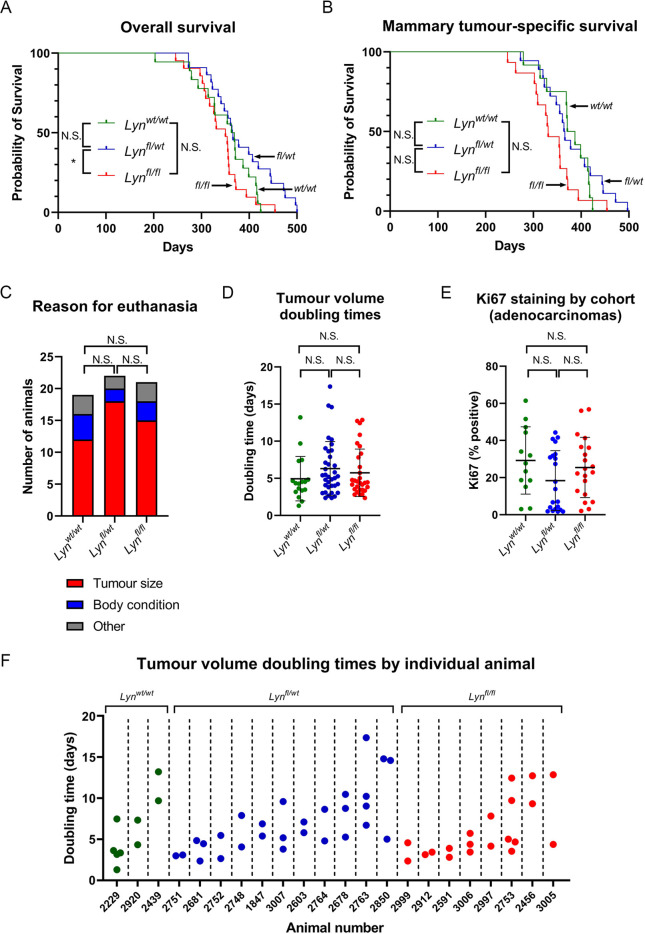
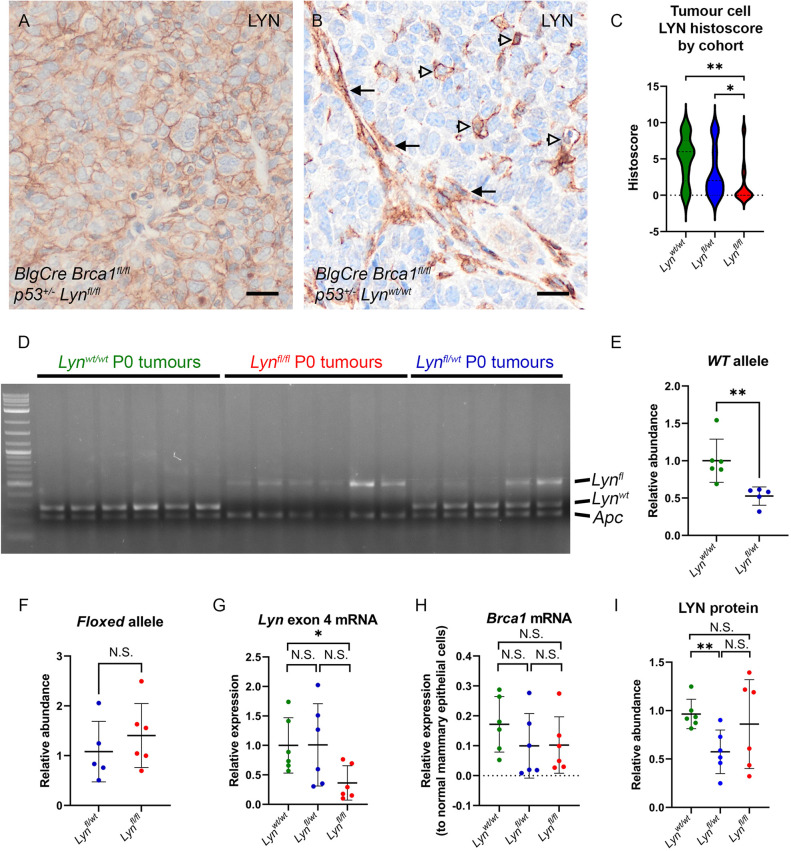
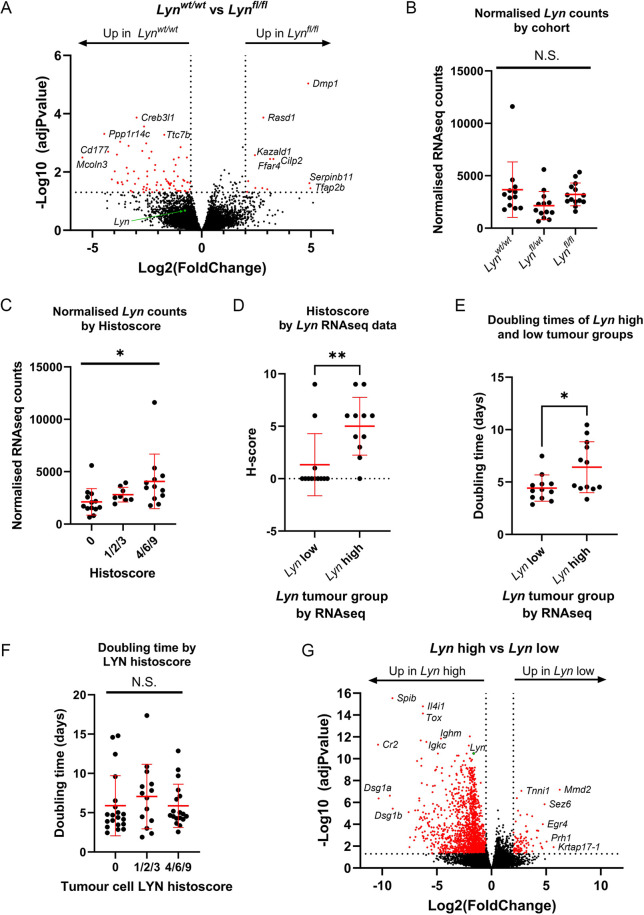
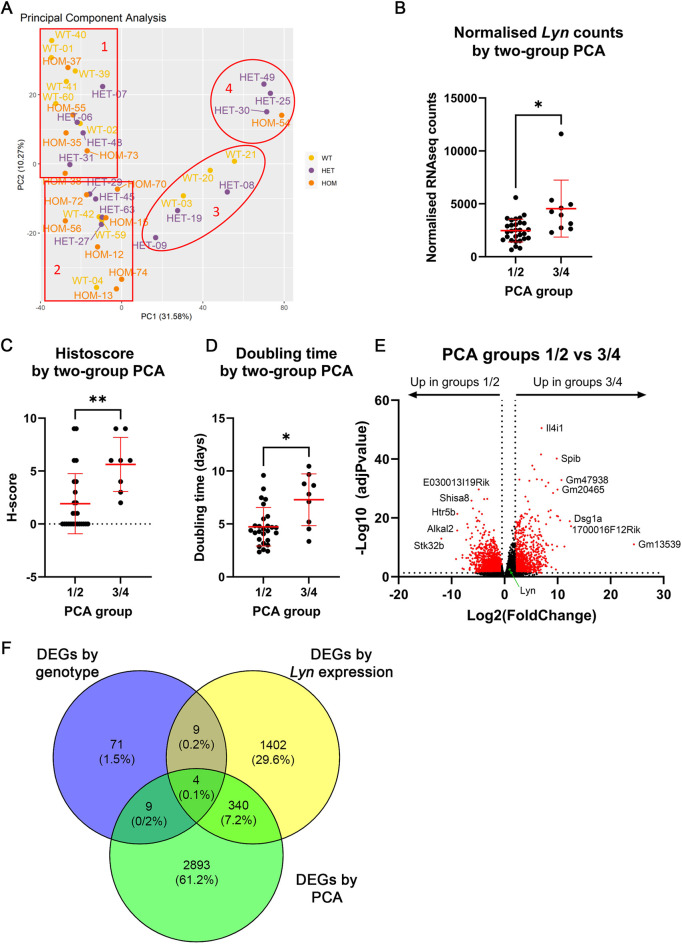
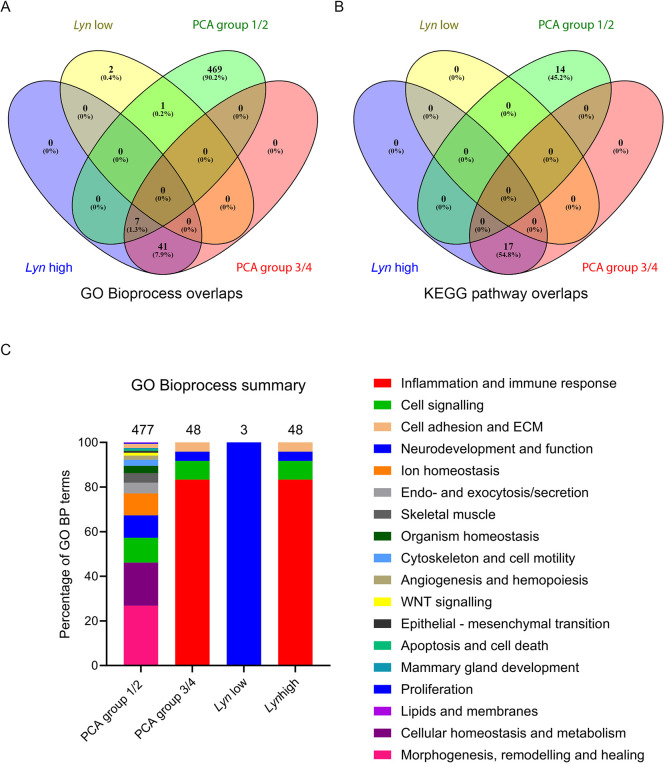
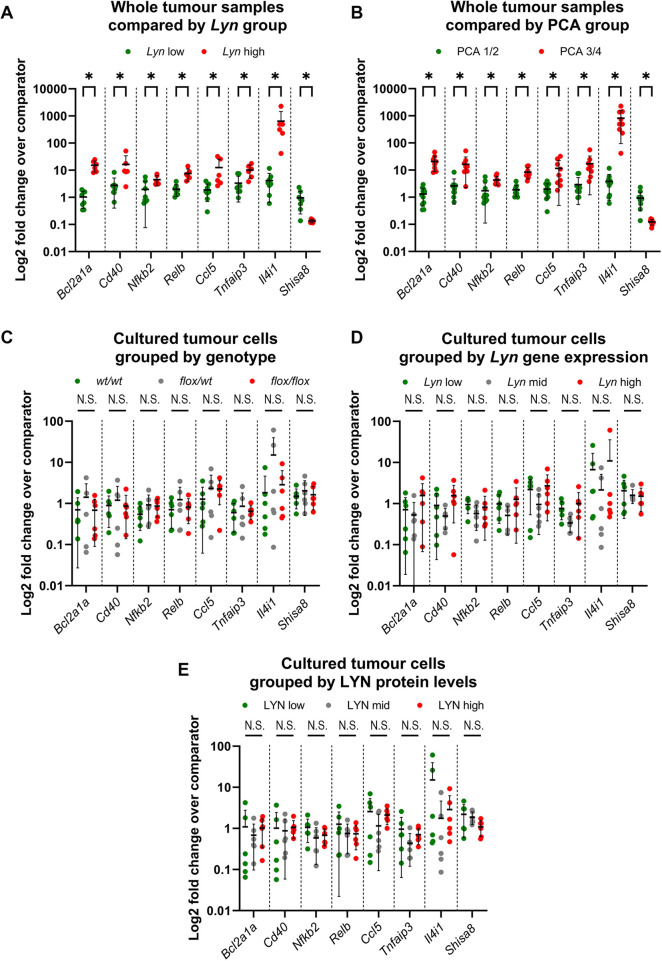
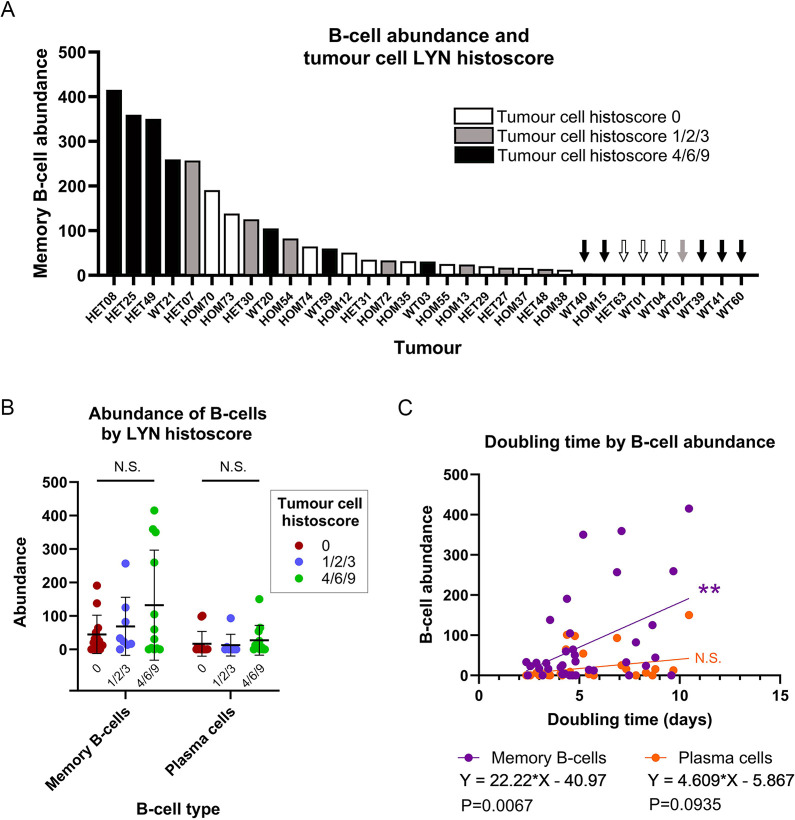
LYN kinase is expressed in BRCA1 loss-of-function-dependent mouse mammary tumours, in the cells of origin of such tumours, and in human breast cancer. Suppressing LYN kinase activity in BRCA1-defective cell lines as well as in in vitro cultures of Brca1-null mouse mammary tumours is deleterious to their growth. Here, we examined the interaction between LYN kinase and BRCA1 loss-of-function in an in vivo mouse mammary tumour model, using conditional knockout Brca1 and Lyn alleles. Comparison of Brca1 tumour cohorts showed little difference in mammary tumour formation between animals that were wild type, heterozygous or homozygous for the conditional Lyn allele, although this was confounded by factors including incomplete Lyn recombination in some tumours. RNA-sequencing analysis demonstrated that tumours with high levels of Lyn gene expression had a slower doubling time, but this was not correlated with levels of LYN staining in tumour cells themselves. Rather, high Lyn expression and slower tumour growth were likely a result of B-cell infiltration. The multifaceted role of LYN indicates that it is likely to present difficulties as a therapeutic target in breast cancer.

Keywords: BRCA1; Cre-LoxP; LYN kinase.


Conflict of interest statement

Competing interests The authors declare no competing or financial interests.

Figures

Fig. 1.
Fig. 1.
The Lynfl allele is efficiently recombined ex vivo to deplete the LYN protein. (A) Schematic of the Lyntm1c [Lynfl(ex4) or Lynfl] allele as supplied by the Mary Lyon Centre, MRC Harwell. The locations of loxP sites flanking exon 4 are indicated by red triangles. The single Frt site (green) is a remnant of the targeting strategy used to generate the allele. (B) qRT-PCR analysis of Lyn levels using an exon 4-specific probe in cultured primary mouse mammary epithelial cells from R26C Brca1fl/wt Lynwt/wt, R26C Brca1fl/wt Lynfl/wt and R26C Brca1fl/wt Lynfl/fl mice, treated with either vehicle control or tamoxifen (Tam). Mean±95% c.i. of exon 4 levels for the indicated condition relative to those for vehicle-treated R26C Brca1fl/wt Lynfl/wt cells are shown (n=3 independent experiments, each using primary cells harvested from three mice of each genotype). (C) Western blot for LYN expression in representative protein extracts from the cell cultures analysed in B (using the Thermo Fisher Scientific polyclonal antibody against LYN). (D) Western blot analysis of LYN expression in R26C Brca1fl/wt Lynwt/wt and R26C Brca1fl/wt Lynfl/fl primary mammary epithelial cells, with or without tamoxifen treatment, using three different commercial anti-LYN antibodies. Each antibody was tested on identical loading of the same protein extracts (from a single cell preparation of each genotype). The expected LYN band and the putative ΔNLYN product visible with the Thermo Fisher Scientific rabbit polyclonal antibody are indicated. Ms, mouse; Rb, rabbit.
Fig. 2.
Fig. 2.
Lynfl/fl mice have decreased overall survival in the BlgCre Brca1fl/fl p53+/− model and have tumours with highly heterogeneous growth characteristics. (A) Kaplan–Meier curve of overall survival of BlgCre Brca1fl/fl p53+/− Lynwt/wt (n=19), BlgCre Brca1fl/fl p53+/− Lynfl/wt (n=22) and BlgCre Brca1fl/fl p53+/− Lynfl/fl (n=21) cohorts. Lynfl/fl mice had a significantly shorter survival than Lynfl/wt mice (P<0.05; log rank test). (B) Kaplan–Meier curve of survival of BlgCre Brca1fl/fl p53+/− Lynwt/wt (n=12), BlgCre Brca1fl/fl p53+/− Lynfl/wt (n=18) and BlgCre Brca1fl/fl p53+/− Lynfl/fl (n=15) cohorts considering only mice euthanised as a result of a mammary tumour reaching a specified endpoint. There were no significant differences (log rank test). (C) Reasons for euthanasia in BlgCre Brca1fl/fl p53+/− Lynwt/wt (n=19), BlgCre Brca1fl/fl p53+/− Lynfl/wt (n=22) and BlgCre Brca1fl/fl p53+/− Lynfl/fl (n=21) cohorts. No significant differences were found (χ2 test for trend). (D) Doubling times (days) for individual tumours in each cohort (n=17, 36, 30 for Lynwt/wt, Lynfl/wt and Lynfl/fl, respectively). No significant differences (one-way ANOVA across cohorts; two-tailed unpaired t-tests comparing each cohort to the others). (E) Ki67 percentage positivity in sections of mammary adenocarcinomas from each cohort (n=13, 21, 20 for Lynwt/wt, Lynfl/wt and Lynfl/fl, respectively). No significant differences were found (Kruskel–Wallis test across cohorts; Mann–Whitney test comparing each cohort to the others). In D,E, the value for each tumour is plotted with the mean±s.d. (F) Tumour volume doubling times (days) by animal showing only animals from each cohort with more than one tumour measured. N.S., not significant; *P<0.05.
Fig. 3.
Fig. 3.
LYN expression in tumours is heterogeneous but decreased overall in BlgCre Brca1fl/fl p53+/− Lynfl/fl mice. (A) LYN staining pattern in epithelial-like tumour cells. Scale bar: 20 µm. (B) LYN staining in single cells (open arrowheads) and cancer-associated fibroblast-like cells (black arrows). Scale bar: 20 µm. (C) ‘Histoscore’ quantitation of LYN staining in epithelial-like tumour cells (see Materials and Methods for details; n=13, 21 and 20 for Lynwt/wt, Lynfl/wt and Lynfl/fl, respectively). The Lynfl/fl cohort has significantly less staining than the Lynwt/wt or Lynfl/wt cohort (Mann–Whitney test). (D) Semi-quantitative PCR analysis of Lynfl(ex4) and Lynwt alleles in genomic DNA isolated from primary cultures of BlgCre Brca1fl/fl p53+/− Lynwt/wt (n=6), BlgCre Brca1fl/fl p53+/− Lynfl/wt (n=5) and BlgCre Brca1fl/fl p53+/− Lynfl/fl (n=6) tumour cells. Analysis of the Apc locus was included as a control to enable relative quantitation. Each PCR reaction included the primers for all three alleles. P0, passage 0/primary cultures. (E) Quantitation of the relative abundance of Lynwt alleles in D, considering only Lynwt/wt and Lynfl/wt cultures (as no Lynwt alleles were present in Lynfl/fl cells). There are 50% fewer (Mann–Whitney test) Lynwt alleles in the Lynfl/wt cultures compared to the Lynwt/wt cultures, as expected. (F) Quantitation of relative abundance of Lynfl(ex4) alleles in D, considering only Lynfl/wt and Lynfl/fl cultures (as no Lynfl alleles are present in Lynwt/wt cells). No significant difference was found between the samples, but the heterogeneity of the samples reflects the clear differences in band intensities seen in D. In E,F, data are presented as abundance in each sample relative to the Apc band in that sample. The mean abundance±s.d. of each group is indicated. (G) qRT-PCR analysis of Lyn exon 4 expression in primary tumour cell cultures. Data are presented as expression relative to the mean value for the Lynwt/wt cells (Mann–Whitney test). (H) qRT-PCR analysis of Brca1 expression in primary tumour cell cultures. Data presented as expression relative to Brca1 levels in lysates of freshly isolated normal mouse mammary epithelial cells for Brca1 (Mann–Whitney test). (I) Relative expression of LYN protein in primary tumour cultures as determined by western blot analysis, quantified relative to standard loading controls and normalised to one Lynwt/wt tumour culture sample (Mann–Whitney test; see Fig. S8 for raw blots). For G-I, n=6 samples of each genotype; bars represent the mean±s.d. N.S., not significant; *P<0.05; **P<0.01.
Fig. 4.
Fig. 4.
Tumour molecular profiles correlate with Lyn expression but not with tumour cohort. (A) Volcano plot [−log10(adjusted P-value) against log2(fold change)] of DEGs comparing Lynwt/wt (n=12) and Lynfl/fl (n=14) tumours. Genes with an adjusted P-value of <0.05 and a fold change of ≤0.5 or ≥2 were considered significant and are indicated in red. The most strongly differentially expressed genes are labelled. Lyn is indicated with a green dot and labelled. (B) Normalised RNAseq Lyn counts in tumours from each cohort (n=12, 13 and 14 for Lynwt/wt, Lynfl/wt and Lynfl/fl, respectively; Brown–Forsythe two-way ANOVA). (C) Normalised RNAseq Lyn counts in tumours with different LYN histoscore grading (0, no LYN staining; 1/2/3, low LYN staining or strong staining but only in a small region; 4/6/9, moderate to strong LYN staining) (n=13, 8 and 12, respectively). Increased Lyn counts are associated with increasing histoscore (Brown–Forsythe two-way ANOVA). (D) Histoscore of top tertile (Lyn high; n=12) versus bottom tertile (Lyn low; n=11) Lyn-expressing tumours by RNAseq (Mann–Whitney test). (E) In vivo doubling time (days) of top tertile (Lyn high; n=12) versus bottom tertile (Lyn low; n=12) Lyn-expressing tumours by RNAseq (two-tailed unpaired t-test). (F) In vivo doubling time (days) of tumours from LYN histoscore groups (n=20, 14 and 18, for groups 0, 1/2/3 and 4/6/9, respectively; Brown–Forsythe two-way ANOVA). (G) Volcano plot [−log10(adjusted P-value) against log2(fold change)] of DEGs comparing top tertile (Lyn high; n=13) versus bottom tertile (Lyn low; n=13) Lyn-expressing tumours defined by RNAseq. Genes with an adjusted P-value of <0.05 and a fold change of ≤0.5 or ≥2 were considered significant and are indicated in red. The most strongly differentially expressed genes are labelled. Lyn is indicated with a green dot and labelled. In B-F, mean±s.d. is shown. N.S., not significant; *P<0.05; **P<0.01.
Fig. 5.
Fig. 5.
PCA identifies two main groups of tumours that partially overlap with Lyn-high and Lyn-low tumours. (A) PCA plot of 39 tumours analysed by RNAseq showing an unbiased assessment of tumour gene expression differences and similarities. Principal component (PC) 1 (PC1) divides the tumours into groups 1/2 (n=29) and 3/4 (n=10), PC2 further divides the tumours to give four groups; however, the majority of the differences between the tumour groups was generated by PC1. WT, wild-type tumours; HET, heterozygous tumours; HOM, homozygous tumours. (B) Normalised RNAseq Lyn counts in tumours from PCA groups 1/2 (n=29) and 3/4 (n=10) (two-tailed unpaired t-test). (C) Histoscore of tumours from PCA groups 1/2 and 3/4 (Mann–Whitney test). (D) In vivo doubling time (days) of tumours from PCA groups 1/2 (n=27) and 3/4 (n=9) (two-tailed unpaired t-test). (E) Volcano plot [−log10(adjusted P-value) against log2(fold change)] of DEGs comparing tumours from PCA groups 1/2 (n=29) and 3/4 (n=10). Genes with an adjusted P-value of <0.05 and a fold change of ≤0.5 or ≥2 were considered significant and are indicated in red. The most strongly differentially expressed genes are labelled. Lyn is indicated with a green dot and labelled. (F) Venn diagram showing overlap between DEGs identified when comparing Lynwt/wt versus Lynfl/fl tumours, Lyn-high versus Lyn-low tumours and PCA group 1/2 versus PCA group 3/4 tumours. Note that 340 genes overlap between the latter two groups, but there is very little overlap with the Lynwt/wt versus Lynfl/fl tumour data. In B-D, mean±s.d. is shown. *P<0.05; **P<0.01.
Fig. 6.
Fig. 6.
The Lyn-high and PCA group 3/4 tumours are enriched for identical biological functions. (A,B) Venn diagram analysis of overlap between Gene Ontology Bioprocess (GO BP) terms (A) and between KEGG pathways (B) enriched in the DEGs from Lyn-high, Lyn-low, PCA group 1/2 and PCA group 3/4 tumours. (C) Distribution of enriched GO BP terms within functional categories for the Lyn-high, Lyn-low, PCA group 1/2 and PCA group 3/4 tumours. The number of enriched GO BP terms identified in the DEGs of each tumour group is indicated above each bar. Each bar is divided according to the percentage of enriched GO BP terms falling into each functional category (indicated by the colour key).
Fig. 7.
Fig. 7.
Gene expression differences between tumours in vivo are not maintained in neoplastic tumour cells in primary culture. (A,B) qRT-PCR validation of Ccl5, Tnfaip3, Bcl2a1a, Cd40, Nfkb2, Relb, Shisa8 and Il4i1 expression in whole tumour samples analysed by RNAseq, comparing Lyn-low (n=8) and Lyn-high (n=6) (A) and PCA group 1/2 (n=11) and PCA group 3/4 (n=9) (B) tumour groups. Patterns of gene expression are consistent with the RNAseq data. (C-E) qRT-PCR expression of the same gene set in primary cultures of neoplastic tumour cells from Lynwt/wt, Lynfl/wt and Lynfl/fl tumours (n=6 of each genotype). Expression is compared by genotype (C), previously determined levels of Lyn gene expression (D) or previously determined levels of LYN protein expression (E) (Fig. 3). Cultures were divided into three groups based on high (top third), mid (middle third) or low (bottom third) levels of expression. There were no differences between any groups in the cultured cell analysis. Data are presented as expression levels normalised to Gapdh and Actb (A,B) or Gapdh alone (C,D) (Fig. S6) and relative to comparator samples (Table S12). For each gene, datasets are presented by sample group in the order shown in the legend underneath the graph title. Mean±s.d. is shown; Mann–Whitney tests with multiple comparison correction. N.S., not significant; *P<0.05.
Fig. 8.
Fig. 8.
Memory B-cell abundance correlates with tumour-doubling time. (A) Memory B-cell abundance in 33 RNAseq tumour samples plotted from highest to lowest abundance (arbitrary units) and colour-coded by tumour cell LYN histoscore for the tumour. Very low/zero abundance samples are indicated by colour-coded arrows. WT, wild-type tumours; HET, heterozygous tumours; HOM, homozygous tumours. (B) Memory B-cell and plasma cell abundance compared by tumour cell LYN histoscore groups (n=13, 8 and 12 for groups 0, 1/2/3 and 4/6/9, respectively). Mean±s.d. is shown. (two-way ANOVA). (C) Simple linear regression of B-cell abundance (arbitrary units) (memory B cell, purple; plasma cells, orange) against tumour-doubling time (days) (n=36). Increased numbers of memory B cells are significantly associated with increased tumour-doubling time. N.S., not significant; **P<0.01.

Similar articles

References

    1. Avila, M., Martinez-Juarez, A., Ibarra-Sanchez, A. and Gonzalez-Espinosa, C. (2012). Lyn kinase controls TLR4-dependent IKK and MAPK activation modulating the activity of TRAF-6/TAK-1 protein complex in mast cells. Innate. Immun. 18, 648-660. 10.1177/1753425911435265 - DOI - PubMed
    1. Brian, B. F. and Freedman, T. S. (2021). The Src-family kinase Lyn in immunoreceptor signaling. Endocrinology 162, bqab152. 10.1210/endocr/bqab152 - DOI - PMC - PubMed
    1. Brian, B. F. T., Sauer, M. L., Greene, J. T., Senevirathne, S. E., Lindstedt, A. J., Funk, O. L., Ruis, B. L., Ramirez, L. A., Auger, J. L., Swanson, W. L.et al. (2022). A dominant function of LynB kinase in preventing autoimmunity. Sci. Adv. 8, eabj5227. 10.1126/sciadv.abj5227 - DOI - PMC - PubMed
    1. Buckley, N. E., Haddock, P., De Matos Simoes, R., Parkes, E., Irwin, G., Emmert-Streib, F., McQuaid, S., Kennedy, R. and Mullan, P. (2016). A BRCA1 deficient, NFκB driven immune signal predicts good outcome in triple negative breast cancer. Oncotarget 7, 19884-19896. 10.18632/oncotarget.7865 - DOI - PMC - PubMed
    1. Chen, S., Zhou, Y., Chen, Y. and Gu, J. (2018). fastp: an ultra-fast all-in-one FASTQ preprocessor. Bioinformatics 34, i884-i890. 10.1093/bioinformatics/bty560 - DOI - PMC - PubMed