. 2024 Jan 15;13(1):bio060101.
doi: 10.1242/bio.060101. Epub 2024 Jan 22.

The Nucleosome Remodelling and Deacetylation complex coordinates the transcriptional response to lineage commitment in pluripotent cells

Affiliations

The Nucleosome Remodelling and Deacetylation complex coordinates the transcriptional response to lineage commitment in pluripotent cells

Bertille Montibus et al. Biol Open. .

Abstract

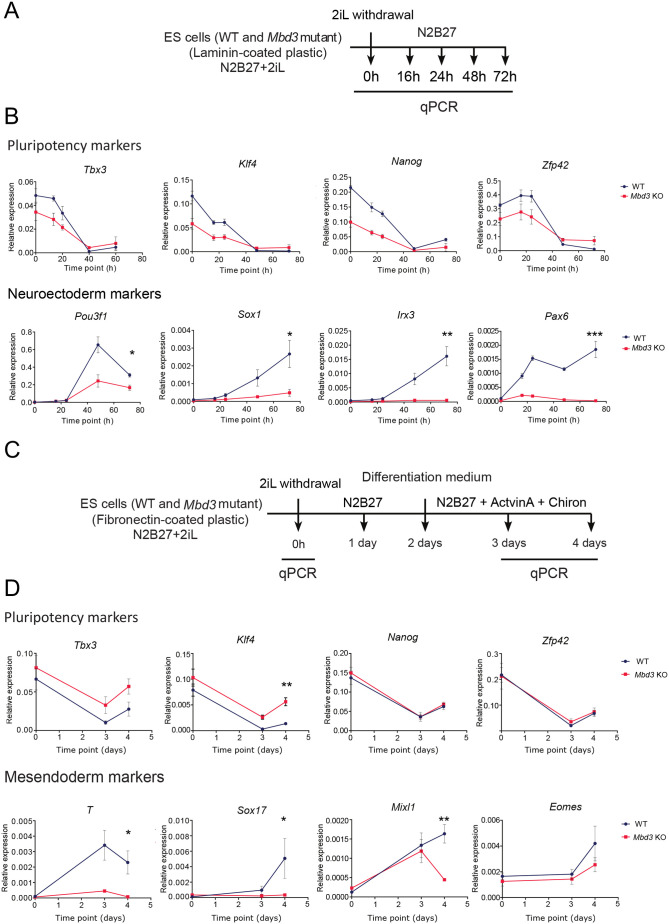
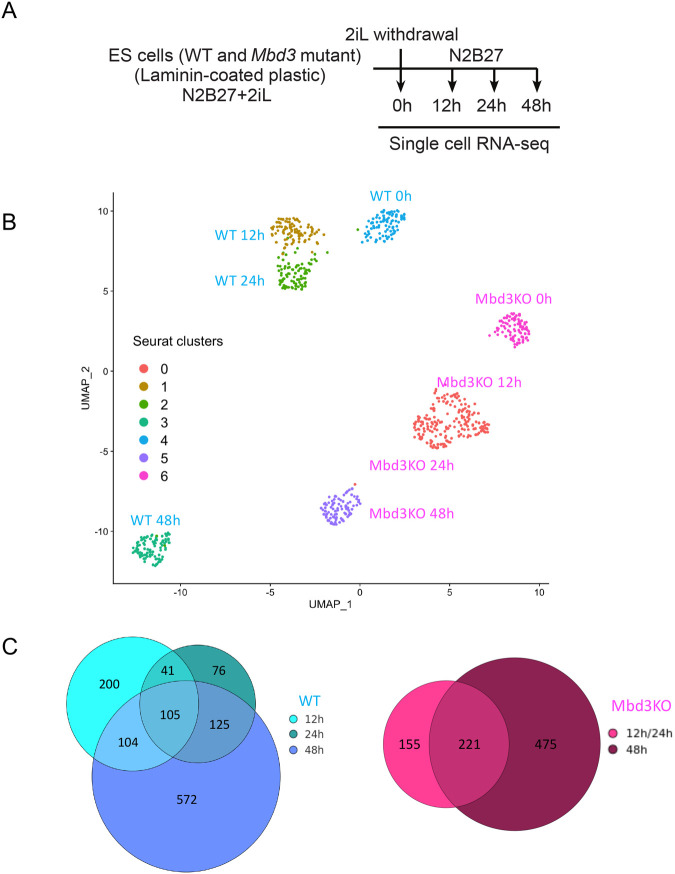
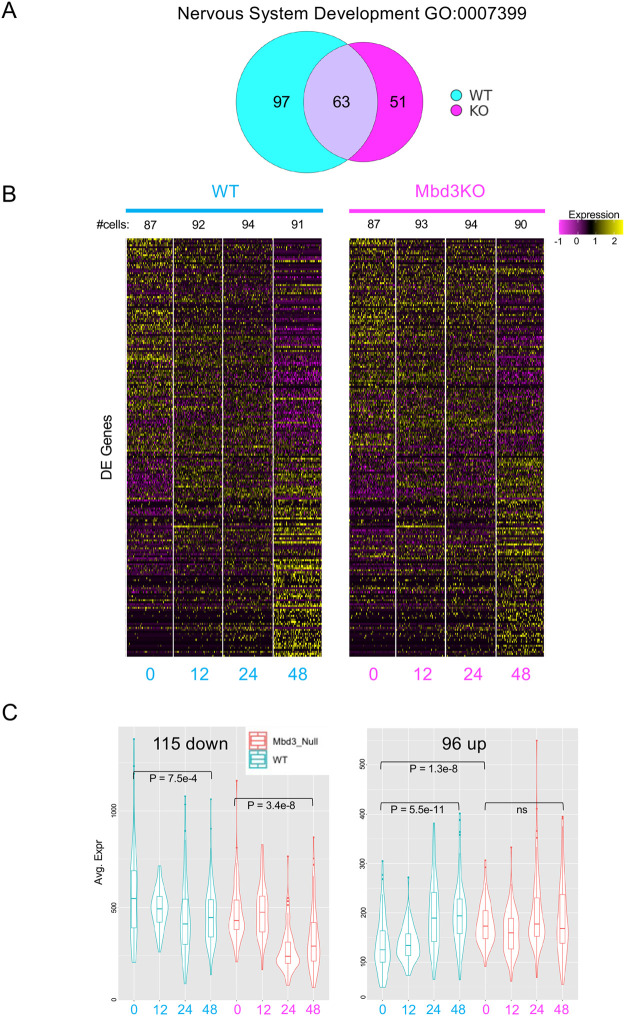
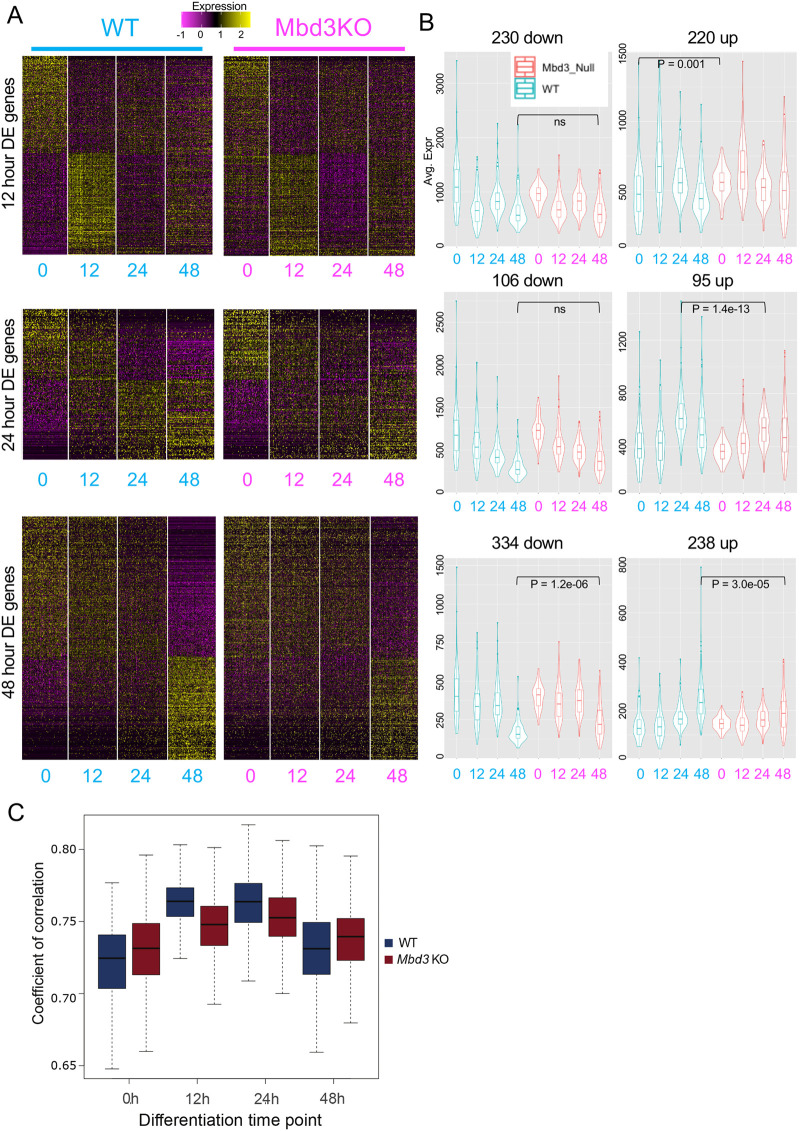
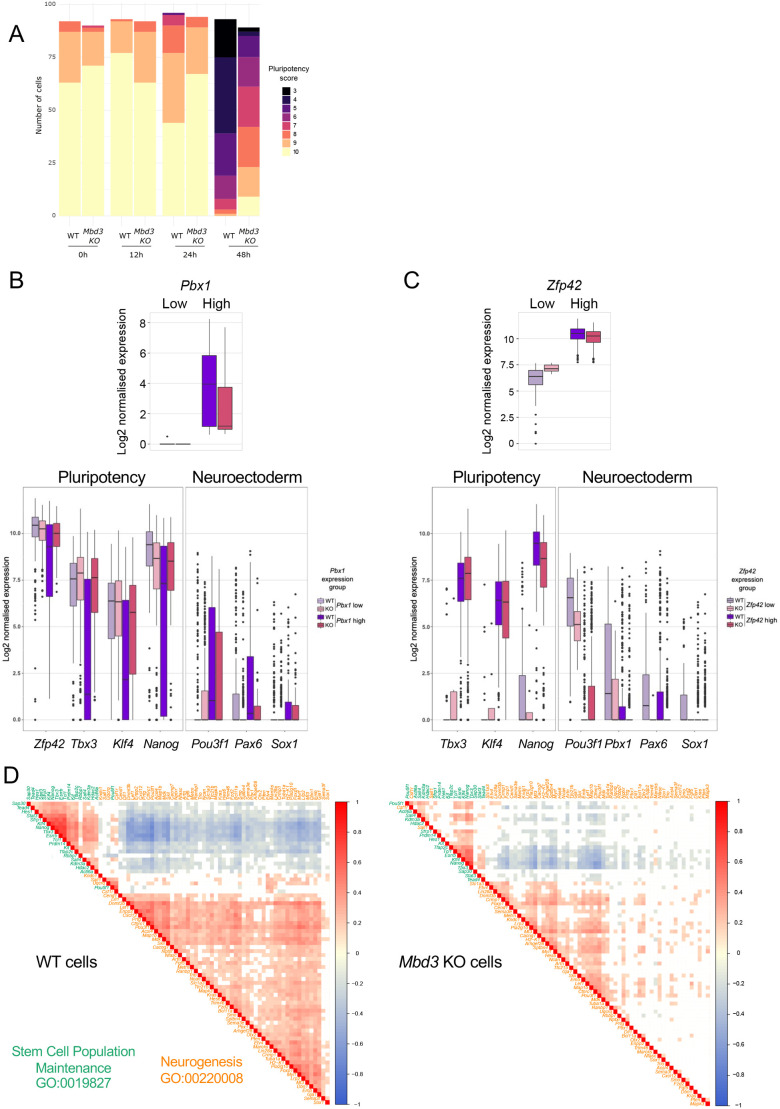
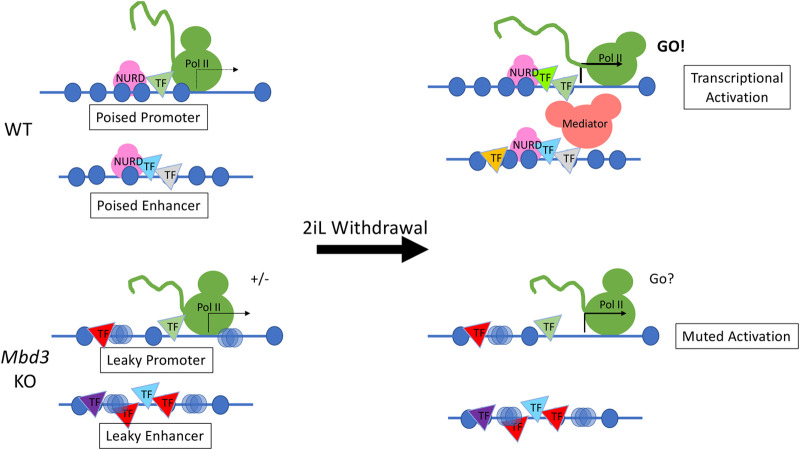
As cells exit the pluripotent state and begin to commit to a specific lineage they must activate genes appropriate for that lineage while silencing genes associated with pluripotency and preventing activation of lineage-inappropriate genes. The Nucleosome Remodelling and Deacetylation (NuRD) complex is essential for pluripotent cells to successfully undergo lineage commitment. NuRD controls nucleosome density at regulatory sequences to facilitate transcriptional responses, and also has been shown to prevent unscheduled transcription (transcriptional noise) in undifferentiated pluripotent cells. How these activities combine to ensure cells engage a gene expression program suitable for successful lineage commitment has not been determined. Here, we show that NuRD is not required to silence all genes. Rather, it restricts expression of genes primed for activation upon exit from the pluripotent state, but maintains them in a transcriptionally permissive state in self-renewing conditions, which facilitates their subsequent activation upon exit from naïve pluripotency. We further show that NuRD coordinates gene expression changes, which acts to maintain a barrier between different stable states. Thus NuRD-mediated chromatin remodelling serves multiple functions, including reducing transcriptional noise, priming genes for activation and coordinating the transcriptional response to facilitate lineage commitment.

Keywords: Chromatin; Embryonic stem cell; Lineage commitment; MBD3; NuRD; Transcription.


Conflict of interest statement

Competing interests Sara-Jane Dunn was an employee at Microsoft Research during this study and is currently employed at DeepMind. Neither Microsoft Research nor DeepMind have directed any aspect of the study nor exerted any commercial rights over the results. The authors declare no conflicts of interest.

Figures

Fig. 1.
Fig. 1.
Gene expression analysis at the population level confirms the defect of induction of lineage genes during differentiation in Mbd3 mutant cells. (A) Protocol for monolayer neuroectodermal differentiation of naïve ES cells in N2B27 (Kalkan et al., 2017). (B) Gene expression analysis by RT-qPCR at the population level for selected representative pluripotency markers and neuroectoderm markers during neuroectoderm differentiation. Expression was normalised to three housekeeping genes (Gapdh, Atp5A1, Ppia). Error bars indicate the standard error of four independent differentiations. (C) Protocol for mesendoderm differentiation of naïve ES cells in N2B27 supplemented with Activin A and Chiron (Turner et al., 2014). (D) Gene expression analysis by RT-qPCR at the population level for selected representative pluripotency markers and mesendoderm markers during mesendoderm differentiation. Error bars indicate the standard error of four independent differentiations. Asterisks in B and D indicate that wild type and mutant are significantly different at the final time point by two-tailed t-test (*P<0.05, **P<0.01, ***P<0.001).
Fig. 2.
Fig. 2.
Single cell gene expression analysis of exit from the naïve state in wild type and Mbd3-knockout ES cells. (A) Scheme of differentiation time course for the single cell RNA sequencing dataset. (B) UMAP representation of the single cell RNAseq data using all genes. Only cells that have passed quality control are plotted. Cells are coloured according to their Seurat cluster affiliation and labelled with their biological identities. (C) The numbers of significantly (P<0.05) differentially expressed genes in each Seurat clusters (reassigned to their corresponding biological condition) are shown for wild type (left) and Mbd3-knockout cells (right).
Fig. 3.
Fig. 3.
Behaviour of 48 h differentially expressed Nervous System Development genes in wild type and mutant cells. (A) Venn diagram showing the overlap of genes contained in the GO term “Nervous system development” (GO:0007399) which show significant expression changes after 48 h of differentiation in wild-type (blue) and Mbd3-knockout cells (magenta) (genes listed in Table S3). (B) Heatmap showing the log2 normalised expression level across the differentiation time course for genes described in A. The number of cells scored at each time point is indicated above. (C) Average expression profiles of gene sets shown in B divided into those decreasing in expression (N=114) or those increasing in expression (N=96). Wild-type expression patterns are shown in blue and expression in mutant cells shown in red. The shape of the violin indicates the proportion of cells at each position along the y-axis; the midline of the box shows the median value, the lower and upper edges of the box represent the 1st and the 3rd quartiles, and the whiskers represent the minimum and maximum values. P-values were calculated using a two-tailed t-test; ns, not significant.
Fig. 4.
Fig. 4.
NuRD activity is required both for noise reduction and for timely activation of specific gene subsets. (A) Expression of genes significantly changing in wild-type cells is plotted across all time points, clustered according to fold change in wild-type cells. Expression of genes first showing significant changes at 12 h (top panels), 24 h (middle panels) or 48 h (bottom panels) are displayed for wild-type (left) and Mbd3-null cells (right). (B) Average expression profiles of gene sets shown in A, with wild type expression patterns shown in blue (left) and expression in mutant cells shown in red (right). The shape of the violin indicates the proportion of cells at each position along the y-axis; the midline of the box shows the median value, the lower and upper edges of the box represent the 1st and the 3rd quartiles, and the whiskers represent the minimum and maximum values. P-values were calculated using a two-tailed t-test; ns, not significant. (C) Distribution of the Pearson coefficient of correlation between the wild type (blue) and Mbd3-knockout cells (red) is shown at each time point of differentiation.
Fig. 5.
Fig. 5.
NuRD is important for a coordinated transcriptional response to exit from the naïve state. (A) Cells were discretised for expression of selected pluripotency-associated genes; that is, scored as 0 for low or off, and 1 for medium or high expression. These were then used to calculate a global score per cell. The cumulative number of cells for each pluripotency score is plotted for wild type and Mbd3-null cells at each time point. Colours indicate pluripotency scores. (B,C) Cells were classified as expressing “Low” or “High” levels of Pbx1 (B) or Zfp42 (C), top panels. Data for wild-type cells is shown in purple while those for Mbd3-knockout cells is shown in pink. Normalised expression of indicated markers of pluripotency or neuroectoderm was then plotted for wild-type (purple) and mutant (pink) cells classified as showing low or high (light or dark colours, respectively) expression of Pbx1 (panel B) or Zfp42 (panel C). (D) Pearson correlation analysis between the expression profiles of genes belonging to the Gene Omnibus (GO) terms “Stem Cell Population Maintenance” (GO:0019827) and “Neurogenesis” (GO:00220008) in wild-type cells (left panel) and in Mbd3-knockout cells (right panel). Data are shown for genes showing significant differential expression in the wild type differentiation time course and only the significant Pearson correlation coefficients were plotted. Lists of genes plotted in the order displayed in the figure are available in Table S4.
Fig. 6.
Fig. 6.
Model of how NuRD facilitated transcriptional activation during differentiation. In wild-type cells, NuRD activity ensures positioned nucleosomes (blue circles) and restricts transcription factor (triangles) binding at promoters and enhancers (top left). The promoter is poised, but inactive. The enhancers are very mobile in three-dimensional space, meaning they can scan a large area for sequences with which to interact. When cells are induced to differentiate (2iL withdrawal), NuRD maintains enhancer nucleosome structure and allows appropriate transcription factor binding so the enhancer and promoter can interact to drive differentiation-associated transcription (top right). In Mbd3-knockout cells, both promoters and enhancers have less positioned nucleosomes (hazy blue circles), inappropriate transcription factor binding (bottom left), and the enhancer is less mobile, meaning it can only sample its immediate vicinity. The lack of NuRD activity at the enhancer and/or promoter results in incomplete silencing (“+/-”). When induced to differentiate the enhancer is not in an appropriate chromatin configuration an cannot sample sufficient three-dimensional space to appropriately activate transcription. As a consequence, the promoter shows muted activation (bottom right).

Similar articles

Cited by

References

    1. Ahringer, J. (2000). NuRD and SIN3 histone deacetylase complexes in development. Trends Genet. 16, 351-356. 10.1016/S0168-9525(00)02066-7 - DOI - PubMed
    1. Allen, H. F., Wade, P. A. and Kutateladze, T. G. (2013). The NuRD architecture. Cell. Mol. Life Sci. 70, 3513-3524. 10.1007/s00018-012-1256-2 - DOI - PMC - PubMed
    1. Basu, S., Shukron, O., Hall, D., Parutto, P., Ponjavic, A., Shah, D., Boucher, W., Lando, D., Zhang, W., Reynolds, N.et al. (2023). Live-cell three-dimensional single-molecule tracking reveals modulation of enhancer dynamics by NuRD. Nat. Struct. Mol. Biol. 30, 1628-1639. 10.1038/s41594-023-01095-4 - DOI - PMC - PubMed
    1. Bornelöv, S., Reynolds, N., Xenophontos, M., Gharbi, S., Johnstone, E., Floyd, R., Ralser, M., Signolet, J., Loos, R., Dietmann, S.et al. (2018). The nucleosome remodeling and deacetylation complex modulates chromatin structure at sites of active transcription to fine-tune gene expression. Mol. Cell 71, 56-72.e4. 10.1016/j.molcel.2018.06.003 - DOI - PMC - PubMed
    1. Burgold, T., Barber, M., Kloet, S., Cramard, J., Gharbi, S., Floyd, R., Kinoshita, M., Ralser, M., Vermeulen, M., Reynolds, N.et al. (2019). The Nucleosome Remodelling and Deacetylation complex suppresses transcriptional noise during lineage commitment. EMBO J. 38, e100788. 10.15252/embj.2018100788 - DOI - PMC - PubMed

Publication types

MeSH terms

Substances