. 2024 Apr;21(4):e14447.
doi: 10.1111/iwj.14447. Epub 2023 Dec 27.

Molecular characterization of chronic cutaneous wounds reveals subregion- and wound type-specific differential gene expression

Affiliations

Molecular characterization of chronic cutaneous wounds reveals subregion- and wound type-specific differential gene expression

Shola Michelle Richards et al. Int Wound J. 2024 Apr.

Abstract

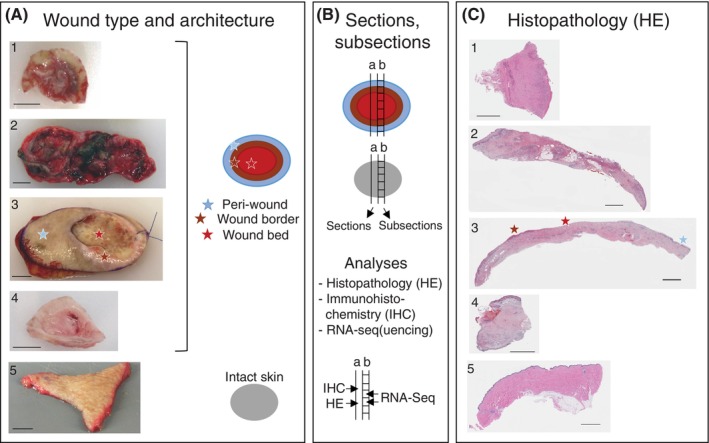
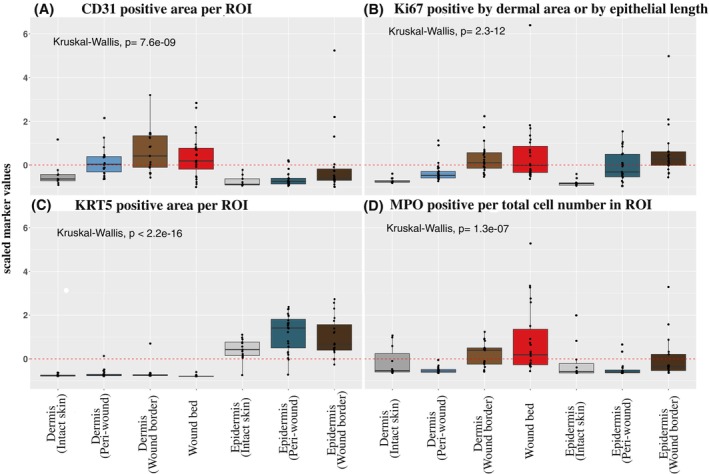
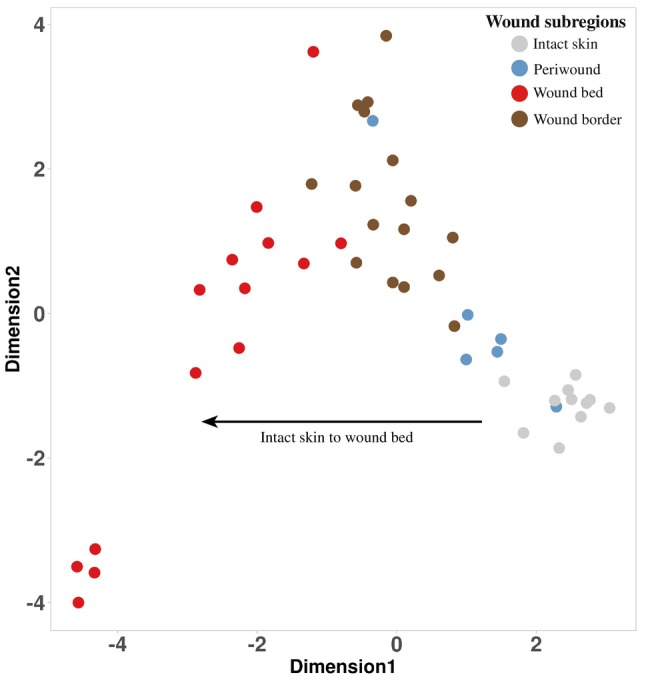
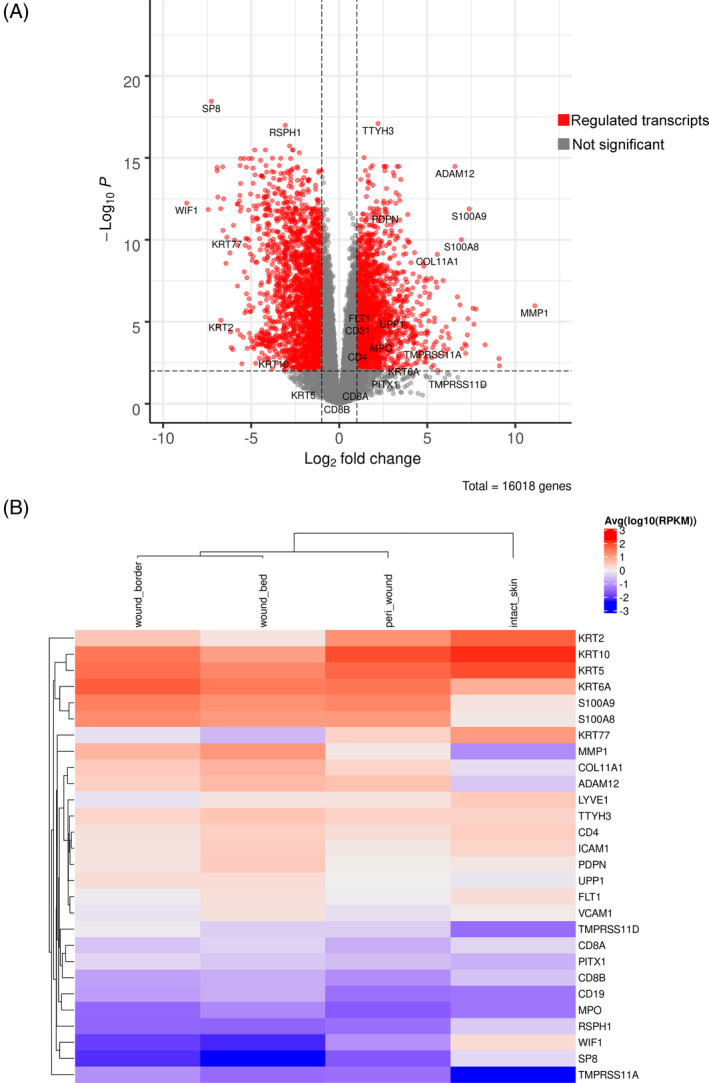
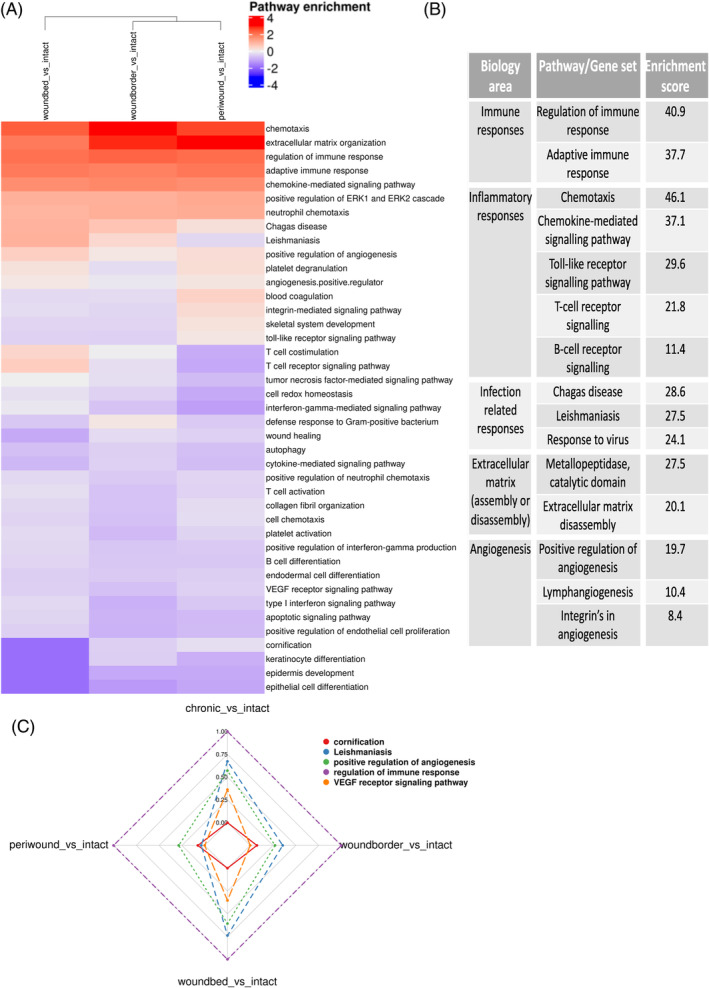
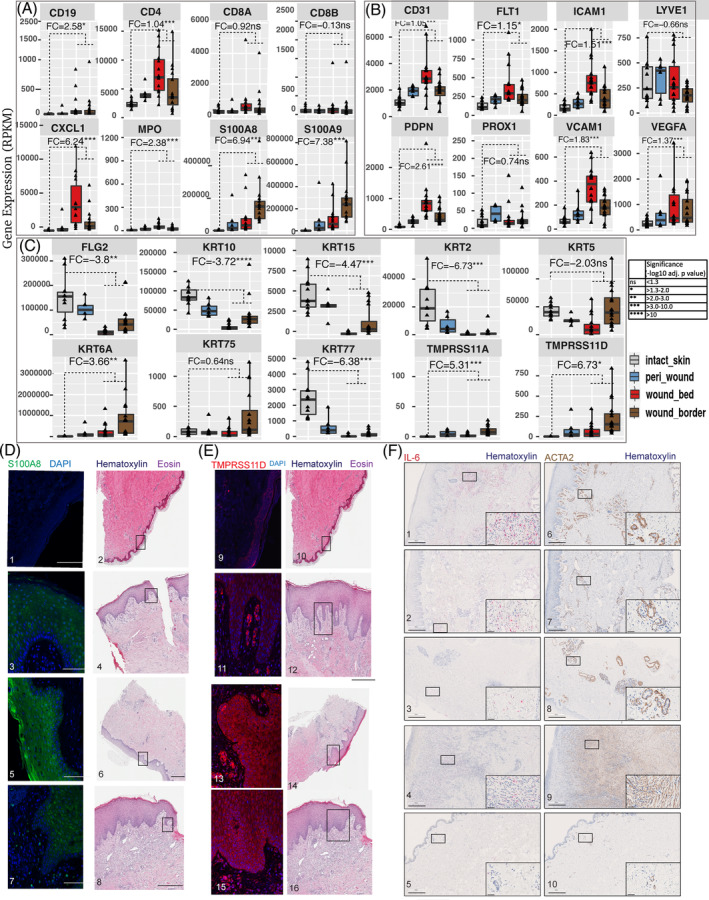
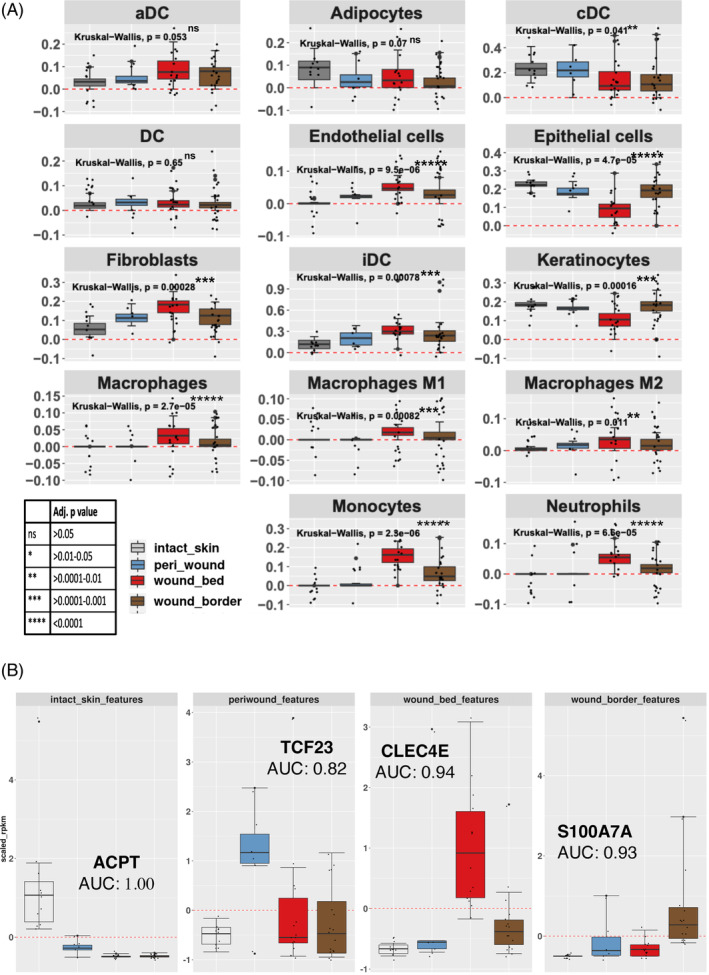
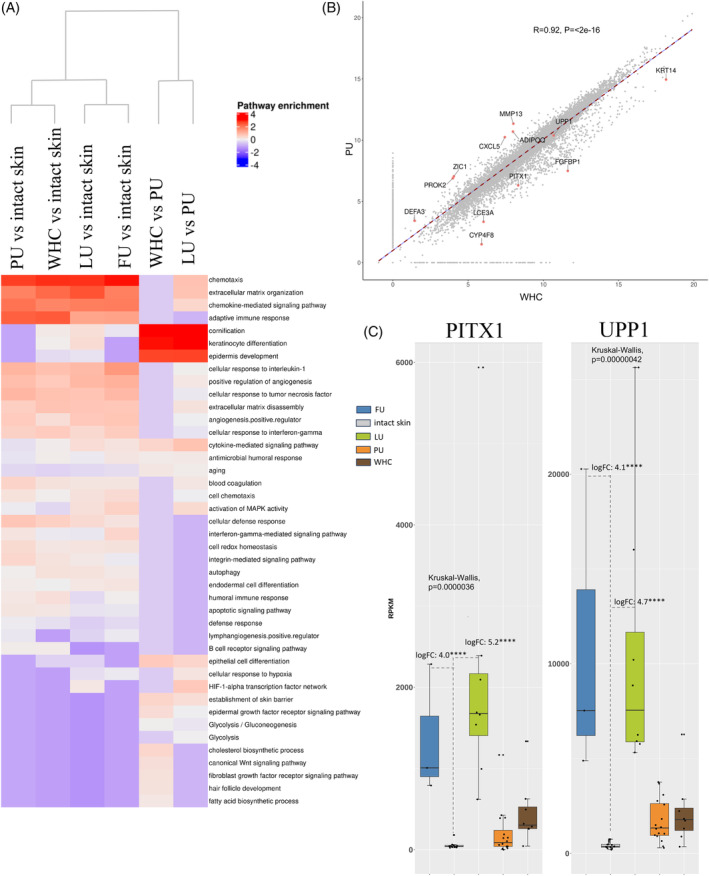
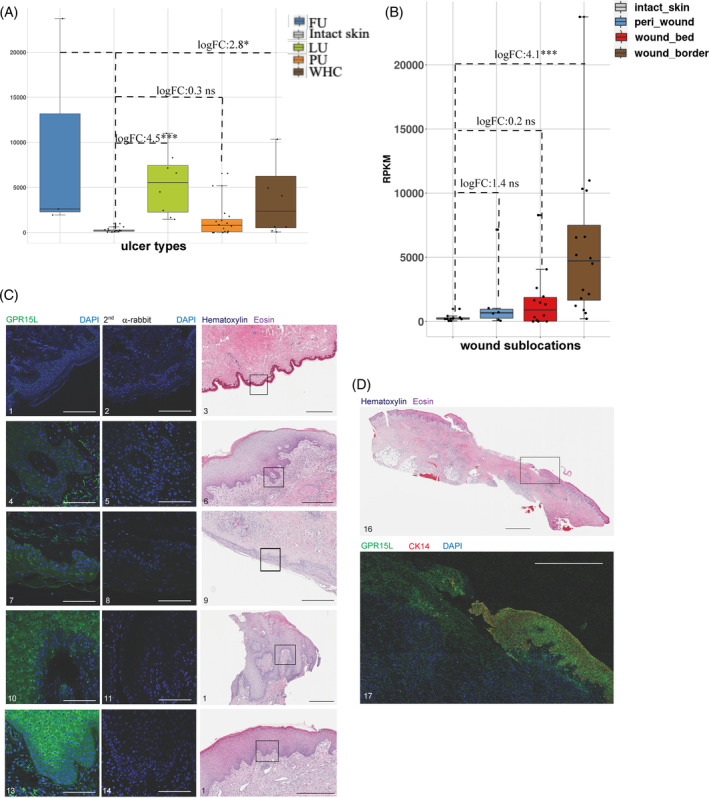
A limited understanding of the pathology underlying chronic wounds has hindered the development of effective diagnostic markers and pharmaceutical interventions. This study aimed to elucidate the molecular composition of various common chronic ulcer types to facilitate drug discovery strategies. We conducted a comprehensive analysis of leg ulcers (LUs), encompassing venous and arterial ulcers, foot ulcers (FUs), pressure ulcers (PUs), and compared them with surgical wound healing complications (WHCs). To explore the pathophysiological mechanisms and identify similarities or differences within wounds, we dissected wounds into distinct subregions, including the wound bed, border, and peri-wound areas, and compared them against intact skin. By correlating histopathology, RNA sequencing (RNA-Seq), and immunohistochemistry (IHC), we identified unique genes, pathways, and cell type abundance patterns in each wound type and subregion. These correlations aim to aid clinicians in selecting targeted treatment options and informing the design of future preclinical and clinical studies in wound healing. Notably, specific genes, such as PITX1 and UPP1, exhibited exclusive upregulation in LUs and FUs, potentially offering significant benefits to specialists in limb preservation and clinical treatment decisions. In contrast, comparisons between different wound subregions, regardless of wound type, revealed distinct expression profiles. The pleiotropic chemokine-like ligand GPR15L (C10orf99) and transmembrane serine proteases TMPRSS11A/D were significantly upregulated in wound border subregions. Interestingly, WHCs exhibited a nearly identical transcriptome to PUs, indicating clinical relevance. Histological examination revealed blood vessel occlusions with impaired angiogenesis in chronic wounds, alongside elevated expression of genes and immunoreactive markers related to blood vessel and lymphatic epithelial cells in wound bed subregions. Additionally, inflammatory and epithelial markers indicated heightened inflammatory responses in wound bed and border subregions and reduced wound bed epithelialization. In summary, chronic wounds from diverse anatomical sites share common aspects of wound pathophysiology but also exhibit distinct molecular differences. These unique molecular characteristics present promising opportunities for drug discovery and treatment, particularly for patients suffering from chronic wounds. The identified diagnostic markers hold the potential to enhance preclinical and clinical trials in the field of wound healing.

Keywords: RNA sequencing; chronic wounds; histopathology; quantitative immunohistochemistry; wound subregions.


Conflict of interest statement

All authors contributing to this manuscript declare that they have nothing to disclose and do not have a conflict of interest. All authors except D.W., M.V.S., D.S., B.W. and R.W., were or are employees of Novartis Pharma AG.

Figures

FIGURE 1
FIGURE 1
Clinical and molecular analyses of chronic wounds and wound healing complications (WHCs). (A) Classification of chronic wounds was based on ulcer type and anatomical location of the donor. WHC resections were derived from complications of surgical wounds. Intact skin samples were taken from plastic surgeries on patients without chronic wounds and served as controls. Wound resections were collected by the treating physician from patients undergoing debridement surgery. The photographs shown include examples of 1, foot ulcer (FU); 2, leg ulcer (LU); 3, pressure ulcer (PU); 4, WHC; 5, intact skin. The schematic on the right indicates the colour code used to differentiate wound subregions and intact skin specimen evaluated in this study. Light‐blue, brown, and red indicate peri‐wound, wound border and wound bed subregions, respectively, of ulcers and WHCs; grey indicates intact skin. Peri‐wound denotes the transition zone between the wound border and surrounding intact skin, wound border the region adjacent to the wound bed, and wound bed the center of the wound that is devoid of the epidermis. Star symbols in the respective colours denote the different wound subregions which are based on visual inspection of the wound specimen, as exemplified for the PU sample. Scale bars correspond to 1 cm (about 0.39 in) length. (B) Tissue sectioning and sub‐sectioning, schematic representation. Full trans‐sectional tissue sections were formalin‐fixed and embedded in paraffin prior to (a) Haematoxylin and eosin (HE) and IHC analysis (including qIHC). Adjacent, non‐fixed sections were divided into subsections according to wound architecture for (b) gene expression analyses by RNA‐Seq in individual wound subregions; similarly sized intact skin subsections served as controls. (C) Histopathology. HE‐stained sections from wound and intact skin specimen, numbering and star symbols as in A. Scale bars correspond to 2.5 mm (about 0.1 in) length.
FIGURE 2
FIGURE 2
Quantification of vasculature, epidermal proliferation, re‐epithelialization and immune cell markers. A quantitative evaluation of immunoreactive markers (qIHC) was performed on tissue sections from chronic ulcer, WHC and intact skin samples. Shown are scaled immunoreactive protein expression values for (A) CD31, (B) Ki67, (C) KRT5 and (D) MPO quantified in the dermal and epidermal compartments of peri‐wound, wound border and bed subregions. Intact skin dermal and epidermal compartments were monitored as controls. A subset of immune cells in (A) revealed CD31 signals that were filtered out by image analysis to permit CD31 quantification in the vasculature. Values for CD31 and KRT5 expression levels were normalized to the ROIs and presented as positively stained areas. Values for MPO expression were normalized to total cell numbers. Ki67 expression levels were normalized to the ROI areas in the dermis or epithelial length for epidermal regions. For qIHC analyses, samples from the following donors have been used (donor identifiers in parentheses for each wound type/intact skin): 2 FUs (50 002, 50 038); 4 LUs (50 037, 50 040, 50 046, 50 052); 8 PUs (50 007, 50 013, 50 021, 50 025, 50 036, 50 041, 50 048, 50 051); 5 WHCs (50 030, 50 032, 50 044, 50 049, 50 050); 5 intact skin (00048, 00051, 00096, 00099, 00108). The aggregated data of all wound types (LU, FU, PU, WHC) is compared against intact skin (dermal and epidermal compartments for intact skin and wound subregions). A global comparison of the means was performed using Kruskal–Wallis test used to determine significance.
FIGURE 3
FIGURE 3
Multidimensional scaling plot to visualize wound subregions. A multidimensional scaling (MDS) plot presenting the first two dimensions displayed the data associated with wound subregions (aggregated across wound type) and intact skin. The MDS plot was generated based on averaging the gene expression values per patient, subregion to highlight a specific subregion trajectory. Each point represented the average gene expression for each sample (see legend at top right).
FIGURE 4
FIGURE 4
Global analysis of the transcriptomes of wound tissue versus intact skin. (A) Gene expression in wounds (aggregated wound bed, wound border and peri‐wound samples) compared with intact skin. The x‐axis specifies log2 fold changes (FC), and the y‐axis specifies the −log10 of the Benjamini–Hochberg‐adjusted p‐values (false discovery rate). The black vertical and horizontal lines reflect the filtering criteria, including a fold change (FC) > +2.0 (log2[FC] >1) to indicate upregulated transcripts (n = 1870) and log2[FC] > −1 to indicate downregulated expression (n = 2159). The genes highlighted are those described in the study and include those that were identified as most prominently up‐ and downregulated. (B) Heatmap clustering of highlighted genes shown in A. Shown is the average and scaled level of highlighted differentially expressed genes associated with a Benjamini–Hochberg‐adjusted p‐value of <0.01. Gene expression values are coloured from blue (low) to white (moderate) to red (high) based on the quantiles shown in the legend (at right) with individual genes shown in each row. Values in each column (log10[RPKM]) correspond to specific wound subregions (bed, border and peri‐wound) and intact skin. The column dendrogram was calculated based on a Pearson distance metric.
FIGURE 5
FIGURE 5
Molecular pathways and processes dysregulated in human chronic wounds and WHCs. (A) Heatmap clustering of pairwise comparisons of up‐ and downregulated pathways enriched in each wound subregion versus intact skin. Gene set enrichment analysis (GSEA) was performed using Biosystem, Interpro, and Gene Ontology sets, and only upregulated genes compared against intact skin were included for further analysis. The rows correspond to enriched pathways, and columns correspond to comparisons of wound subregions with intact skin. The column dendrogram is calculated using the Euclidean distance metric generated from the enrichment results for each comparison. The scaled, log10 converted enrichment results are colour‐coded (blue: downregulated enriched, white: not regulated, red: upregulated enriched; see the legend, top right). (B) Summary of some of the dysregulated pathways with enrichment results, grouped by biological area. (C) Radar plot displaying a selection of biological processes/pathways enriched across the different wound regions compared to intact skin samples. The selected pathways (color‐coded, top right) include cornification, Leishmaniasis, positive regulation of angiogenesis, regulation of immune response and VEGF receptor signalling pathway, representing the various processes dysregulated in chronic wounds and WHCs.
FIGURE 6
FIGURE 6
Differential expression of genes associated with the wound phenotype. Bar chart visualization of differently expressed genes in subregions of wounds. The genes were categorized into three groups, including (A) inflammation, (B) vascularization and (C) re‐epithelization. Each graph represents the expression (in RPKM) of the gene shown at the top of each plot. The bars are colour‐coded by wound subregion (legend on the right). The fold changes (FCs) displayed within each graph were generated by a comparison between expression levels in the specific wound subregion compared to intact skin. Relevant p‐values are represented by asterisks as per the legend on the bottom right. Detection of immunoreactive (D) S100A8/9 and (E) TMPRSS11D in intact skin and LUs, PUs and WHCs. HE‐stained tissues representing the various ulcer types are shown on the right side of each panel; DAPI was used to stain cell nuclei. Tissue samples were 1,2,9,10, intact skin (00082, visit 1); 3,4,11,12, LU (50 037, visit 1); 5,6,13,14, PU (50 051, visit 1); 7,8,15,16, WHC (50 050, visit 2). Black scale bars, 500 μm; white scale bars, 100 μm. (F) Analysis of IL‐6 mRNA using an RNAscope probe (1–5, red) and ACTA2 protein by IHC (6–9, brown) expression in wounds (1,6, LU [50 037, visit 1]; 2,7, WHC [50 050, visit 2]; 3,8, PU [50 051, visit 1]; 4,9, FU [50 038, visit 1]) and intact skin (5,10, brown; [00108, visit 1]). Haematoxylin was used to counterstain the sections. Magnified insets in each panel at the bottom right denote representative areas depicted in each panel. Scale bars are indicated in each panel and magnified inset, respectively; scale bars in panels, 500 μm; scale bars in insets, 50 μm.
FIGURE 7
FIGURE 7
Logistic regression of cell type abundance to classify wound subregions. (A) Cell types involved in wound healing and shown in Supplementary Table 7 were inferred utilizing the xCell R library. Each graph denotes the expression of the cohort of genes that represent the cell type shown in the header. Each bar represents the scaled average expression (RPKM) for each subregion (see legend, bottom left). Each dot represents the average expression of a given gene (RPKM) that contributes to the identification of the cell type. (B) Elastic Net logistic regression analysis was used to identify candidate classification markers for specifically discriminating wound subregions and assessing using the AUC values as shown. The genes shown were selected from the subset identified by this method (using the shrinkage term within ElasticNet methods), as examples to explore their discriminatory power. Each bar represents the scaled median expression value for specific gene expression markers for each subregion identified (legend in A). Identified candidate marker genes differentiated between the various subregions. ACPT is a marker gene that was decreased in all three wound subregions compared to intact skin (AUC = 1.00). DC, dendritic cells; aDC, activated dendritic cells; cDC, conventional/classical dendritic cells; iDC, interstitial dendritic cells.
FIGURE 8
FIGURE 8
Molecular comparisons across different wound types. (A) Heatmap clustering of enriched regulated pathways detected for each wound type versus intact skin. The following comparisons are shown, PU, LU, FU and WHC versus intact skin, each, WHC versus PU and LU versus PU. Biosystem, Interpro, and Gene Ontology sets were used for gene set enrichment analysis (GSEA). Upregulated genes identified in pairwise comparisons were included in this analysis. The rows correspond to enriched pathways and columns correspond to comparisons between ulcer types. The column dendrogram was generated using the Euclidean distance metric based on the enrichment results for each comparison. The scaled, log10 transformed, enrichment results are colour‐coded (blue, downregulated enriched; white, not regulated; red, upregulated enriched; see legend, top right). The heatmap highlights the difference in enrichment results based on comparisons between ulcer types. (B) Scatter plot illustrating the correlations linking PUs and WHCs using global gene expression values (i.e., scaled RPKMs) with a Pearson correlation of 0.92 (p‐value, <2e−16) indicating a high degree of similarity. Genes highlighted here are those representing the most prominent differences between the two ulcer types. (C) Increased expression of PITX1 and UPP1 in LUs and FUs. Bar graphs illustrating the average expression (RPKM) of PITX1 and UPP1, across the various ulcer types. The bars are colour‐coded by ulcer type (legend top). Each dot represents the average gene expression for one donor. Error bars represent the standard deviation of gene expression across all donors. Expression levels of both PITX1 and UPP1 were elevated in LUs and FUs compared to other wound types and intact skin.
FIGURE 9
FIGURE 9
Upregulated expression of C10orf99 in chronic wounds and WHC. Expression of C10orf99 (encoding GPR15L) was significantly increased in LUs, FUs, PUs and WHCs. (A) Levels of C10orf99 mRNA were aggregated from both wound border and bed subregions. Each bar represented the median level of C10orf99 expression for each ulcer type as shown in the legend, top right. Each dot represented the average C10orf99 expression for each subject. (B) Average C10orf99 levels of all ulcer types as shown in A were higher in the wound border compared to the wound bed. The graph highlighted the median expression levels of C10orf99 in each subregion, colour‐coded as shown in the legend on the top left. (C) Increased levels of GPR15L detected in chronic wounds and WHCs compared to intact skin. HE‐stained tissues representing each wound type and intact skin are shown on the right. Signal specificity was confirmed by the omission of the anti‐GPR15L antibody for each tissue type (middle panel). Tissue samples 1,2,3, intact skin (00099, visit 1); 4,5,6, LU (50 037, visit 1); 7,8,9, PU (50 051, visit 1); 10,11,12, FU (50 002, visit 1); 13,14,15, WHC (50 050, visit 2). Black scale bars, 500 μm; white scale bars, 100 μm. (D) Anti‐GPR15L staining of a full LU section revealed increased levels of immunoreactive protein in the wound border compared to the wound bed. Top, HE; bottom, IHC). Tissue samples 16,17, LU (50 037, visit 1). Black scale bar, 2500 μm; white scale bar, 1000 μm.

References

    1. Eming SA, Martin P, Tomic‐Canic M. Wound repair and regeneration: mechanisms, signaling, and translation. Sci Transl Med. 2014;6:265sr6. - PMC - PubMed
    1. Nunan R, Harding KG, Martin P. Clinical challenges of chronic wounds: searching for an optimal animal model to recapitulate their complexity. DMM Dis Model Mech. 2014;7:1205‐1213. - PMC - PubMed
    1. Järbrink K, Ni G, Sönnergren H, et al. The humanistic and economic burden of chronic wounds: a protocol for a systematic review. Syst Rev. 2017;6:15. - PMC - PubMed
    1. Frykberg RG, Banks J. Challenges in the treatment of chronic wounds. Adv Wound Care. 2015;4:560‐582. - PMC - PubMed
    1. Sørensen LT, Hemmingsen U, Kallehave F, et al. Risk factors for tissue and wound complications in gastrointestinal surgery. Ann Surg. 2005;241:654‐658. doi:10.1097/01.sla.0000157131.84130.12 - DOI - PMC - PubMed