. 2024 May 1;5(3):164-179.
doi: 10.1158/2643-3230.BCD-23-0106.

Acute Lymphoblastic Leukemia with Myeloid Mutations Is a High-Risk Disease Associated with Clonal Hematopoiesis

Affiliations

Acute Lymphoblastic Leukemia with Myeloid Mutations Is a High-Risk Disease Associated with Clonal Hematopoiesis

Caner Saygin et al. Blood Cancer Discov. .

Abstract

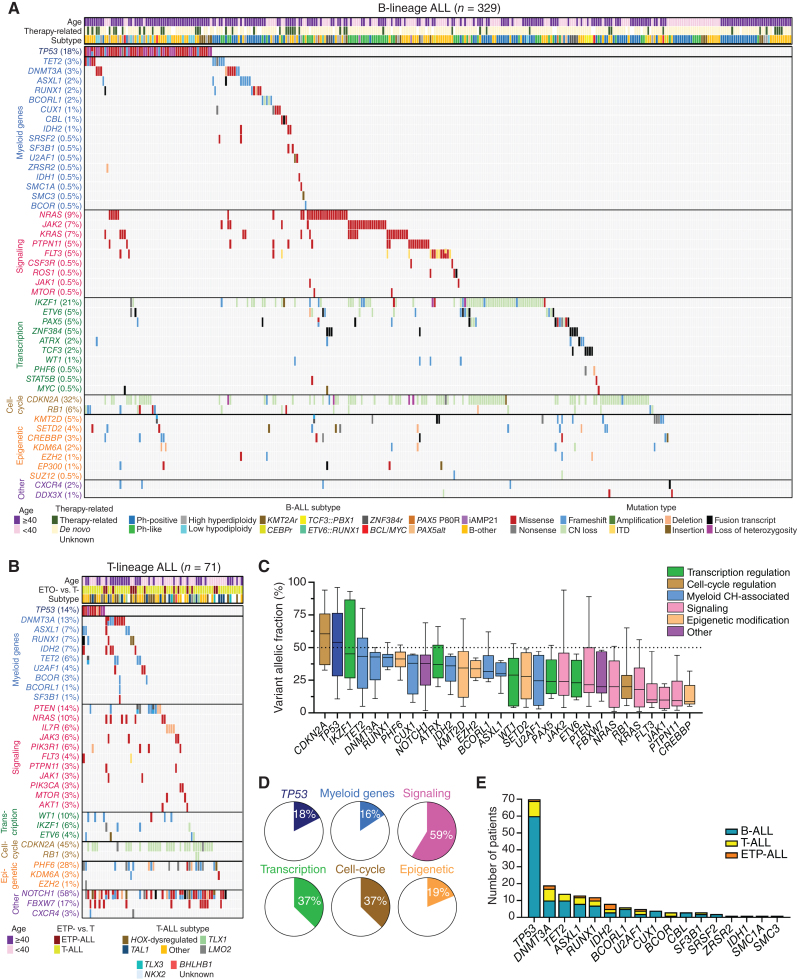
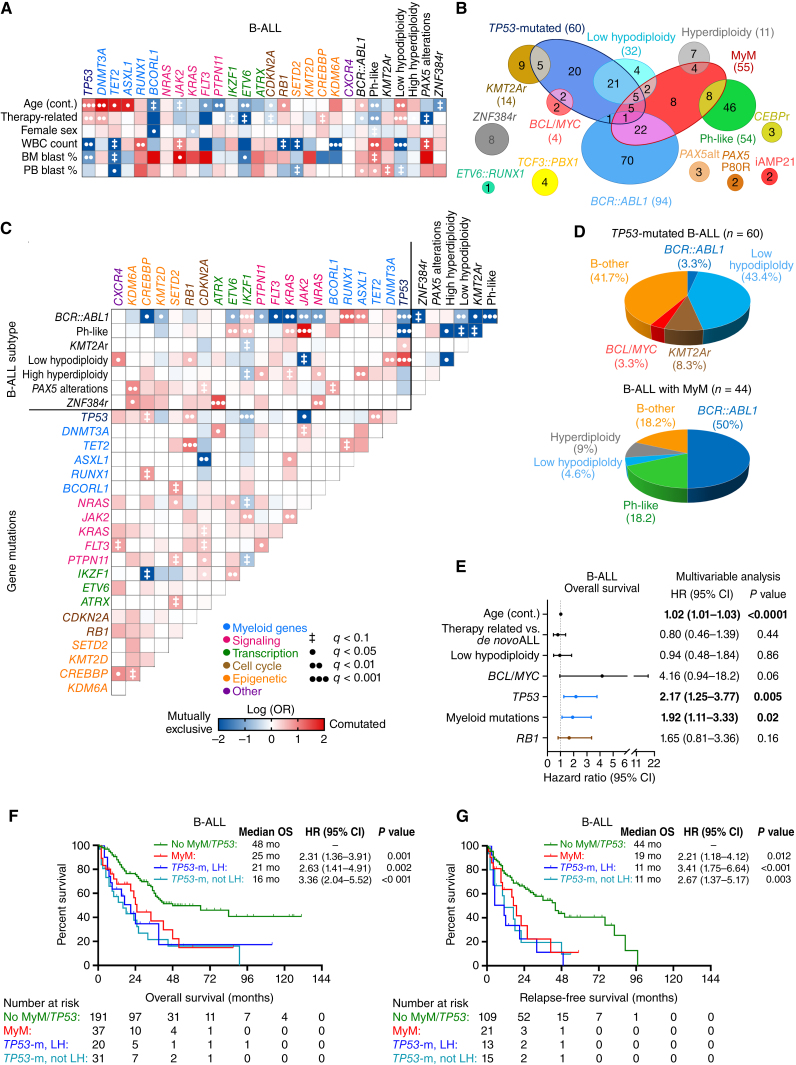
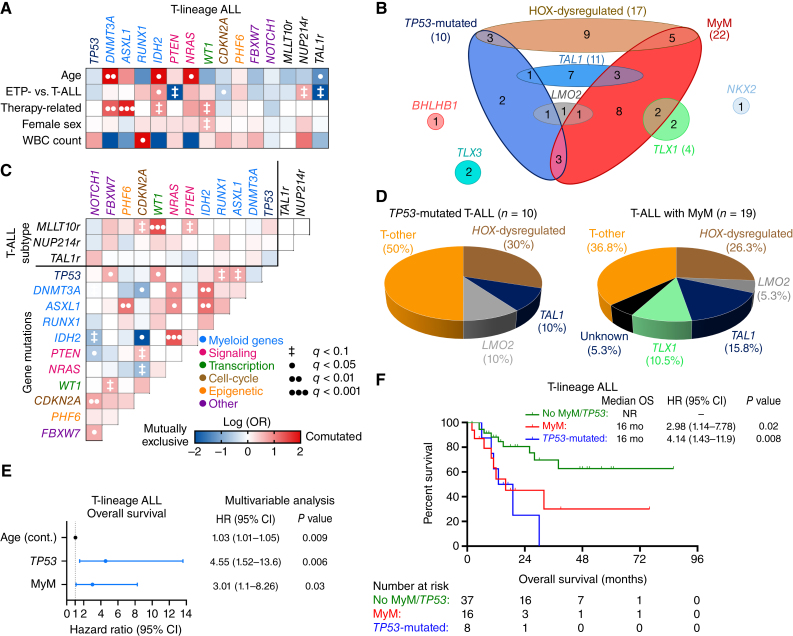
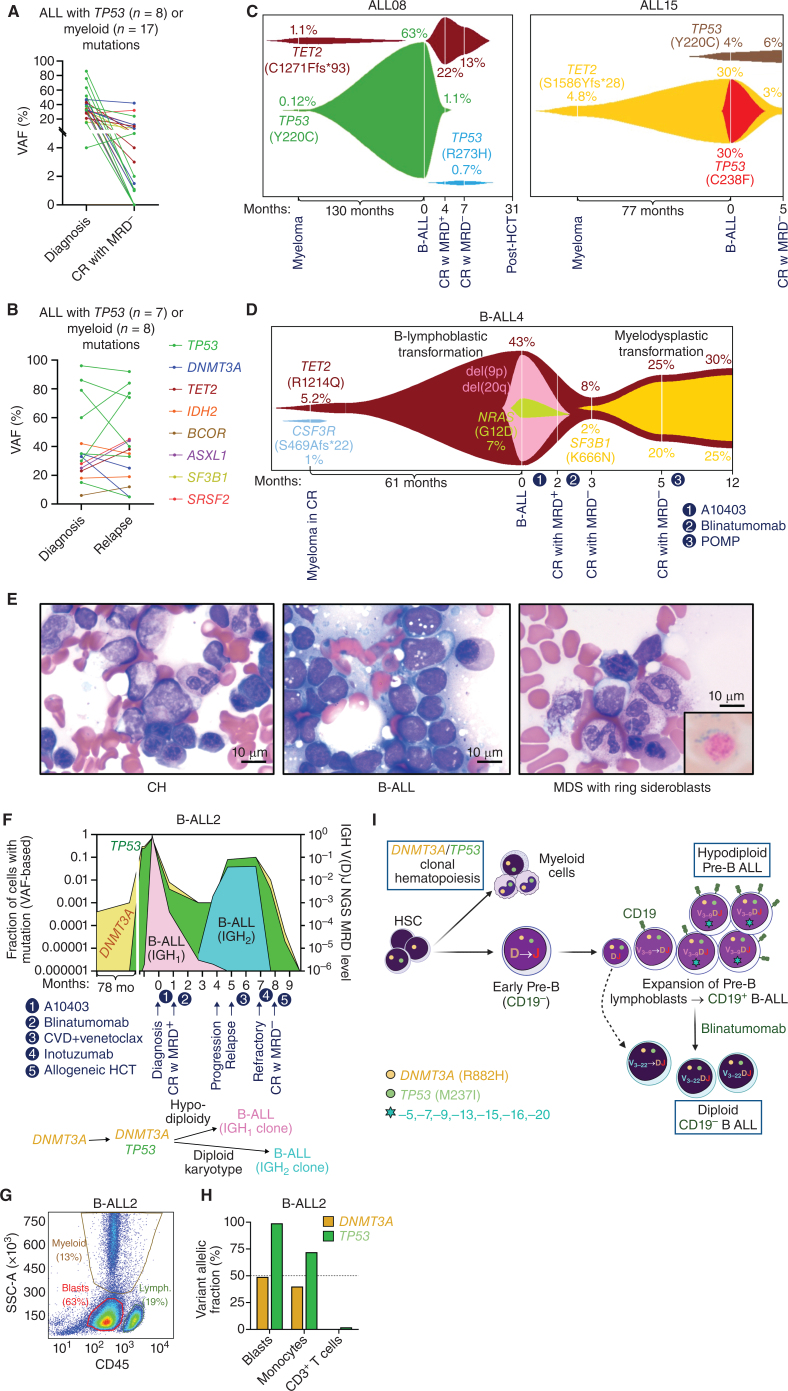
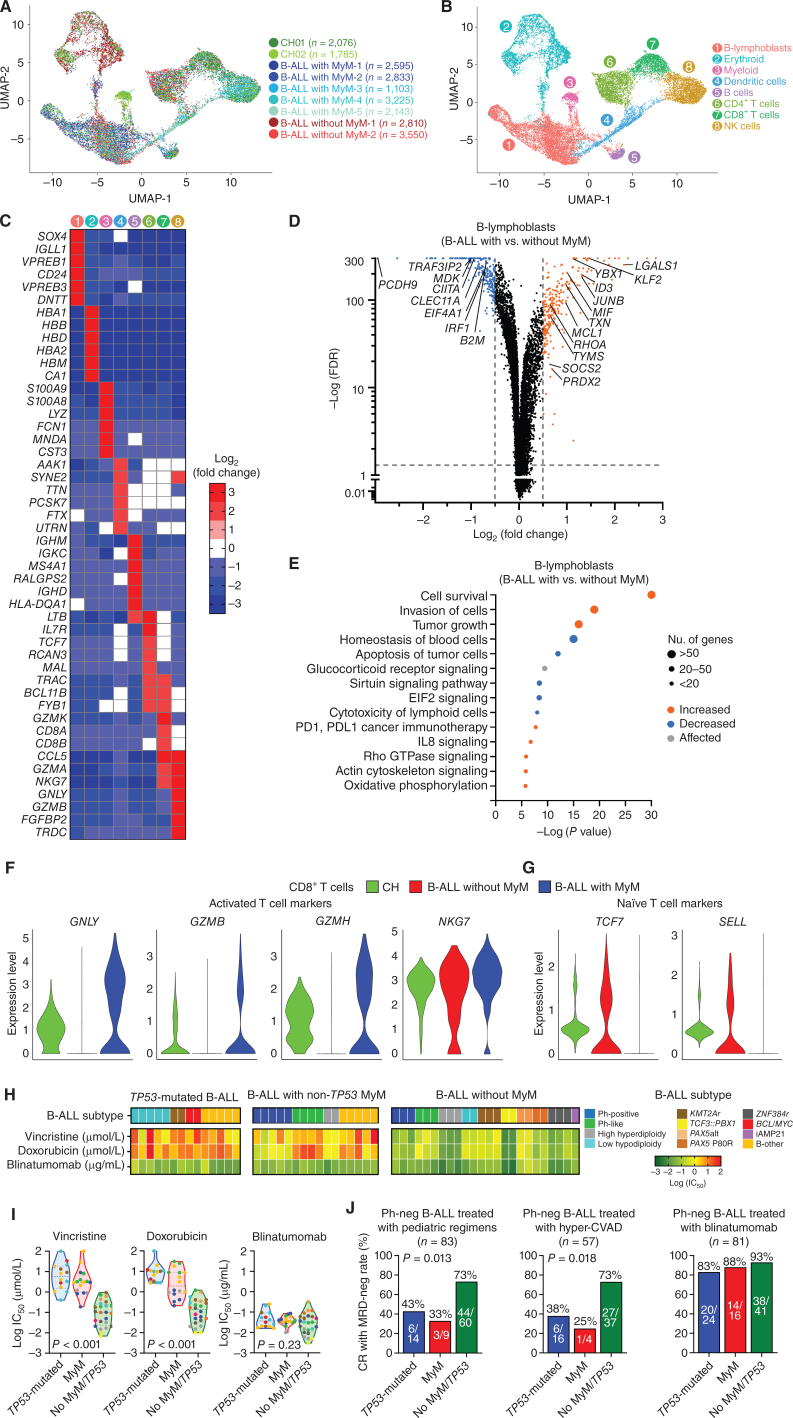
Myeloid neoplasms arise from preexisting clonal hematopoiesis (CH); however, the role of CH in the pathogenesis of acute lymphoblastic leukemia (ALL) is unknown. We found that 18% of adult ALL cases harbored TP53, and 16% had myeloid CH-associated gene mutations. ALL with myeloid mutations (MyM) had distinct genetic and clinical characteristics, associated with inferior survival. By using single-cell proteogenomic analysis, we demonstrated that myeloid mutations were present years before the diagnosis of ALL, and a subset of these clones expanded over time to manifest as dominant clones in ALL. Single-cell RNA sequencing revealed upregulation of genes associated with cell survival and resistance to apoptosis in B-ALL with MyM, which responds better to newer immunotherapeutic approaches. These findings define ALL with MyM as a high-risk disease that can arise from antecedent CH and offer new mechanistic insights to develop better therapeutic and preventative strategies.

Significance: CH is a precursor lesion for lymphoblastic leukemogenesis. ALL with MyM has distinct genetic and clinical characteristics, associated with adverse survival outcomes after chemotherapy. CH can precede ALL years before diagnosis, and ALL with MyM is enriched with activated T cells that respond to immunotherapies such as blinatumomab. See related commentary by Iacobucci, p. 142.


Figures

Figure 1. Myeloid mutations are frequent in adult patients with ALL. A and B, Oncoprints showing the spectrum of mutations and cytogenetic abnormalities in adult patients with B-lineage and T-lineage ALL. C, The boxplot shows the median, 25th and 75th percentiles, and minimum and maximum variant allelic frequency (VAF) observed across the entire cohort of 400 patients. Boxes are colored according to the functional category assigned to each gene. The black dashed line marks an allele frequency of 50%, the expected VAF for a heterozygous variant present in all cells in the specimen. D, The frequencies of mutations for the six main categories of gene groups for the entire cohort. E, The distribution of mutations in 17 myeloid genes across the ALL cases of different lineages. CH, clonal hematopoiesis; ETP, early T-precursor.
Figure 1.
Myeloid mutations are frequent in adult patients with ALL. A and B, Oncoprints showing the spectrum of mutations and cytogenetic abnormalities in adult patients with B-lineage and T-lineage ALL. C, The box plot shows the median, 25th and 75th percentiles, and minimum and maximum variant allelic frequency (VAF) observed across the entire cohort of 400 patients. Boxes are colored according to the functional category assigned to each gene. The black dashed line marks an allele frequency of 50%, the expected VAF for a heterozygous variant present in all cells in the specimen. D, The frequencies of mutations for the six main categories of gene groups for the entire cohort. E, The distribution of mutations in 17 myeloid genes across the ALL cases of different lineages.
Figure 2. Clinical and molecular characterization of B-lineage ALL with MyM. A, Associations between gene mutations and clinical characteristics were studied for gene mutations found in ≥5 patients, and statistical significance was assessed using the Fisher exact test for categorical variables and the Wilcoxon rank-sum test for continuous variables, with adjustment for multiple testing. Only those pairings that were significant at an adjusted q < 0.1 are shown. The odds ratio (OR) of the association is color-coded, and the significance level is indicated by the symbol in each field. Shades of red indicate a positive association (i.e., two characteristics that frequently occurred together, or for the association between a mutation and a continuous variable, a higher value in those carrying the mutation). Shades of blue indicate a negative association (i.e., two characteristics that rarely occurred together, or for the association between a mutation and a continuous variable, a lower value in those carrying the mutation). B, Venn diagram showing the relationship between WHO/ICC-established B-ALL subtypes and myeloid mutations. C, Pairwise associations between gene mutations and cytogenetic abnormalities. D, Pie charts showing the distribution of WHO/ICC-established B-ALL subtypes in TP53-mutated B-ALL and B-ALL with MyM. E, Multivariable Cox regression analysis of overall survival (OS) in B-ALL, adjusting for the variables that were significant in univariable analysis (age, therapy-related ALL, TP53 mutation, MyM, and RB1 mutation). F, G, Kaplan–Meier OS and relapse-free survival (RFS) analysis of B-ALL patients stratified into three groups based on their MyM and low hypodiploidy (LH) status. Cox proportional hazards ratios were calculated. BM, bone marrow; CI, confidence interval; HR, hazard ratio; PB, peripheral blood; WBC, white blood cell.
Figure 2.
Clinical and molecular characterization of B-lineage ALL with MyM. A, Associations between gene mutations and clinical characteristics were studied for gene mutations found in ≥5 patients, and statistical significance was assessed using the Fisher exact test for categorical variables and the Wilcoxon rank-sum test for continuous variables, with adjustment for multiple testing. Only those pairings that were significant at an adjusted q < 0.1 are shown. The OR of the association is color-coded, and the significance level is indicated by the symbol in each field. Shades of red indicate a positive association (i.e., two characteristics that frequently occurred together, or for the association between a mutation and a continuous variable, a higher value in those carrying the mutation). Shades of blue indicate a negative association (i.e., two characteristics that rarely occurred together, or for the association between a mutation and a continuous variable, a lower value in those carrying the mutation). B, Venn diagram showing the relationship between WHO/ICC-established B-ALL subtypes and myeloid mutations. C, Pairwise associations between gene mutations and cytogenetic abnormalities. D, Pie charts showing the distribution of WHO/ICC-established B-ALL subtypes in TP53-mutated B-ALL and B-ALL with MyM. E, Multivariable Cox regression analysis of OS in B-ALL, adjusting for the variables that were significant in univariable analysis (age, therapy-related ALL, TP53 mutation, MyM, and RB1 mutation). F and G, Kaplan–Meier OS and relapse-free survival (RFS) analysis of B-ALL patients stratified into three groups based on their MyM and low hypodiploidy (LH) status. Cox proportional hazards ratios were calculated. BM, bone marrow; PB, peripheral blood; WBC, white blood cell.
Figure 3. Clinical and molecular characterization of T-lineage ALL with MyM. A, Associations between gene mutations and clinical characteristics were studied for gene mutations found in ≥5 patients. B, Venn diagram showing the relationship between WHO/ICC-established T-lineage ALL subtypes and myeloid mutations. C, Pairwise associations between gene mutations. D, Pie charts showing the distribution of WHO/ICC-established T-lineage ALL subtypes in TP53-mutated T-ALL and T-ALL with MyM. E, Multivariable Cox regression analysis of overall survival (OS) in T-lineage ALL, adjusting for the variables that were significant in univariable analysis (age, TP53, and DNMT3A mutations). F, Kaplan–Meier OS analysis of T-lineage ALL patients stratified into three groups based on their MyM status. Cox proportional hazards ratios were calculated. BM, bone marrow; CI, confidence interval; HR, hazard ratio; PB, peripheral blood; WBC, white blood cell.
Figure 3.
Clinical and molecular characterization of T-lineage ALL with MyM. A, Associations between gene mutations and clinical characteristics were studied for gene mutations found in ≥5 patients. B, Venn diagram showing the relationship between WHO/ICC-established T-lineage ALL subtypes and MyM. C, Pairwise associations between gene mutations. D, Pie charts showing the distribution of WHO/ICC-established T-lineage ALL subtypes in TP53-mutated T-ALL and T-ALL with MyM. E, Multivariable Cox regression analysis of OS in T-lineage ALL, adjusting for the variables that were significant in univariable analysis (age, TP53, and DNMT3A mutations). F, Kaplan–Meier OS analysis of T-lineage ALL patients stratified into three groups based on their MyM status. Cox proportional hazards ratios were calculated. BM, bone marrow; PB, peripheral blood; WBC, white blood cell.
Figure 4. Single-cell DNA and protein sequencing to study the clonal architecture of ALL with MyM. A, Surface protein heat map of the canonical cell type–specific markers as measured by the Wilcoxon rank-sum test. B, Uniform manifold approximation and projection (UMAP) plot of B-ALL1 sample with cells clustered by immunophenotype. C, Gene mutations overlayed into the individual cells of immunophenotypically defined clusters. Genotype of a given cell is color-coded to indicate wild-type (WT) vs. homozygous (HOM) or heterozygous (HET) mutation status. Black dots indicate cells with unknown genotype. D, Graph showing the fractions of mutated cells in each cluster of B-ALL1. E–G, UMAP plots and mutation distributions in different immunophenotypic compartments of B-ALL3. H–J, UMAP plots and mutation distributions in different immunophenotypic compartments of ETP-ALL1. K–M, UMAP plots and mutation distributions in different immunophenotypic compartments of ETP-ALL2.
Figure 4.
Single-cell DNA and protein sequencing to study the clonal architecture of ALL with MyM. A, Surface protein heat map of the canonical cell type–specific markers as measured by the Wilcoxon rank-sum test. B, Uniform manifold approximation and projection (UMAP) plot of B-ALL1 sample with cells clustered by immunophenotype. C, Gene mutations overlayed into the individual cells of immunophenotypically defined clusters. Genotype of a given cell is color-coded to indicate wild-type (WT) vs. homozygous (HOM) or heterozygous (HET) mutation status. Black dots indicate cells with unknown genotype. D, Graph showing the fractions of mutated cells in each cluster of B-ALL1. E–G, UMAP plots and mutation distributions in different immunophenotypic compartments of B-ALL3. H–J, UMAP plots and mutation distributions in different immunophenotypic compartments of ETP-ALL1. K–M, UMAP plots and mutation distributions in different immunophenotypic compartments of ETP-ALL2.
Figure 5. Evolution of ALL from preexisting clonal hematopoiesis. Analysis of serial diagnosis and MRD-negative CR (A), as well as diagnosis and relapse (B) bone marrow samples revealed the persistence of myeloid clonal hematopoiesis (CH) mutations. C, FISH plots demonstrate that myeloid CH mutations were detectable years before the diagnosis of ALL and presented as dominant clones at ALL diagnosis. D, FISH plot showing the clonal evolution of therapy-related B-ALL and therapy-related myelodysplastic syndrome (MDS) from the same TET2 CH clone at different time points. E, Bone marrow aspirate smears for CH, B-ALL, and MDS with ring sideroblasts. Scale bar, 10 μm. F, Clonal evolution of B-ALL2 from preexisting DNMT3A CH clone, which was detectable 6 years before the diagnosis of DNMT3A/TP53-mutant ALL. G and H, Flow-cytometric analysis of different cellular compartments in B-ALL2, which were genotyped after cell sorting. CH mutations (DNMT3A and TP53) were shared between lymphoblasts and myeloid cells. I, DNMT3A/TP53-mutated, D-J rearranged early pro-B cell gave rise to hypodiploid CD19+ B-ALL2. After treatment with blinatumomab, a CD19-negative clone with a different V(D)J sequence emerged from the earlier diploid pro-B cell with CH mutations (created with BioRender.com). CR, complete remission; HSC, hematopoietic stem cell; MRD, measurable residual disease.
Figure 5.
Evolution of ALL from preexisting CH. Analysis of serial diagnosis and MRD-negative CR (A), as well as diagnosis and relapse (B) bone marrow samples revealed the persistence of myeloid CH mutations. C, FISH plots demonstrate that myeloid CH mutations were detectable years before the diagnosis of ALL and presented as dominant clones at ALL diagnosis. D, FISH plot showing the clonal evolution of therapy-related B-ALL and therapy-related myelodysplastic syndrome (MDS) from the same TET2 CH clone at different time points. E, Bone marrow aspirate smears for CH, B-ALL, and MDS with ring sideroblasts. Scale bar, 10 μm. F, Clonal evolution of B-ALL2 from preexisting DNMT3A CH clone, which was detectable 6 years before the diagnosis of DNMT3A/TP53-mutant ALL. G and H, Flow-cytometric analysis of different cellular compartments in B-ALL2, which were genotyped after cell sorting. CH mutations (DNMT3A and TP53) were shared between lymphoblasts and myeloid cells. I,DNMT3A/TP53-mutated, D-J rearranged early pro-B cell gave rise to hypodiploid CD19+ B-ALL2. After treatment with blinatumomab, a CD19-negative clone with a different V(D)J sequence emerged from the earlier diploid pro-B cell with CH mutations. CR, complete remission; HSC, hematopoietic stem cell; MRD, measurable residual disease. (I, Created with BioRender.com.)
Figure 6. B-lymphoblasts are intrinsically resistant to cytotoxic chemotherapy, but susceptible to immunotherapies in B-ALL with MyM. A, Uniform manifold approximation and projection (UMAP) visualization of 22,120 individual cells from 9 individual primary thawed mononuclear bone marrow samples taken from patients with CH (n = 2), B-ALL with MyM (n = 5), and B-ALL without MyM (n = 2). B, Marker-based cell-type identification analysis allowed the prediction of eight broad hematopoietic cell types across all profiled single cells. C, Gene-expression heat map of the top six cell type–specific marker genes as measured by Wilcoxon rank-sum test. D, Volcano plot showing differential expression of genes in B-lymphoblasts from B-ALL with MyM vs. B-ALL without MyM. E, Major pathways predicted to be differentially regulated in B-lymphoblasts from B-ALL with MyM vs. B-ALL without MyM, assessed by Ingenuity Pathway Analysis. F and G, Relative expression of activated vs. naïve T-cell markers between patients with CH, B-ALL without MyM, and B-ALL with MyM. H and I, Heat maps and violin plots showing log(IC50) values for primary human B-ALL samples with TP53 mutation (n = 14), non-TP53 MyM (n = 16), and no MyM (n = 24), treated with vincristine, doxorubicin, and blinatumomab at escalating doses. J, Rates of measurable residual disease (MRD)-negative complete remission (CR) in B-ALL patients with vs. without MyM treated with cytotoxic chemotherapy (vincristine and doxorubicin) and blinatumomab. HyperCVAD, combination chemotherapy consisting of cyclophosphamide, vincristine, adriamycin, and dexamethasone.
Figure 6.
B-lymphoblasts are intrinsically resistant to cytotoxic chemotherapy, but susceptible to immunotherapies in B-ALL with MyM. A, Uniform manifold approximation and projection (UMAP) visualization of 22,120 individual cells from 9 individual primary thawed mononuclear bone marrow samples taken from patients with CH (n = 2), B-ALL with MyM (n = 5), and B-ALL without MyM (n = 2). B, Marker-based cell-type identification analysis allowed the prediction of eight broad hematopoietic cell types across all profiled single cells. C, Gene-expression heat map of the top six cell type–specific marker genes as measured by Wilcoxon rank-sum test. D, Volcano plot showing differential expression of genes in B-lymphoblasts from B-ALL with MyM vs. B-ALL without MyM. E, Major pathways predicted to be differentially regulated in B-lymphoblasts from B-ALL with MyM vs. B-ALL without MyM, assessed by Ingenuity Pathway Analysis. F and G, Relative expression of activated vs. naïve T-cell markers between patients with CH, B-ALL without MyM, and B-ALL with MyM. H and I, Heat maps and violin plots showing log(IC50) values for primary human B-ALL samples with TP53 mutation (n = 14), non-TP53 MyM (n = 16), and no MyM (n = 24), treated with vincristine, doxorubicin, and blinatumomab at escalating doses. J, Rates of measurable residual disease (MRD)-negative complete remission (CR) in B-ALL patients with vs. without MyM treated with cytotoxic chemotherapy (vincristine and doxorubicin) and blinatumomab. HyperCVAD, combination chemotherapy consisting of cyclophosphamide, vincristine, adriamycin, and dexamethasone.

References

    1. Brown PA, Shah B, Advani A, Aoun P, Boyer MW, Burke PW, et al. . Acute lymphoblastic leukemia, version 2.2021, NCCN clinical practice guidelines in oncology. J Natl Compr Canc Netw 2021;19:1079–109. - PubMed
    1. Advani AS. Novel strategies in the treatment of acute lymphoblastic leukaemia. Lancet Haematol 2022;9:e240–e1. - PubMed
    1. Siegel RL, Miller KD, Fuchs HE, Jemal A. Cancer statistics, 2022. CA Cancer J Clin 2022;72:7–33. - PubMed
    1. Paietta E, Roberts KG, Wang V, Gu Z, Buck GAN, Pei D, et al. . Molecular classification improves risk assessment in adult BCR-ABL1-negative B-ALL. Blood 2021;138:948–58. - PMC - PubMed
    1. Kimura S, Mullighan CG. Molecular markers in ALL: clinical implications. Best Pract Res Clin Haematol 2020;33:101193. - PMC - PubMed

Publication types