

Comparative impact assessment of COVID-19 policy interventions in five South Asian countries using reported and estimated unreported death counts during 2020-2021
- PMID: 38150465
- PMCID: PMC10752546
- DOI: 10.1371/journal.pgph.0002063
Comparative impact assessment of COVID-19 policy interventions in five South Asian countries using reported and estimated unreported death counts during 2020-2021
Abstract
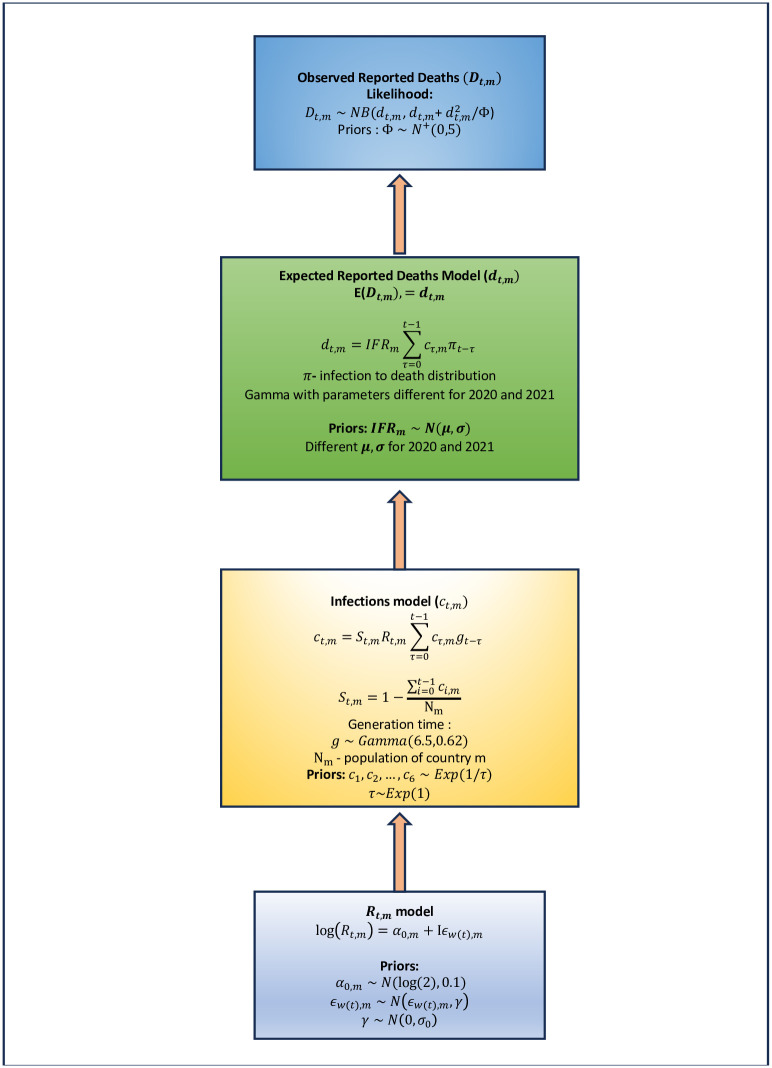
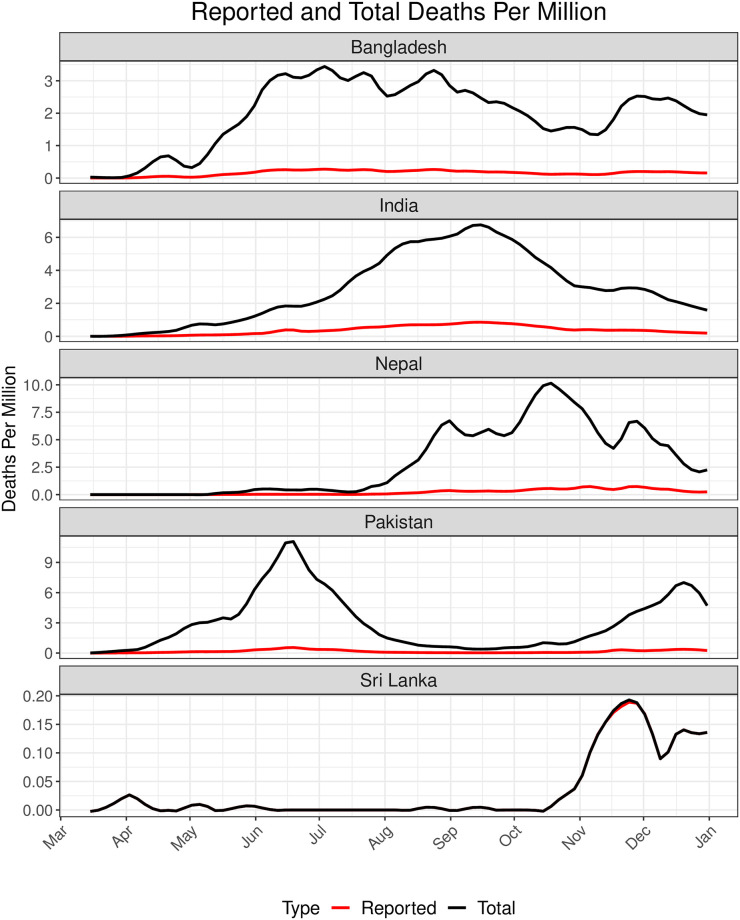
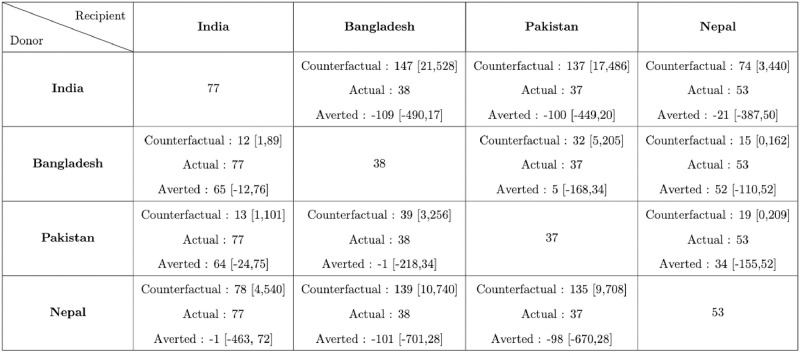
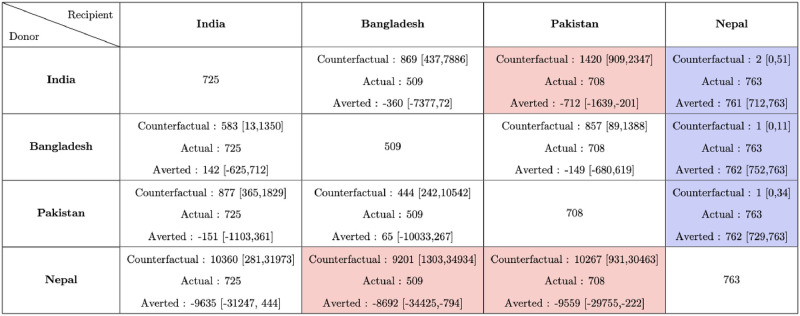
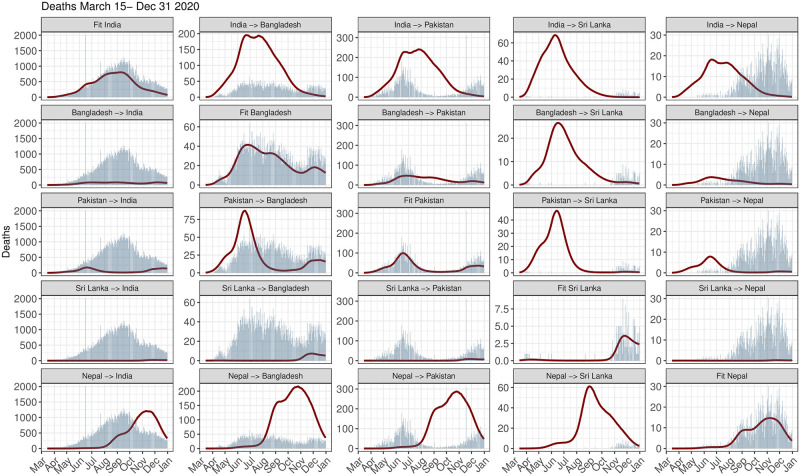
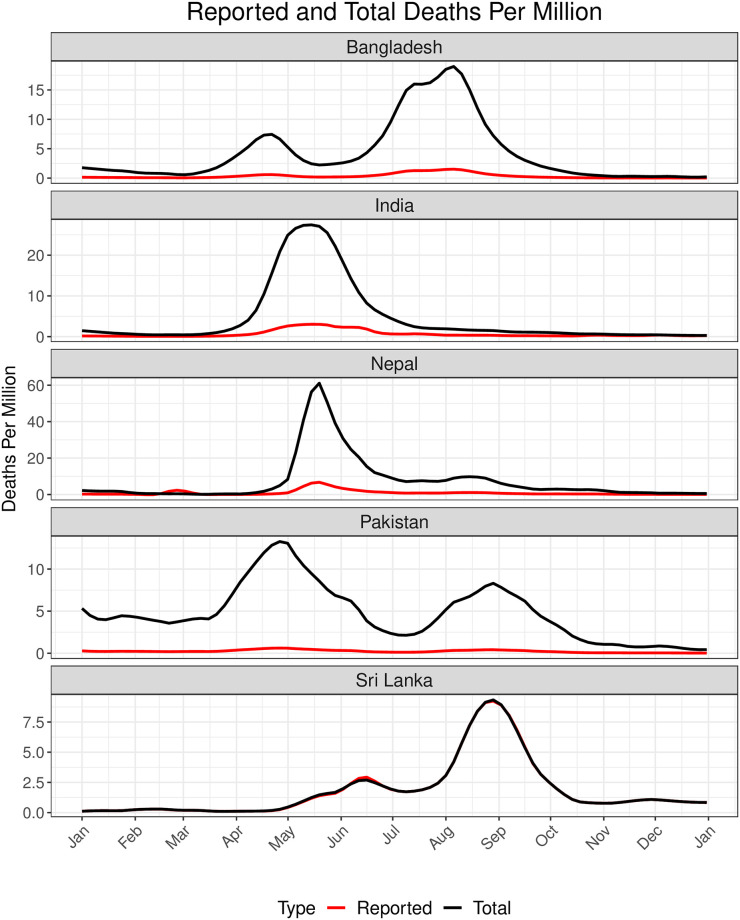
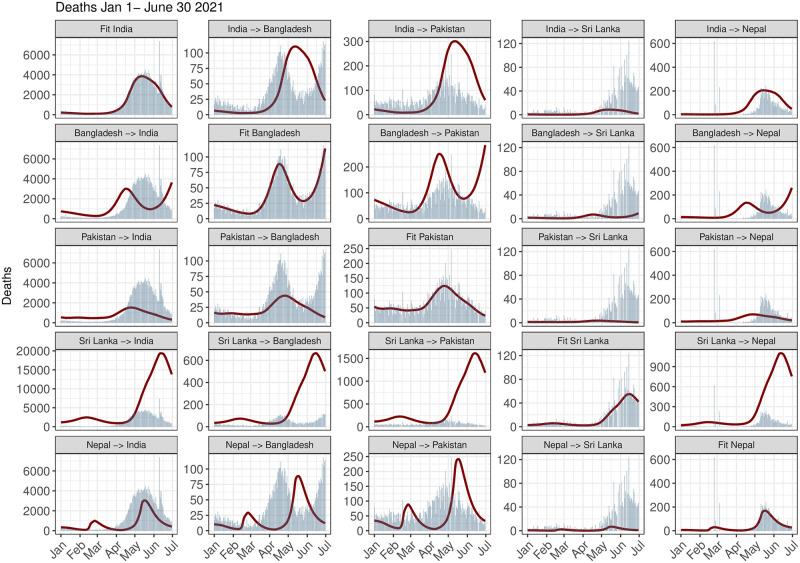
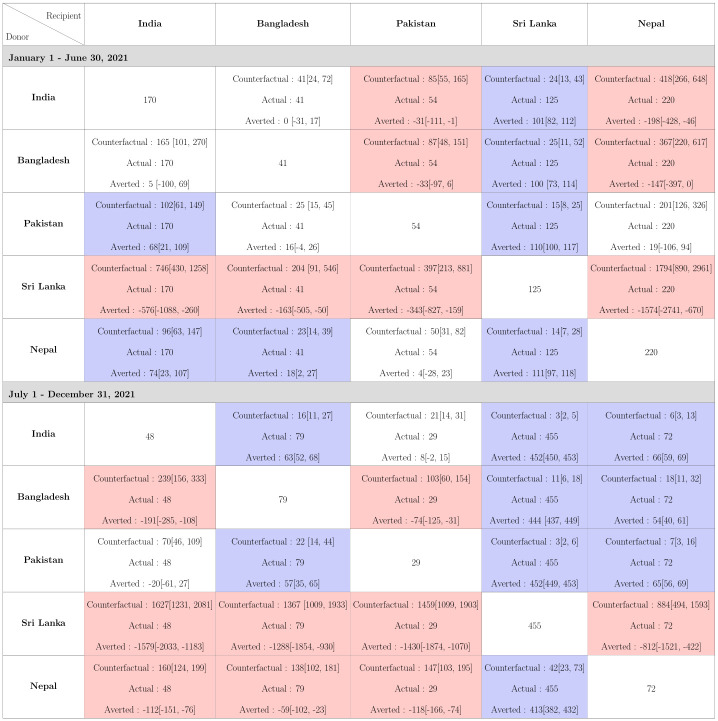
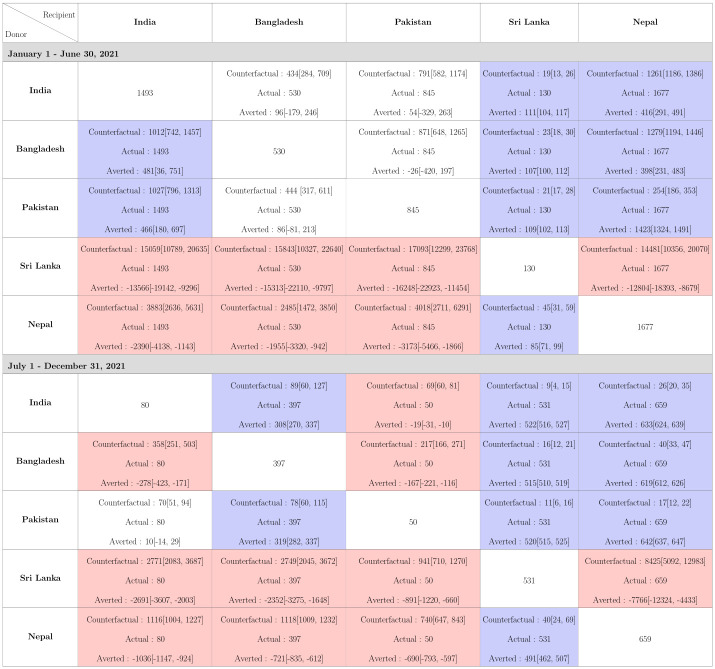
There has been raging discussion and debate around the quality of COVID death data in South Asia. According to WHO, of the 5.5 million reported COVID-19 deaths from 2020-2021, 0.57 million (10%) were contributed by five low and middle income countries (LMIC) countries in the Global South: India, Pakistan, Bangladesh, Sri Lanka and Nepal. However, a number of excess death estimates show that the actual death toll from COVID-19 is significantly higher than the reported number of deaths. For example, the IHME and WHO both project around 14.9 million total deaths, of which 4.5-5.5 million were attributed to these five countries in 2020-2021. We focus our gaze on the COVID-19 performance of these five countries where 23.5% of the world population lives in 2020 and 2021, via a counterfactual lens and ask, to what extent the mortality of one LMIC would have been affected if it adopted the pandemic policies of another, similar country? We use a Bayesian semi-mechanistic model developed by Mishra et al. (2021) to compare both the reported and estimated total death tolls by permuting the time-varying reproduction number (Rt) across these countries over a similar time period. Our analysis shows that, in the first half of 2021, mortality in India in terms of reported deaths could have been reduced to 96 and 102 deaths per million compared to actual 170 reported deaths per million had it adopted the policies of Nepal and Pakistan respectively. In terms of total deaths, India could have averted 481 and 466 deaths per million had it adopted the policies of Bangladesh and Pakistan. On the other hand, India had a lower number of reported COVID-19 deaths per million (48 deaths per million) and a lower estimated total deaths per million (80 deaths per million) in the second half of 2021, and LMICs other than Pakistan would have lower reported mortality had they followed India's strategy. The gap between the reported and estimated total deaths highlights the varying level and extent of under-reporting of deaths across the subcontinent, and that model estimates are contingent on accuracy of the death data. Our analysis shows the importance of timely public health intervention and vaccines for lowering mortality and the need for better coverage infrastructure for the death registration system in LMICs.
Copyright: © 2023 Kundu et al. This is an open access article distributed under the terms of the Creative Commons Attribution License, which permits unrestricted use, distribution, and reproduction in any medium, provided the original author and source are credited.
Conflict of interest statement
The authors have declared that no competing interests exist.
Figures
Similar articles
-
Estimating excess mortality due to the COVID-19 pandemic: a systematic analysis of COVID-19-related mortality, 2020-21.Lancet. 2022 Apr 16;399(10334):1513-1536. doi: 10.1016/S0140-6736(21)02796-3. Epub 2022 Mar 10. Lancet. 2022. PMID: 35279232 Free PMC article.
-
Fertility levels and trends in South Asia: an assessment and prospects.Genus. 1992 Jan-Jun;48(1-2):133-54. Genus. 1992. PMID: 12317864
-
Tracking excess mortality across countries during the COVID-19 pandemic with the World Mortality Dataset.Elife. 2021 Jun 30;10:e69336. doi: 10.7554/eLife.69336. Elife. 2021. PMID: 34190045 Free PMC article.
-
Health and socioeconomic resource provision for older people in South Asian countries: Bangladesh, India, Nepal, Pakistan and Sri Lanka evidence from NEESAMA.Glob Health Action. 2023 Dec 31;16(1):2110198. doi: 10.1080/16549716.2022.2110198. Glob Health Action. 2023. PMID: 36537796 Free PMC article. Review.
-
State of neonatal health care in eight countries of the SAARC region, South Asia: how can we make a difference?Paediatr Int Child Health. 2015 Aug;35(3):174-86. doi: 10.1179/2046905515Y.0000000046. Epub 2015 Jul 27. Paediatr Int Child Health. 2015. PMID: 26212573 Review.
Cited by
-
Mpox awareness and vaccination willingness among a household cohort in Matlab, Bangladesh.Trans R Soc Trop Med Hyg. 2025 Jul 1;119(7):697-724. doi: 10.1093/trstmh/traf004. Trans R Soc Trop Med Hyg. 2025. PMID: 40036231
-
The role of financial stress, food insecurity, and COVID-19-related illness concerns shaping mental health in five South Asian countries during the pandemic (2020-2022): A secondary analysis of the online COVID-19 Trends and Impact Survey (CTIS) data.PLOS Glob Public Health. 2025 Aug 8;5(8):e0004704. doi: 10.1371/journal.pgph.0004704. eCollection 2025. PLOS Glob Public Health. 2025. PMID: 40779535 Free PMC article.
References
-
- Younus U. The Impact of COVID-19 on South Asian Economies; 2021.
-
- Bhattacharya M, Sharma AR, Dhama K, Agoramoorthy G, Chakraborty C. Hybrid immunity against COVID-19 in different countries with a special emphasis on the Indian scenario during the Omicron period. International Immunopharmacology. 2022. Jul 1;108:108766. doi: 10.1016/j.intimp.2022.108766 - DOI - PMC - PubMed
Grants and funding
LinkOut - more resources
Full Text Sources
Miscellaneous