. 2024 Apr 1;108(4):898-910.
doi: 10.1097/TP.0000000000004877. Epub 2023 Dec 27.

Distinct Molecular Processes Mediate Donor-derived Cell-free DNA Release From Kidney Transplants in Different Disease States

Collaborators, Affiliations

Distinct Molecular Processes Mediate Donor-derived Cell-free DNA Release From Kidney Transplants in Different Disease States

Patrick T Gauthier et al. Transplantation. .

Erratum in

Abstract

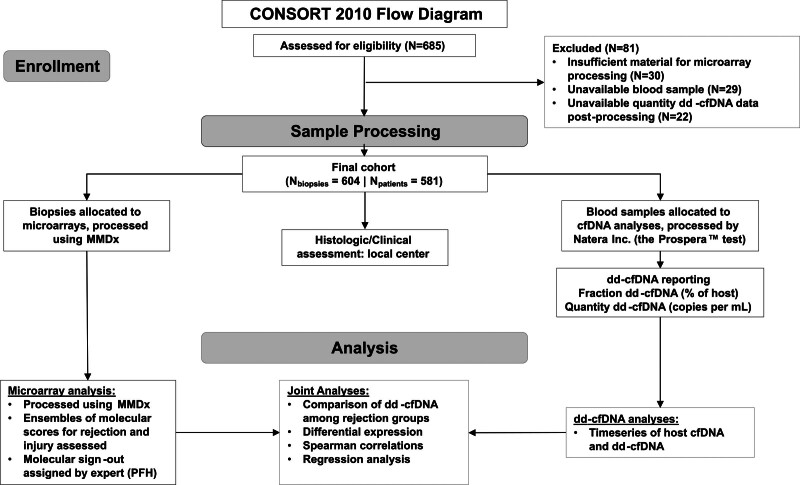
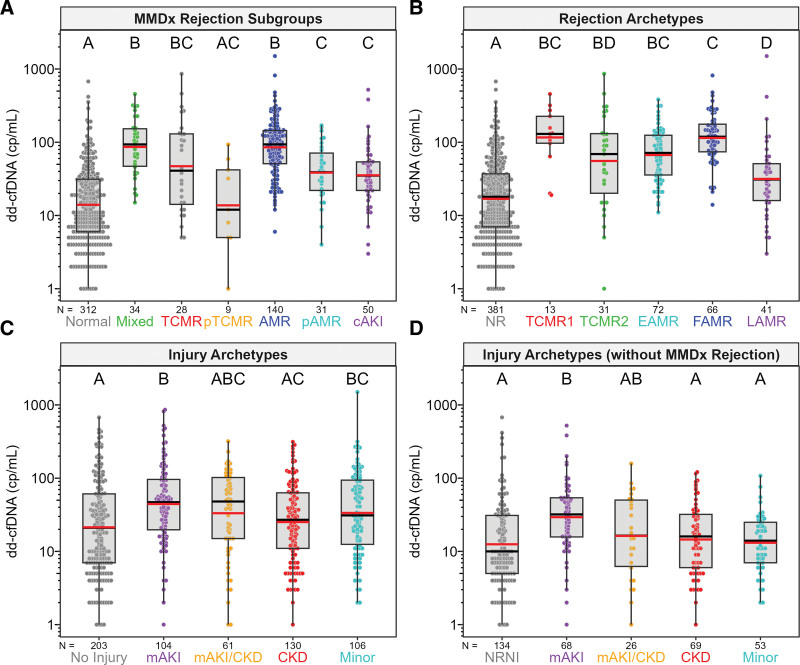
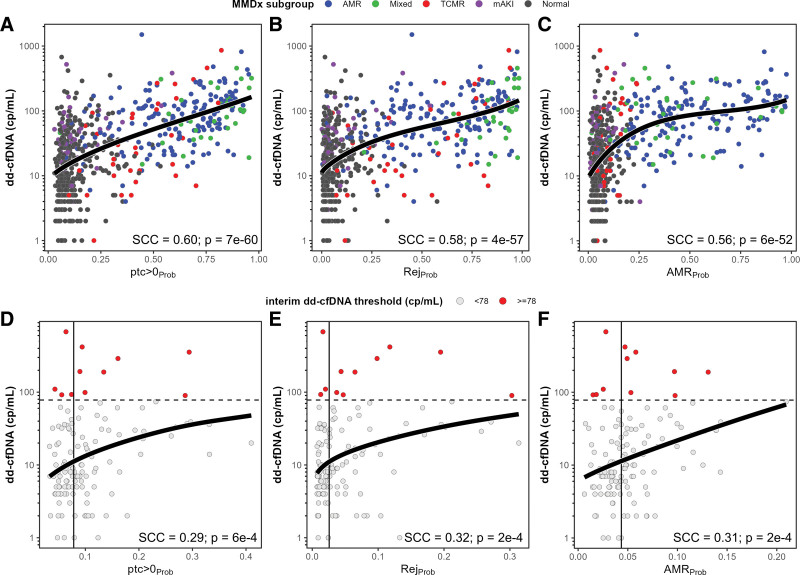
Background: Among all biopsies in the Trifecta-Kidney Study ( ClinicalTrials.gov NCT04239703), elevated plasma donor-derived cell-free DNA (dd-cfDNA) correlated most strongly with molecular antibody-mediated rejection (AMR) but was also elevated in other states: T cell-mediated rejection (TCMR), acute kidney injury (AKI), and some apparently normal biopsies. The present study aimed to define the molecular correlates of plasma dd-cfDNA within specific states.

Methods: Dd-cfDNA was measured by the Prospera test. Molecular rejection and injury states were defined using the Molecular Microscope system. We studied the correlation between dd-cfDNA and the expression of genes, transcript sets, and classifier scores within specific disease states, and compared AMR, TCMR, and AKI to biopsies classified as normal and no injury (NRNI).

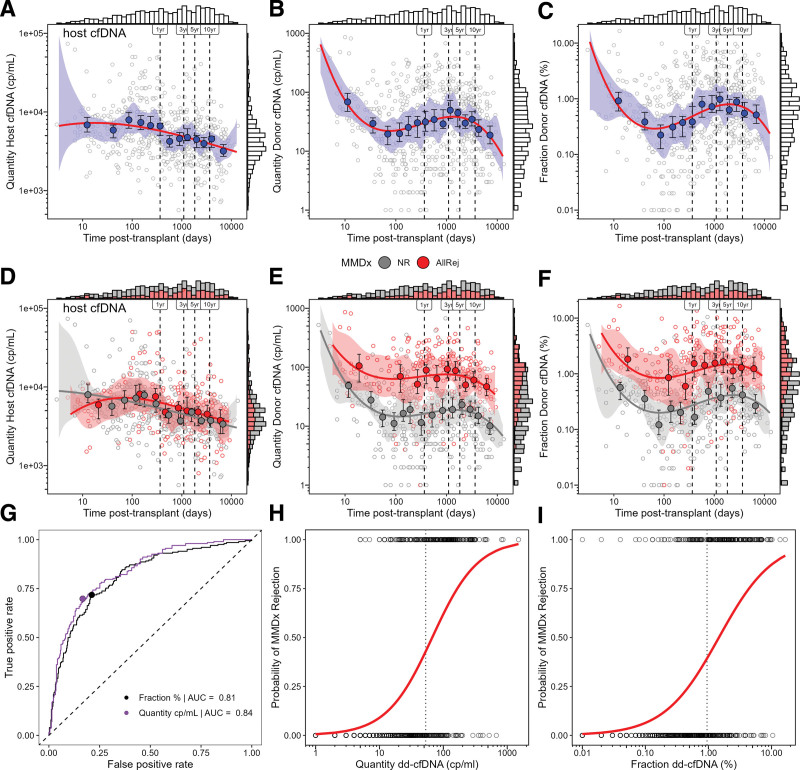
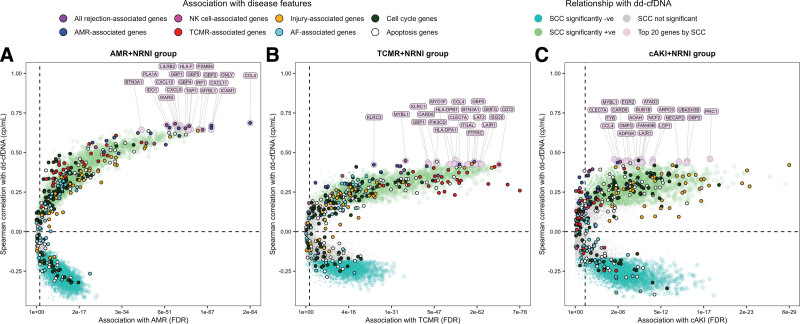
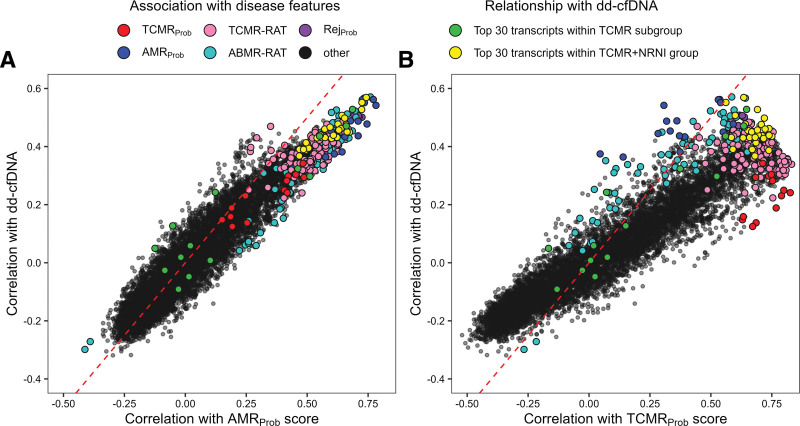
Results: In all 604 biopsies, dd-cfDNA was elevated in AMR, TCMR, and AKI. Within AMR biopsies, dd-cfDNA correlated with AMR activity and stage. Within AKI, the correlations reflected acute parenchymal injury, including cell cycling. Within biopsies classified as MMDx Normal and archetypal No injury (NRNI), dd-cfDNA still correlated significantly with rejection- and injury-related genes. TCMR activity (eg, the TCMR Prob classifier) correlated with dd-cfDNA, but within TCMR biopsies, top gene correlations were complex and not the top TCMR-selective genes.

Conclusions: In kidney transplants, elevated plasma dd-cfDNA is associated with 3 distinct molecular states in the donor tissue: AMR, recent parenchymal injury (including cell cycling), and TCMR, potentially complicated by parenchymal disruption. Moreover, subtle rejection- and injury-related changes in the donor tissue can contribute to dd-cfDNA elevations in transplants considered to have no rejection or injury.


Conflict of interest statement

P.F.H. has shares in Transcriptome Sciences Inc (TSI), a University of Alberta research company with an interest in molecular diagnostics, and is a consultant to Natera Inc. All Natera Inc authors are employees and own equity at Natera Inc. The other authors declare no conflicts of interest.

Figures

FIGURE 1.
FIGURE 1.
CONSORT 2010 flow diagram and the study design. CONSORT, Consolidated Standards of Reporting Trials; dd-cfDNA, donor-derived cell-free DNA; MMDx, Molecular Microscope Diagnostic System; PFH, Philip F. Halloran.
FIGURE 2.
FIGURE 2.
Time series of estimated quantity of host cell-free DNA (cp/mL), dd-cfDNA (cp/mL), and fraction dd-cfDNA (%) following transplant (A–F). Temporal patterns were estimated using binscatter regression. Shaded blue, gray, and red bands represent the confidence bands estimated by the binscatter method (A–C). Open circles represent individual biopsies and closed blue, gray, and red circles represent the conditional means dd-cfDNA for each bin and their confidence intervals (A–F). Solid lines represent the predicted dd-cfDNA (A–F). Bars at the top and right margins of the plots represent stacked histograms of the distribution biopsies according to estimated plasma cfDNA and time posttransplant (A–F). Performance of dd-cfDNA in predicting MMDx all-rejection was assessed by ROC curves with diagonal dashed lines representing the 1:1 ratio of sensitivity and specificity (G). The probability of rejection was modeled by logistic regression predicting MMDx all-rejection with open circles represent individual biopsies and solid lines representing the probability of MMDx rejection predicted by logistic regression (H and I). Vertical dashed lines represent defined time points (ie, 1, 3, 5, and 10 y; A–F), and the optimal cutoffs (H and I). dd-cfDNA, donor-derived cell-free DNA; MMDx, Molecular Microscope Diagnostic System.
FIGURE 3.
FIGURE 3.
Measured dd-cfDNA (cp/mL) in MMDx subgroups (A), rejection archetypes (B), injury archetypes (C), and injury archetypes without MMDx rejection (D). Plasma dd-cfDNA varied significantly across MMDx subgroups, rejection archetypes, injury archetypes, and injury archetypes without MMDx rejection. Colored circles represent dd-cfDNA results for individual biopsies. Gray boxes represent the interquartile range, with whiskers representing 1.5× the interquartile range. Median and geometric mean values for each subgroup/archetype are represented by horizontal black and red bars, respectively. Lettering display above each subgroup/archetype represents post-hoc test results among groups. Groups/archetypes sharing the same letter, within each panel, are not significantly different from one another. AMR, antibody-mediated rejection; cAKI, clinical acute kidney injury; CKD, chronic kidney disease; dd-cfDNA, donor-derived cell-free DNA; EAMR, early-stage AMR; FAMR, fully-developed AMR; LAMR, late-stage AMR; mAKI, molecular acute kidney injury; MMDx, Molecular Microscope Diagnostic System; NR, no rejection; NRNI, MMDx Normal and archetypal No injury; pAMR, possible AMR; pTCMR, possible TCMR; TCMR, T cell–mediated rejection.
FIGURE 4.
FIGURE 4.
Differential expression and correlation genescape demonstrating gradients in gene associations with dd-cfDNA by MMDx subgroups. Biopsies called AMR (A), TCMR (B), and cAKI (C) were pooled with biopsies called NRNI in attempt to isolate the gradient moving from low intensity to high intensity for each disease state. Differential expression is represented FDR in FC in AMR, TCMR, and cAKI vs NRNI. Correlations are expressed as SCC of gene expression with dd-cfDNA within each grouping. Individual genes are represented as colored circles. Circles are first colored to show genes with significantly positive SCCs (green), significantly negative SCCs (turquoise), and nonsignificant SCCs (gray). Circles/genes are then colored by their annotation with major disease phenotypes as described in the Supplemental Material (SDC, http://links.lww.com/TP/C935). Finally, the top 20 genes by SCC are labeled and colored (mauve). AF, atrophy-fibrosis; AMR, antibody–mediated rejection; cAKI, clinical acute kidney injury; dd-cfDNA, donor-derived cell-free DNA; FC, fold change; FDR, false discovery rate; MMDx, Molecular Microscope Diagnostic System; NK, natural killer; NRNI, MMDx Normal and archetypal No injury; SCC, Spearman correlation coefficients; TCMR, T cell–mediated rejection.
FIGURE 5.
FIGURE 5.
Spearman correlation gene expression with dd-cfDNA in IQR-filtered probesets compared with Spearman correlations with AMRProb (A) and TCMRProb (B) classifier scores. Individual probesets are represented as colored circles. Circles are first colored to show probesets with significantly positive SCCs (green), significantly negative SCCs (turquoise), and nonsignificant SCCs (gray). Circles/probesets are then colored by their gene annotation with major disease phenotypes as described in the Supplemental Material (SDC, http://links.lww.com/TP/C935). AMR, antibody–mediated rejection; dd-cfDNA, donor-derived cell-free DNA; IQR, interquartile range; SCC, Spearman correlation coefficients; TCMR, T cell–mediated rejection.
FIGURE 6.
FIGURE 6.
Relationships of estimated quantity dd-cfDNA (cp/mL) with the top selected molecular scores by Spearman correlation coefficient in all biopsies (A–C) compared with NRNI biopsies (D–F). Colored circles represent individual biopsies and their MMDx (A–C) and dd-cfDNA (D–F) diagnoses. Black solid curves represent the AIC-weighted model-averaged predictions from all model fits (excluding those that did not converge). Dashed horizontal lines in D–F indicate the interim dd-cfDNA threshold of 78 cp/mL. Vertical solid lines in D–F represent median molecular scores within NRNI. See Supplemental Material (SDC, http://links.lww.com/TP/C935) for detailed summary of the model select and averaging method, including statistics for each model used in the model average. AIC, Akaike information criterion; AMR, antibody-mediated rejection; dd-cfDNA, donor-derived cell-free DNA; mAKI, molecular acute kidney injury; MMDx, Molecular Microscope Diagnostic System; NRNI, MMDx Normal and archetypal No injury; SCC, Spearman correlation coefficients; TCMR, T cell–mediated rejection.

References

    1. Moinuddin I, Kumar D, Kamal L, et al. Calibration of donor-derived cell-free DNA criteria for rejection with molecular diagnoses of kidney transplant biopsies. Am J Transplant. 2020;20:680–680.
    1. Huang E, Sethi S, Peng A, et al. Early clinical experience using donor-derived cell-free DNA to detect rejection in kidney transplant recipients. Am J Transplant. 2019;19:1663–1670. - PubMed
    1. Dengu F. Next-generation sequencing methods to detect donor-derived cell-free DNA after transplantation. Transplant Rev (Orlando). 2020;34:100542. - PubMed
    1. Oellerich M, Shipkova M, Asendorf T, et al. Absolute quantification of donor-derived cell-free DNA as a marker of rejection and graft injury in kidney transplantation: Results from a prospective observational study. Am J Transplant. 2019;19:3087–3099. - PMC - PubMed
    1. Bloom RD, Bromberg JS, Poggio ED, et al. ; Circulating Donor-Derived Cell-Free DNA in Blood for Diagnosing Active Rejection in Kidney Transplant Recipients (DART) Study Investigators. Cell-free DNA and active rejection in kidney allografts. J Am Soc Nephrol. 2017;28:2221–2232. - PMC - PubMed

Associated data