

Small airway fibroblasts from patients with chronic obstructive pulmonary disease exhibit cellular senescence
- PMID: 38150543
- PMCID: PMC11281792
- DOI: 10.1152/ajplung.00419.2022
Small airway fibroblasts from patients with chronic obstructive pulmonary disease exhibit cellular senescence
Abstract
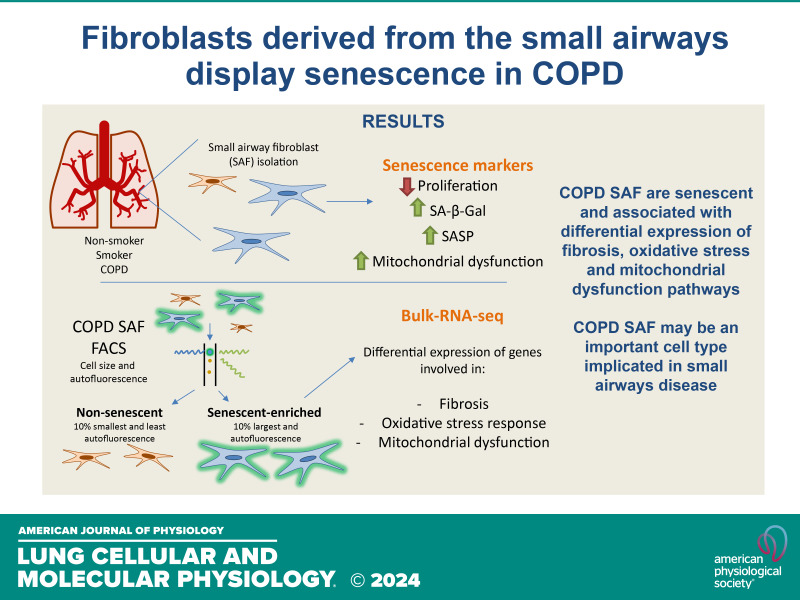
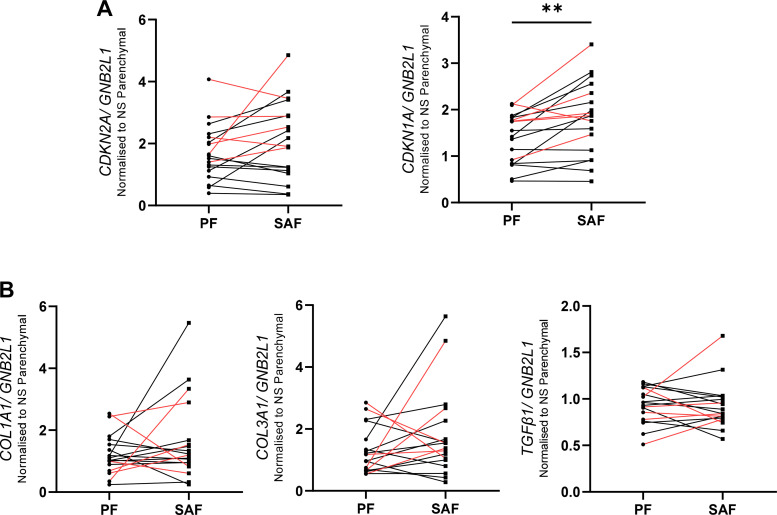
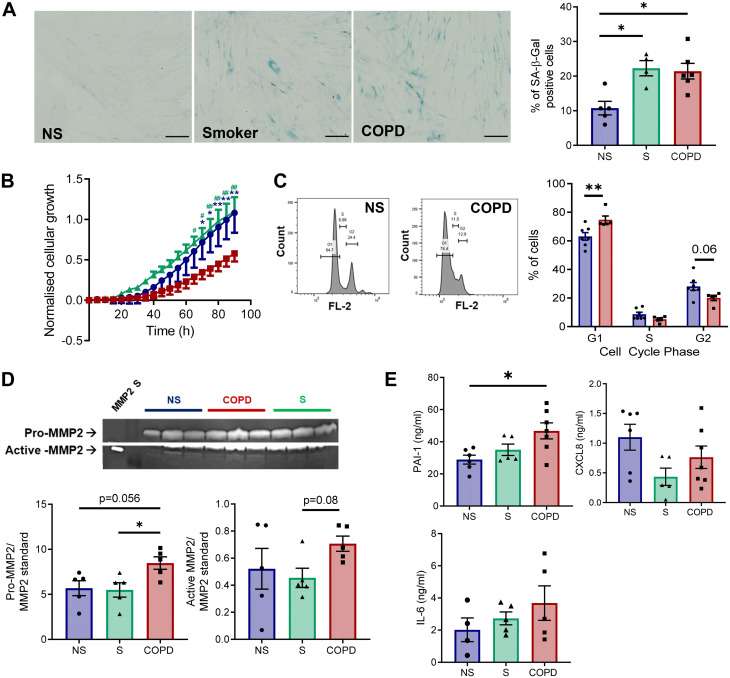
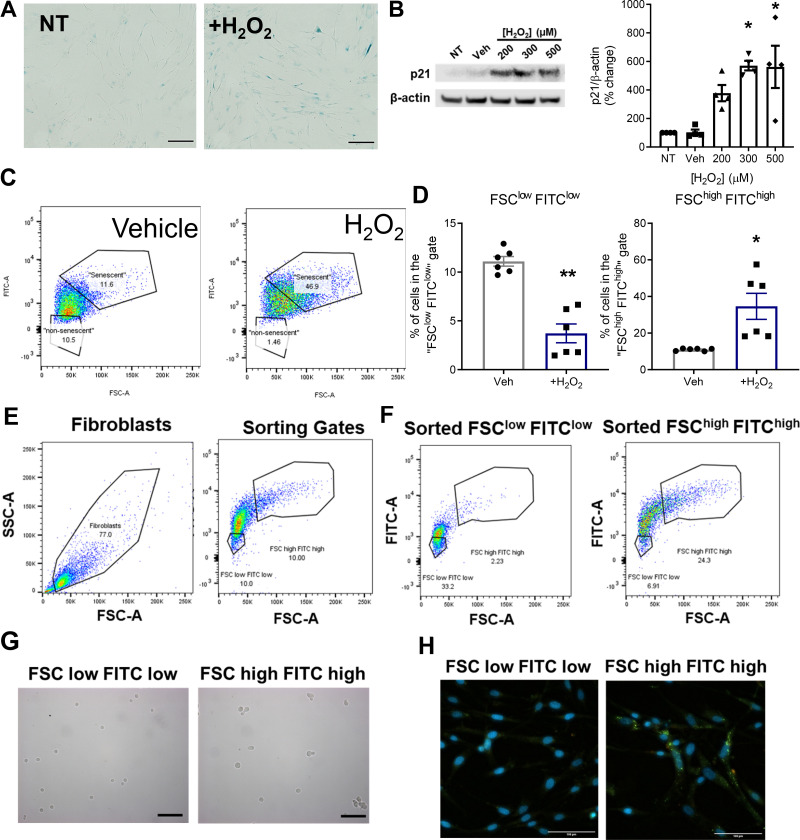
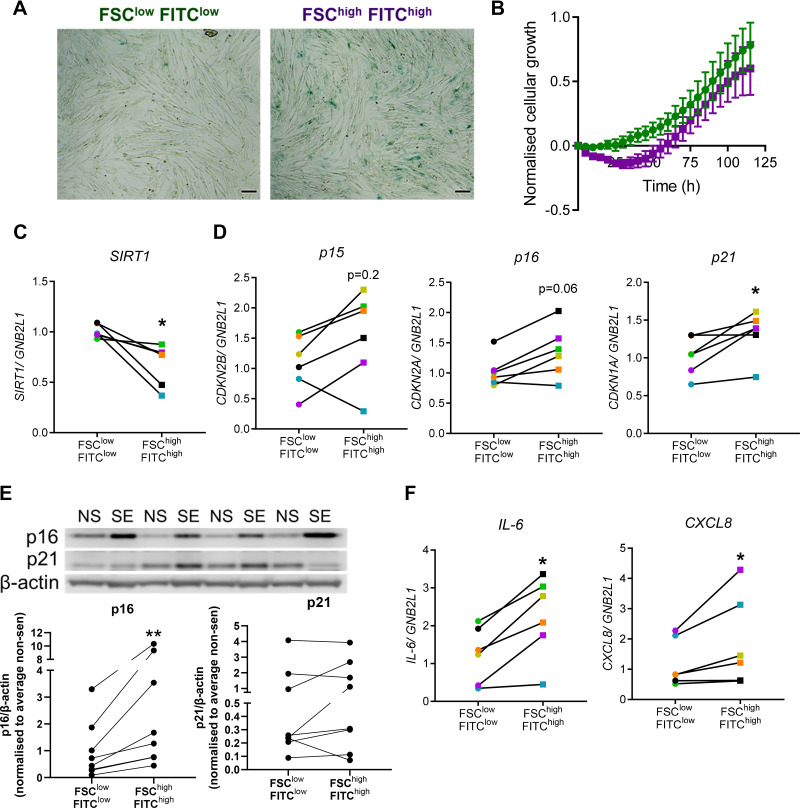
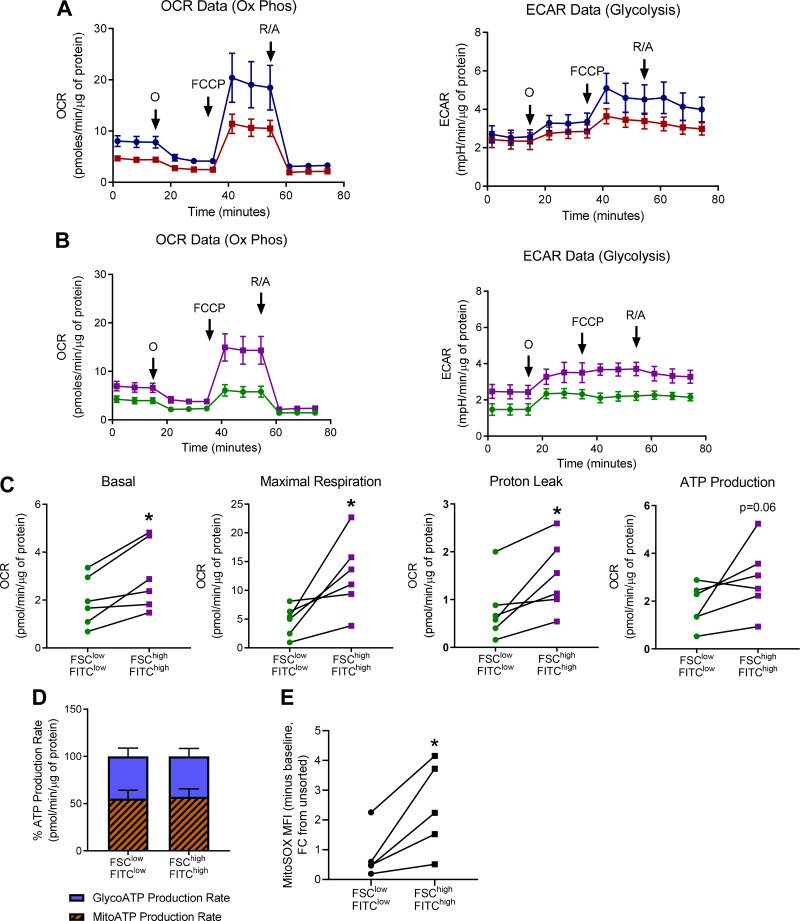
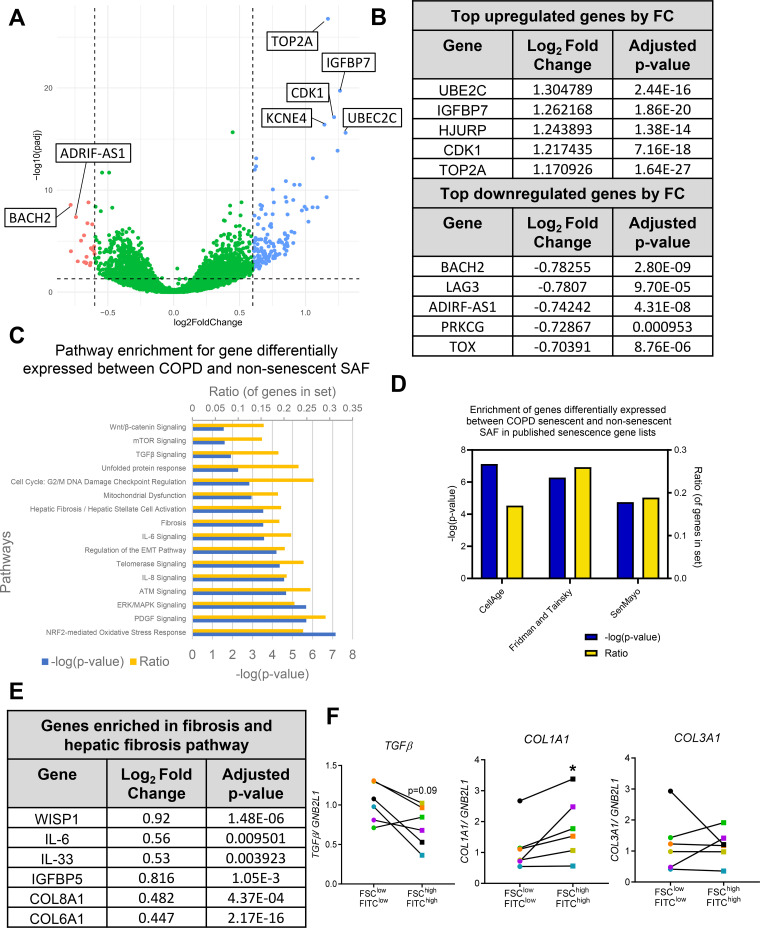
Small airway disease (SAD) is a key early-stage pathology of chronic obstructive pulmonary disease (COPD). COPD is associated with cellular senescence whereby cells undergo growth arrest and express the senescence-associated secretory phenotype (SASP) leading to chronic inflammation and tissue remodeling. Parenchymal-derived fibroblasts have been shown to display senescent properties in COPD, however small airway fibroblasts (SAFs) have not been investigated. Therefore, this study investigated the role of these cells in COPD and their potential contribution to SAD. To investigate the senescent and fibrotic phenotype of SAF in COPD, SAFs were isolated from nonsmoker, smoker, and COPD lung resection tissue (n = 9-17 donors). Senescence and fibrotic marker expressions were determined using iCELLigence (proliferation), qPCR, Seahorse assay, and ELISAs. COPD SAFs were further enriched for senescent cells using FACSAria Fusion based on cell size and autofluorescence (10% largest/autofluorescent vs. 10% smallest/nonautofluorescent). The phenotype of the senescence-enriched population was investigated using RNA sequencing and pathway analysis. Markers of senescence were observed in COPD SAFs, including senescence-associated β-galactosidase, SASP release, and reduced proliferation. Because the pathways driving this phenotype were unclear, we used cell sorting to enrich senescent COPD SAFs. This population displayed increased p21CIP1 and p16INK4a expression and mitochondrial dysfunction. RNA sequencing suggested these senescent cells express genes involved in oxidative stress response, fibrosis, and mitochondrial dysfunction pathways. These data suggest COPD SAFs are senescent and may be associated with fibrotic properties and mitochondrial dysfunction. Further understanding of cellular senescence in SAFs may lead to potential therapies to limit SAD progression.NEW & NOTEWORTHY Fibroblasts and senescence are thought to play key roles in the pathogenesis of small airway disease and COPD; however, the characteristics of small airway-derived fibroblasts are not well explored. In this study we isolate and enrich the senescent small airway-derived fibroblast (SAF) population from COPD lungs and explore the pathways driving this phenotype using bulk RNA-seq.
Keywords: COPD; fibroblast; senescence; small airway disease.
Conflict of interest statement
C.L.W., S.M., and L.M. are or were employed by AstraZeneca and some may have stock or stock options. P.J.B. is Advisor and on scientific advisory board for AstraZeneca, Boehringer Ingelheim, Teva Lectures on behalf of AstraZeneca, Boehringer-Ingelheim, Novartis, Teva. None of the other authors has any conflicts of interest, financial or otherwise, to disclose.
Figures
Similar articles
-
COPD-derived fibroblasts secrete higher levels of senescence-associated secretory phenotype proteins.Thorax. 2021 May;76(5):508-511. doi: 10.1136/thoraxjnl-2020-215114. Epub 2020 Dec 3. Thorax. 2021. PMID: 33273021 Free PMC article.
-
Heme oxygenase-1 induction attenuates senescence in chronic obstructive pulmonary disease lung fibroblasts by protecting against mitochondria dysfunction.Aging Cell. 2018 Dec;17(6):e12837. doi: 10.1111/acel.12837. Epub 2018 Oct 19. Aging Cell. 2018. PMID: 30341816 Free PMC article.
-
Lower levels of senescence in human lung mesenchymal stromal cells compared with lung fibroblasts: implications for tissue regeneration in COPD.Am J Physiol Lung Cell Mol Physiol. 2025 Jun 1;328(6):L858-L865. doi: 10.1152/ajplung.00366.2024. Epub 2025 Apr 30. Am J Physiol Lung Cell Mol Physiol. 2025. PMID: 40304287
-
Airway Epithelium Senescence as a Driving Mechanism in COPD Pathogenesis.Biomedicines. 2023 Jul 23;11(7):2072. doi: 10.3390/biomedicines11072072. Biomedicines. 2023. PMID: 37509711 Free PMC article. Review.
-
Small airway fibrosis in COPD.Int J Biochem Cell Biol. 2019 Nov;116:105598. doi: 10.1016/j.biocel.2019.105598. Epub 2019 Sep 6. Int J Biochem Cell Biol. 2019. PMID: 31499176 Review.
Cited by
-
Effect of physical activity in lymphocytes senescence burden in patients with COPD.Am J Physiol Lung Cell Mol Physiol. 2024 Oct 1;327(4):L464-L472. doi: 10.1152/ajplung.00151.2024. Epub 2024 Aug 6. Am J Physiol Lung Cell Mol Physiol. 2024. PMID: 39104316 Free PMC article.
-
Unveiling mechanisms of lung aging in COPD: A promising target for therapeutics development.Chin Med J Pulm Crit Care Med. 2024 Sep 17;2(3):133-141. doi: 10.1016/j.pccm.2024.08.007. eCollection 2024 Sep. Chin Med J Pulm Crit Care Med. 2024. PMID: 39403409 Free PMC article. Review.
-
Senescence at the Crossroads of Lung Development and Injury.Am J Respir Cell Mol Biol. 2025 Aug;73(2):161-162. doi: 10.1165/rcmb.2024-0564ED. Am J Respir Cell Mol Biol. 2025. PMID: 40153604 Free PMC article. No abstract available.
-
Senolytic therapy reduces inflammation in epithelial cells from COPD patients and in smoke-exposure mice.Front Med (Lausanne). 2025 Apr 28;12:1451056. doi: 10.3389/fmed.2025.1451056. eCollection 2025. Front Med (Lausanne). 2025. PMID: 40357269 Free PMC article.
-
Exploring the mechanisms of chronic obstructive pulmonary disease and Crohn's disease: a bioinformatics-based study.Sci Rep. 2024 Nov 10;14(1):27461. doi: 10.1038/s41598-024-78697-5. Sci Rep. 2024. PMID: 39523420 Free PMC article.
References
-
- Amsellem V, Gary-Bobo G, Marcos E, Maitre B, Chaar V, Validire P, Stern J-B, Noureddine H, Sapin E, Rideau D, Hue S, Le Corvoisier P, Le Gouvello S, Dubois-Randé J-L, Boczkowski J, Adnot S. Telomere dysfunction causes sustained inflammation in chronic obstructive pulmonary disease. Am J Respir Crit Care Med 184: 1358–1366, 2011. doi:10.1164/rccm.201105-0802OC. - DOI - PubMed
MeSH terms
Supplementary concepts
Grants and funding
LinkOut - more resources
Full Text Sources
Medical