. 2024 Jan 8;10(1):575-587.
doi: 10.1021/acsbiomaterials.3c01200. Epub 2023 Dec 27.

Immune Checkpoint-Blocking Nanocages Cross the Blood-Brain Barrier and Impede Brain Tumor Growth

Affiliations

Immune Checkpoint-Blocking Nanocages Cross the Blood-Brain Barrier and Impede Brain Tumor Growth

Minseong Kim et al. ACS Biomater Sci Eng. .

Abstract

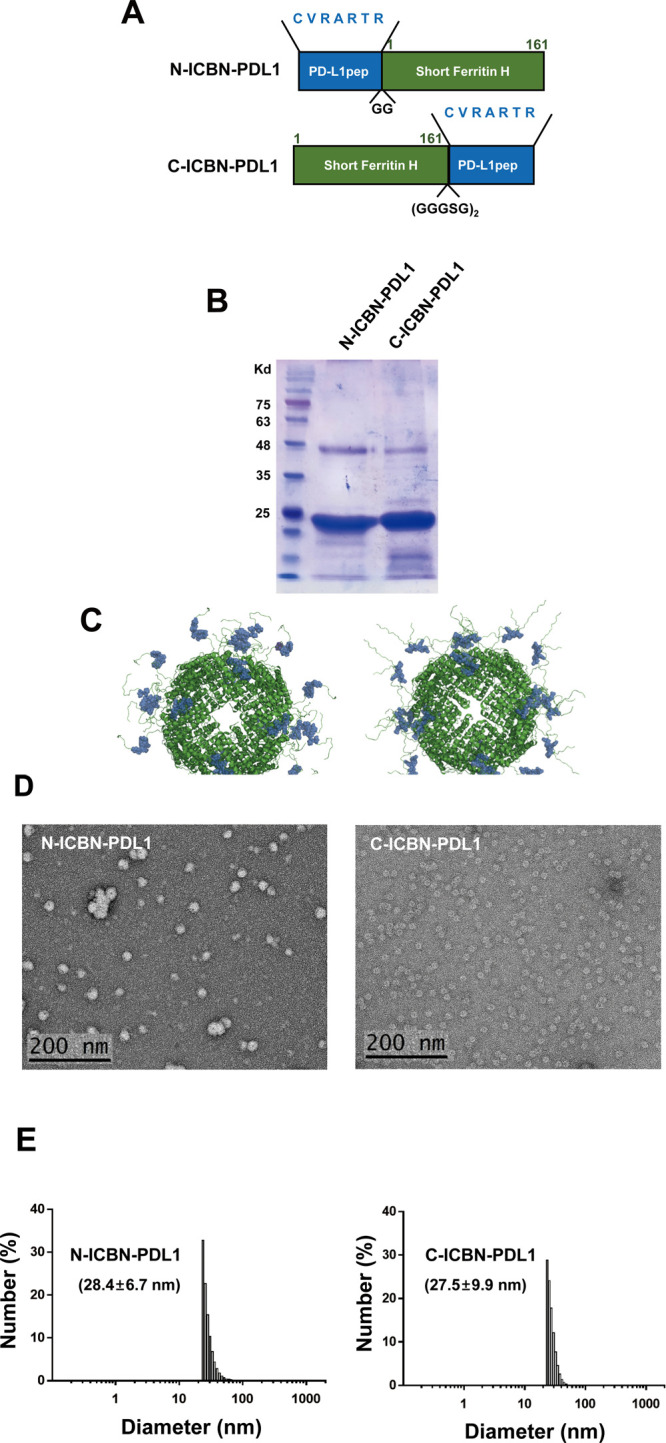
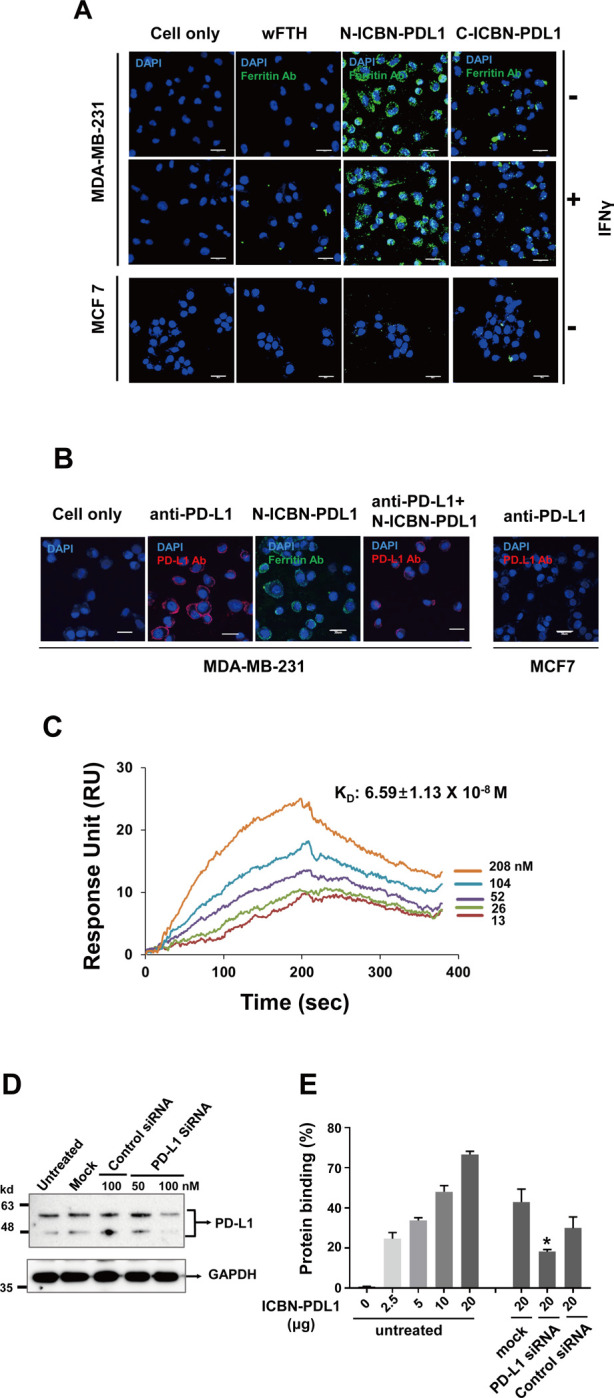
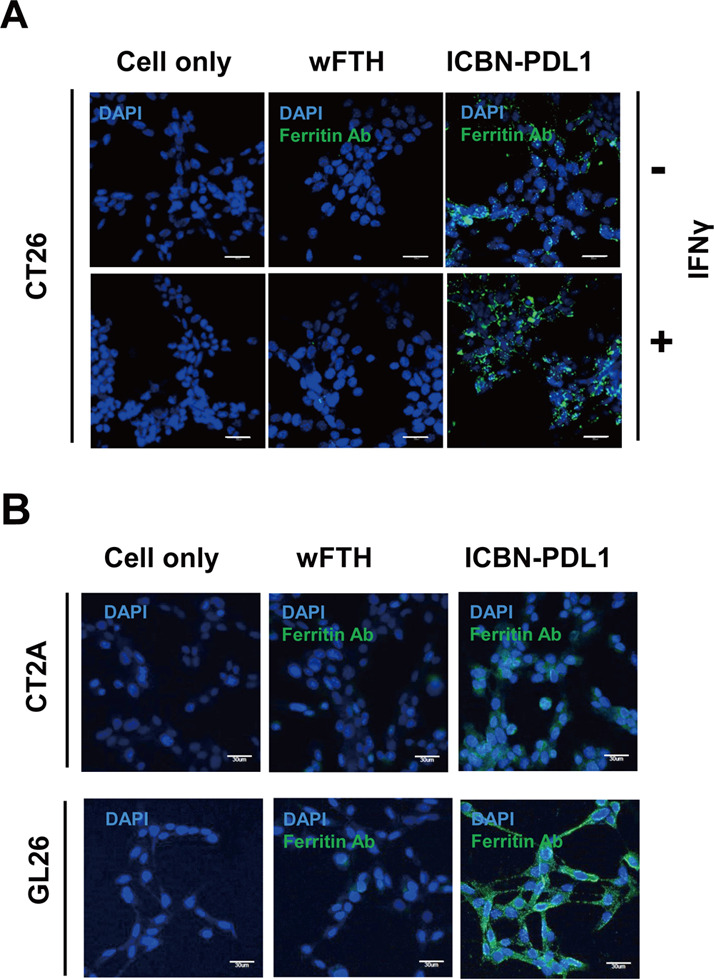
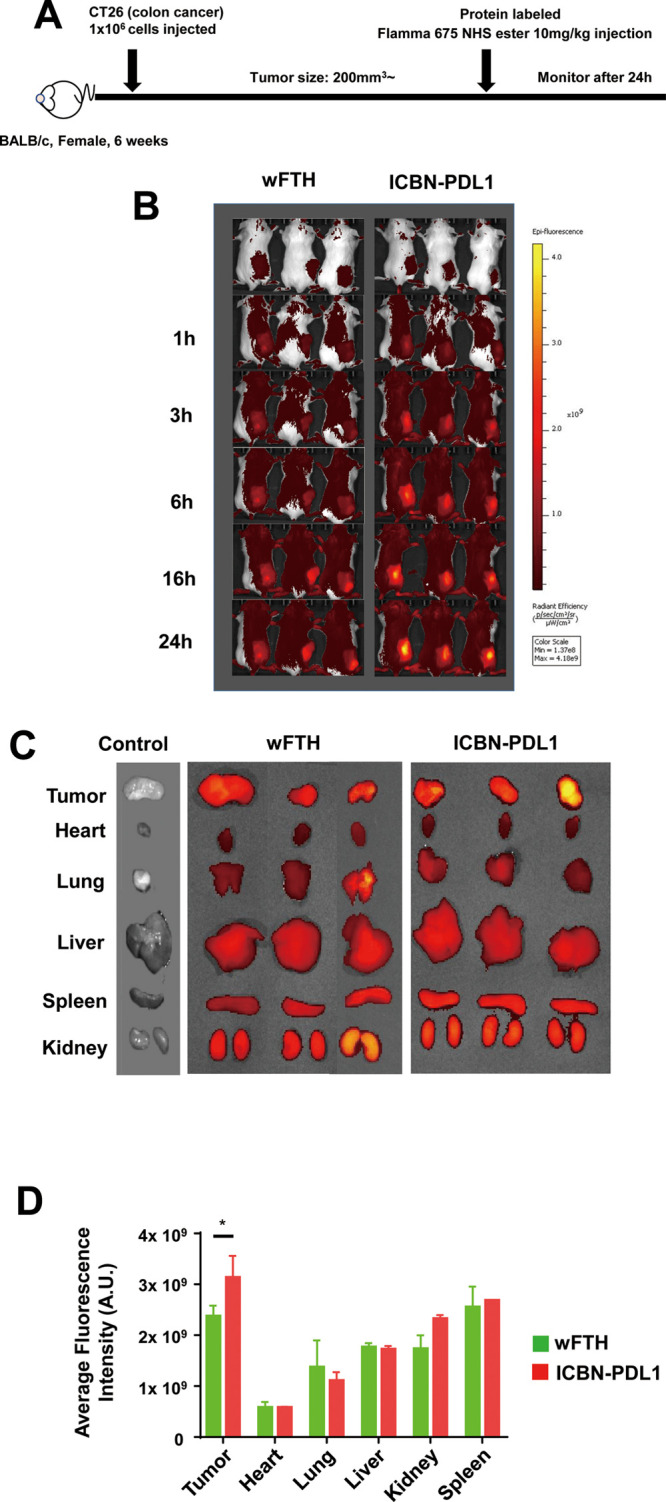
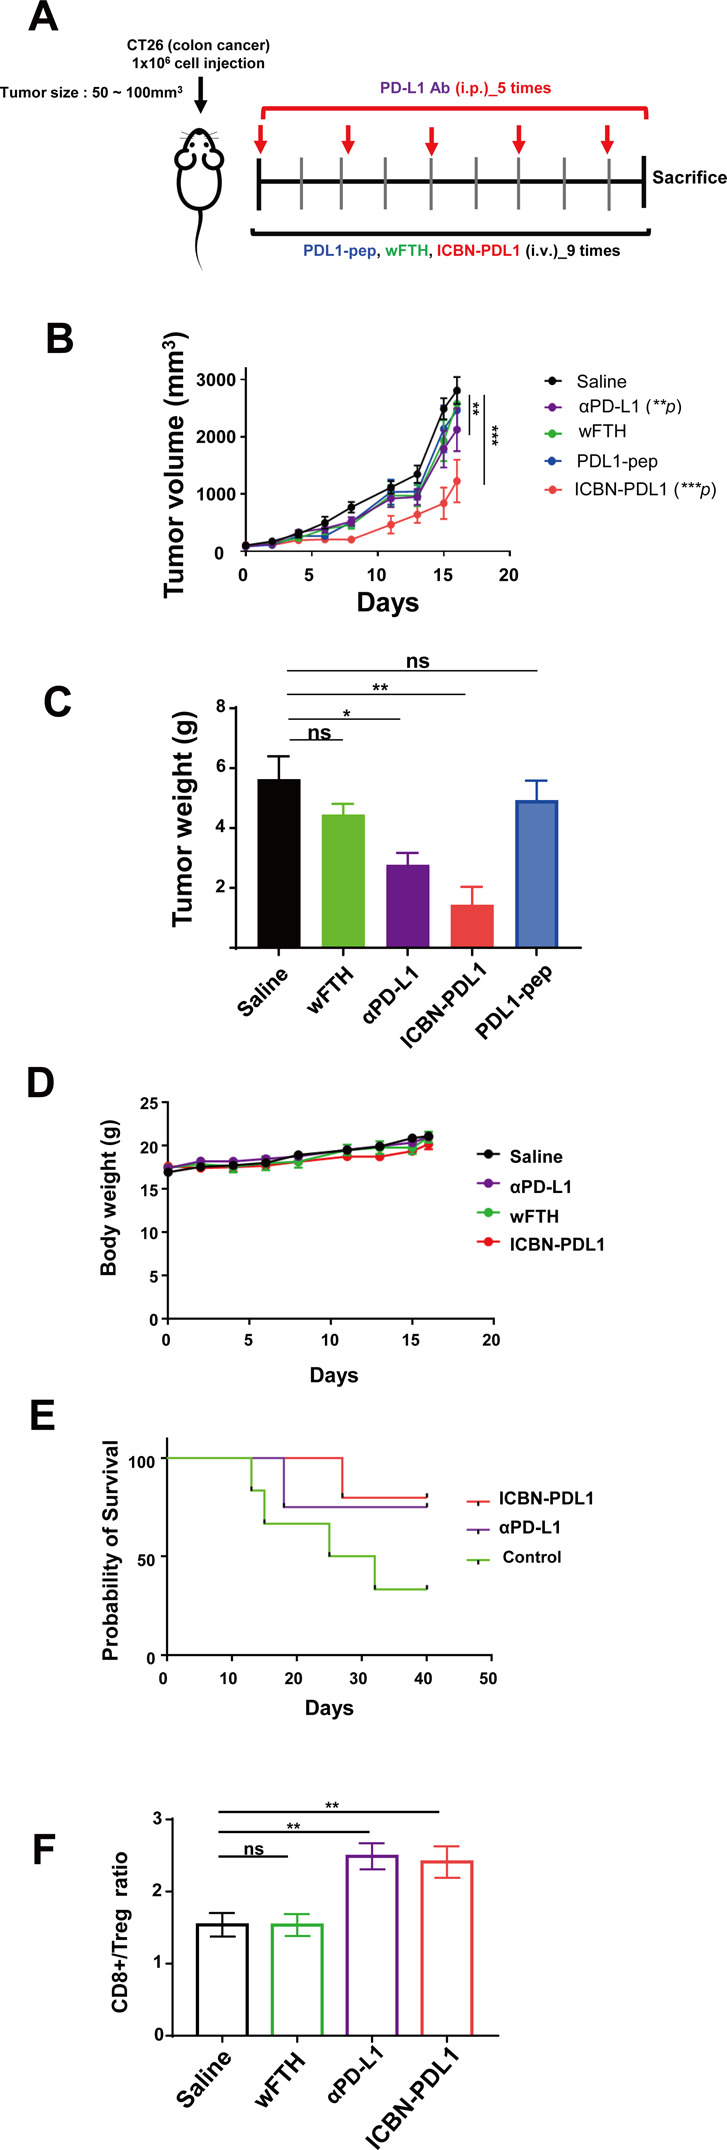
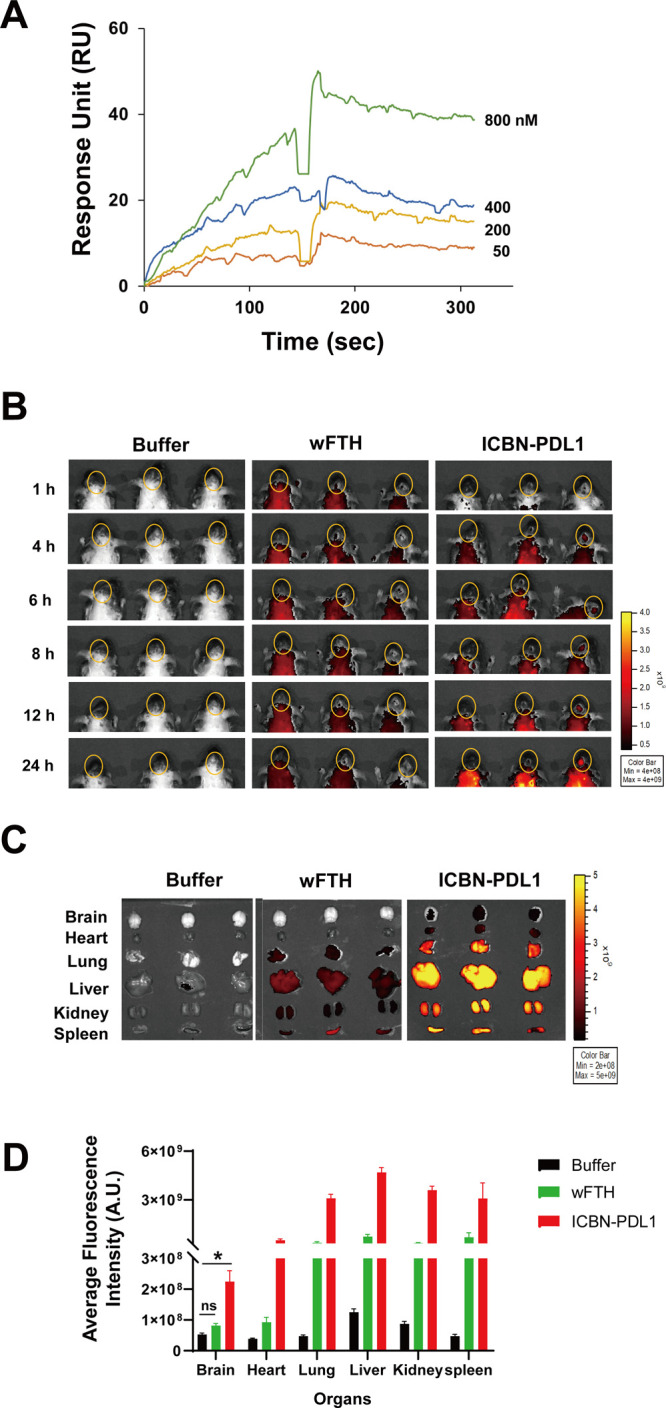
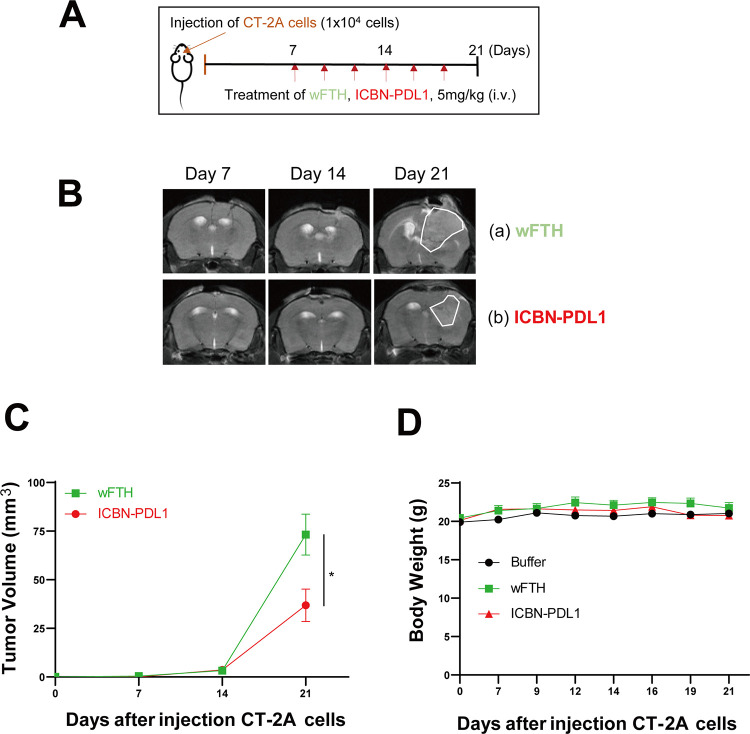
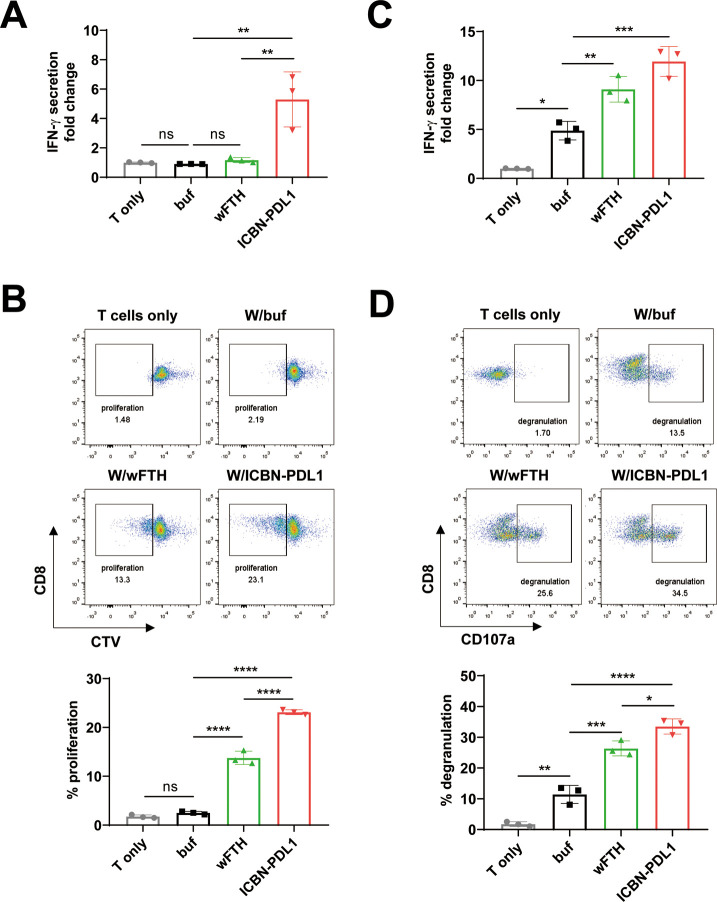
Glioblastoma (GBM) is the deadliest tumor of the central nervous system, with a median survival of less than 15 months. Despite many trials, immune checkpoint-blocking (ICB) therapies using monoclonal antibodies against the PD-1/PD-L1 axis have demonstrated only limited benefits for GBM patients. Currently, the main hurdles in brain tumor therapy include limited drug delivery across the blood-brain barrier (BBB) and the profoundly immune-suppressive microenvironment of GBM. Thus, there is an urgent need for new therapeutics that can cross the BBB and target brain tumors to modulate the immune microenvironment. To this end, we developed an ICB strategy based on the BBB-permeable, 24-subunit human ferritin heavy chain, modifying the ferritin surface with 24 copies of PD-L1-blocking peptides to create ferritin-based ICB nanocages. The PD-L1pep ferritin nanocages first demonstrated their tumor-targeting and antitumor activities in an allograft colon cancer model. Next, we found that these PD-L1pep ferritin nanocages efficiently penetrated the BBB and targeted brain tumors through specific interactions with PD-L1, significantly inhibiting tumor growth in an orthotopic intracranial tumor model. The addition of PD-L1pep ferritin nanocages to triple in vitro cocultures of T cells, GBM cells, and glial cells significantly inhibited PD-1/PD-L1 interactions and restored T-cell activity. Collectively, these findings indicate that ferritin nanocages displaying PD-L1-blocking peptides can overcome the primary hurdle of brain tumor therapy and are, therefore, promising candidates for treating GBM.

Keywords: PD-L1 binding peptide; blood brain barrier; ferritin; glioblastoma; immune checkpoint; nanocage.


Conflict of interest statement

The authors declare no competing financial interest.

Figures

Figure 1
Figure 1
(A) Schematic of the PD-L1pep-ferritin nanocage. PD-L1pep (CVRARTR) was ligated into the N-terminus of the short version of ferritin (N-ICBN-PDL1), and PD-L1pep was ligated into the C-terminus of the short version of ferritin (C-ICBN-PDL1). (B) SDS–PAGE of purified PD-L1pep-ferritin nanocages. (C) 3D models of the three PD-L1pep-ferritin nanocages were evaluated using computer simulation. (D) Transmission electron microscopy image of the PD-L1pep-ferritin nanocages. (E) DLS analysis of the PD-L1pep-ferritin nanocages
Figure 2
Figure 2
(A) MDA-MB-231 or MCF7 cells were treated with N-ICBN-PDL1, C-ICBN-PDL1, or wild-type ferritin (wFTH) at 4 °C for 1 h before and after treatment with IFN-γ (25 ng/mL); binding was monitored using antiferritin antibody (green). Nuclei were visualized by counterstaining with DAPI (blue). Scale bar: 30 μm. (B) Confocal microscopy images of MDA-MB-231cells incubated with anti-PDL1 antibody (red), N-ICBN-PDL1 (green), or anti-PDL1 antibody + N-ICBN-PDL1. (C) Surface plasmon resonance analysis for the binding kinetics of PD-L1 and ICBN-PDL1. RU values of different concentrations of ICBN-PDL1 were measured to show association and dissociation of the interaction. (D) Knockdown of PD-L1 gene expression in MDA-MB-231 cells by a siRNA against PD-L1 at the indicated concentrations. Empty vector was transfected as control (mock). GAPDH was used as a control. (E) Percent binding of ICBN-PDL1 to MDA-MB-231 cells after the knockdown of PD-L1 expression. Empty vector was transfected as control (mock). Data represent mean ± SEM (*p < 0.05; one-way ANOVA).
Figure 3
Figure 3
(A) CT26 treated with N-ICBN-PDL1 or wild-type ferritin (wFTH) at 4 °C for 1 h before and after treatment with IFN-γ (25 ng/mL). (B) Mouse glioma cells, CT-2A or GL26 cells, were treated with ICBN-PDL1 or wild-type ferritin (wFTH) at 4 °C for 1 h; binding was monitored by antiferritin antibody (green). Nuclei were visualized by counterstaining with DAPI (blue). Scale bar: 30 μm.
Figure 4
Figure 4
(A) Experimental scheme to assess the biodistribution of ICBN-PDL1 in the CT26 allograft mouse model. Mice bearing CT26 tumors were intravenously injected with Flamma 675-labeled ICBN-PDL1 and wild-type ferritin heavy chain (wFTH), followed by in vivo scanning with the IVIS imaging system. (B) Images of the biodistribution of ICBN-PDL1 and wFTH. (C) Ex vivo biodistribution was examined at 24 h postinjection. (D) Average fluorescence intensity of each organ was measured. Data represent mean ± SEM (*p < 0.05; t test).
Figure 5
Figure 5
(A) Experimental scheme for antitumor treatments. CT26 syngeneic mouse colon tumor cells were subcutaneously inoculated in mice; treatments were initiated when the tumor size reached approximately 50–100 mm3. ICBN-PDL1 (10 mg/kg, n = 9), wFTH (10 mg/kg, n = 8), or PDL1pep (0.375 mg/kg, n = 9) was intravenously injected three times per week. Anti-PD-L1 antibody (10 mg/kg, n = 8) was intraperitoneally injected twice per week. (B) Tumor volumes after treatment. Statistically significant inhibition was observed in antimouse PD-L1 antibody (**p) and ICBN-PDL1-treated mice (***p). Data represent mean ± SEM (**p < 0.01, ***p < 0.001; t test). (C) Masses of excised tumors from each group at the end of the experiment. Data represent mean ± SEM (*p < 0.05, **p < 0.01; ns, not significant by t test). (D) Body weights. (E) Survival percentage of each group. (F) Ratio of CD8+/FoxP3+ cells from a gram of tumor tissue (n = 5/group). Data indicate mean ± SEM (**p < 0.01; ns, not significant by one-way ANOVA).
Figure 6
Figure 6
(A) Surface plasmon resonance analysis for the binding kinetics of TfR1 and ICBN-PDL1. RU values of different concentrations of ICBN-PDL1 were measured to show association and dissociation of the interaction. (B) Representative images of the upper body of mice. The yellow circle indicates the tumor. C57BL/6 mice were implanted with CT-2A glioma cells (3 × 10⁵). At 14 days after intracranial inoculation, the tumor-bearing mice were intravenously injected with Flamma 675-labeled ICBN-PDL1 or wFTH, followed by in vivo scanning with the IVIS imaging system. (C) Ex vivo biodistribution was examined at 24 h postinjection. (D) Average fluorescence intensity of each organ was measured. Data represent mean ± SEM (*p < 0.05; ns, not significant by t test).
Figure 7
Figure 7
(A) Experimental scheme for antitumor treatments. CT-2A syngeneic mouse brain tumor cells were implanted into the brains of C57BL/6 mice. Treatments were initiated at 7 days after confirming tumor growth by MRI. ICBN-PDL1 (5 mg/kg, n = 3) or wFTH (5 mg/kg, n = 3) was intravenously injected three times per week. (B) Representative brain MRI images showing tumor growth at 7, 14, and 21 days. The dotted line indicates the tumor region. (C) Tumor volumes measured by MRI. (D) Body weights. Data represent mean ± SEM (*p < 0.05; t test). The data presented are representative of three independent experiments.
Figure 8
Figure 8
CD8+ T cells were directly cocultured with CT-2A (A,B) or GL26 (C,D) glioma cells in the presence of glia. Cocultures were treated with 25 nM wild-type nanocage (wFTH), ICBN-PDL1, or their corresponding buffer (buf), respectively. Fold changes in IFN-γ secretion during triple coculture using (A) CT-2A or (C) GL26 cells with the indicated treatments. T cell-only group was used as a control. (B) Proliferation of CD8+ T cells during the coculture with CT-2A and primary glia. The percentages of daughter cells upon cell division were determined using CellTrace Violet (CTV) dye. (D) Expression of CD107a on the surface of CD8+ T cells after triple coculture using GL26. The percentages of CD107a+ populations in live CD8+ T cells were measured by flow cytometry. All graphs represent mean ± SD; n = 3 independent wells. (*p < 0.05, **p < 0.01, ***p < 0.001, and ****p < 0.0001; multiple comparisons were conducted using one-way ANOVA, followed by Tukey’s test.)

Similar articles

Cited by

References

    1. Chen D. S.; Mellman I. Elements of cancer immunity and the cancer-immune set point. Nature 2017, 541 (7637), 321–330. 10.1038/nature21349. - DOI - PubMed
    1. Yang Y. Cancer immunotherapy: harnessing the immune system to battle cancer. J. Clin. Invest. 2015, 125 (9), 3335–3337. 10.1172/JCI83871. - DOI - PMC - PubMed
    1. Wei S. C.; Duffy C. R.; Allison J. P. Fundamental Mechanisms of Immune Checkpoint Blockade Therapy. Cancer Discov 2018, 8 (9), 1069–1086. 10.1158/2159-8290.CD-18-0367. - DOI - PubMed
    1. Yaghoubi N.; Soltani A.; Ghazvini K.; Hassanian S. M.; Hashemy S. I. PD-1/ PD-L1 blockade as a novel treatment for colorectal cancer. Biomed. Pharmacother. 2019, 110, 312–318. 10.1016/j.biopha.2018.11.105. - DOI - PubMed
    1. Hino R.; Kabashima K.; Kato Y.; Yagi H.; Nakamura M.; Honjo T.; Okazaki T.; Tokura Y. Tumor cell expression of programmed cell death-1 ligand 1 is a prognostic factor for malignant melanoma. Cancer 2010, 116 (7), 1757–1766. 10.1002/cncr.24899. - DOI - PubMed

Publication types

MeSH terms